. 2021 Jun 2;109(11):1791-1809.e11.
doi: 10.1016/j.neuron.2021.04.026. Epub 2021 May 11.

A photoswitchable GPCR-based opsin for presynaptic inhibition

Affiliations

A photoswitchable GPCR-based opsin for presynaptic inhibition

Bryan A Copits et al. Neuron. .

Abstract

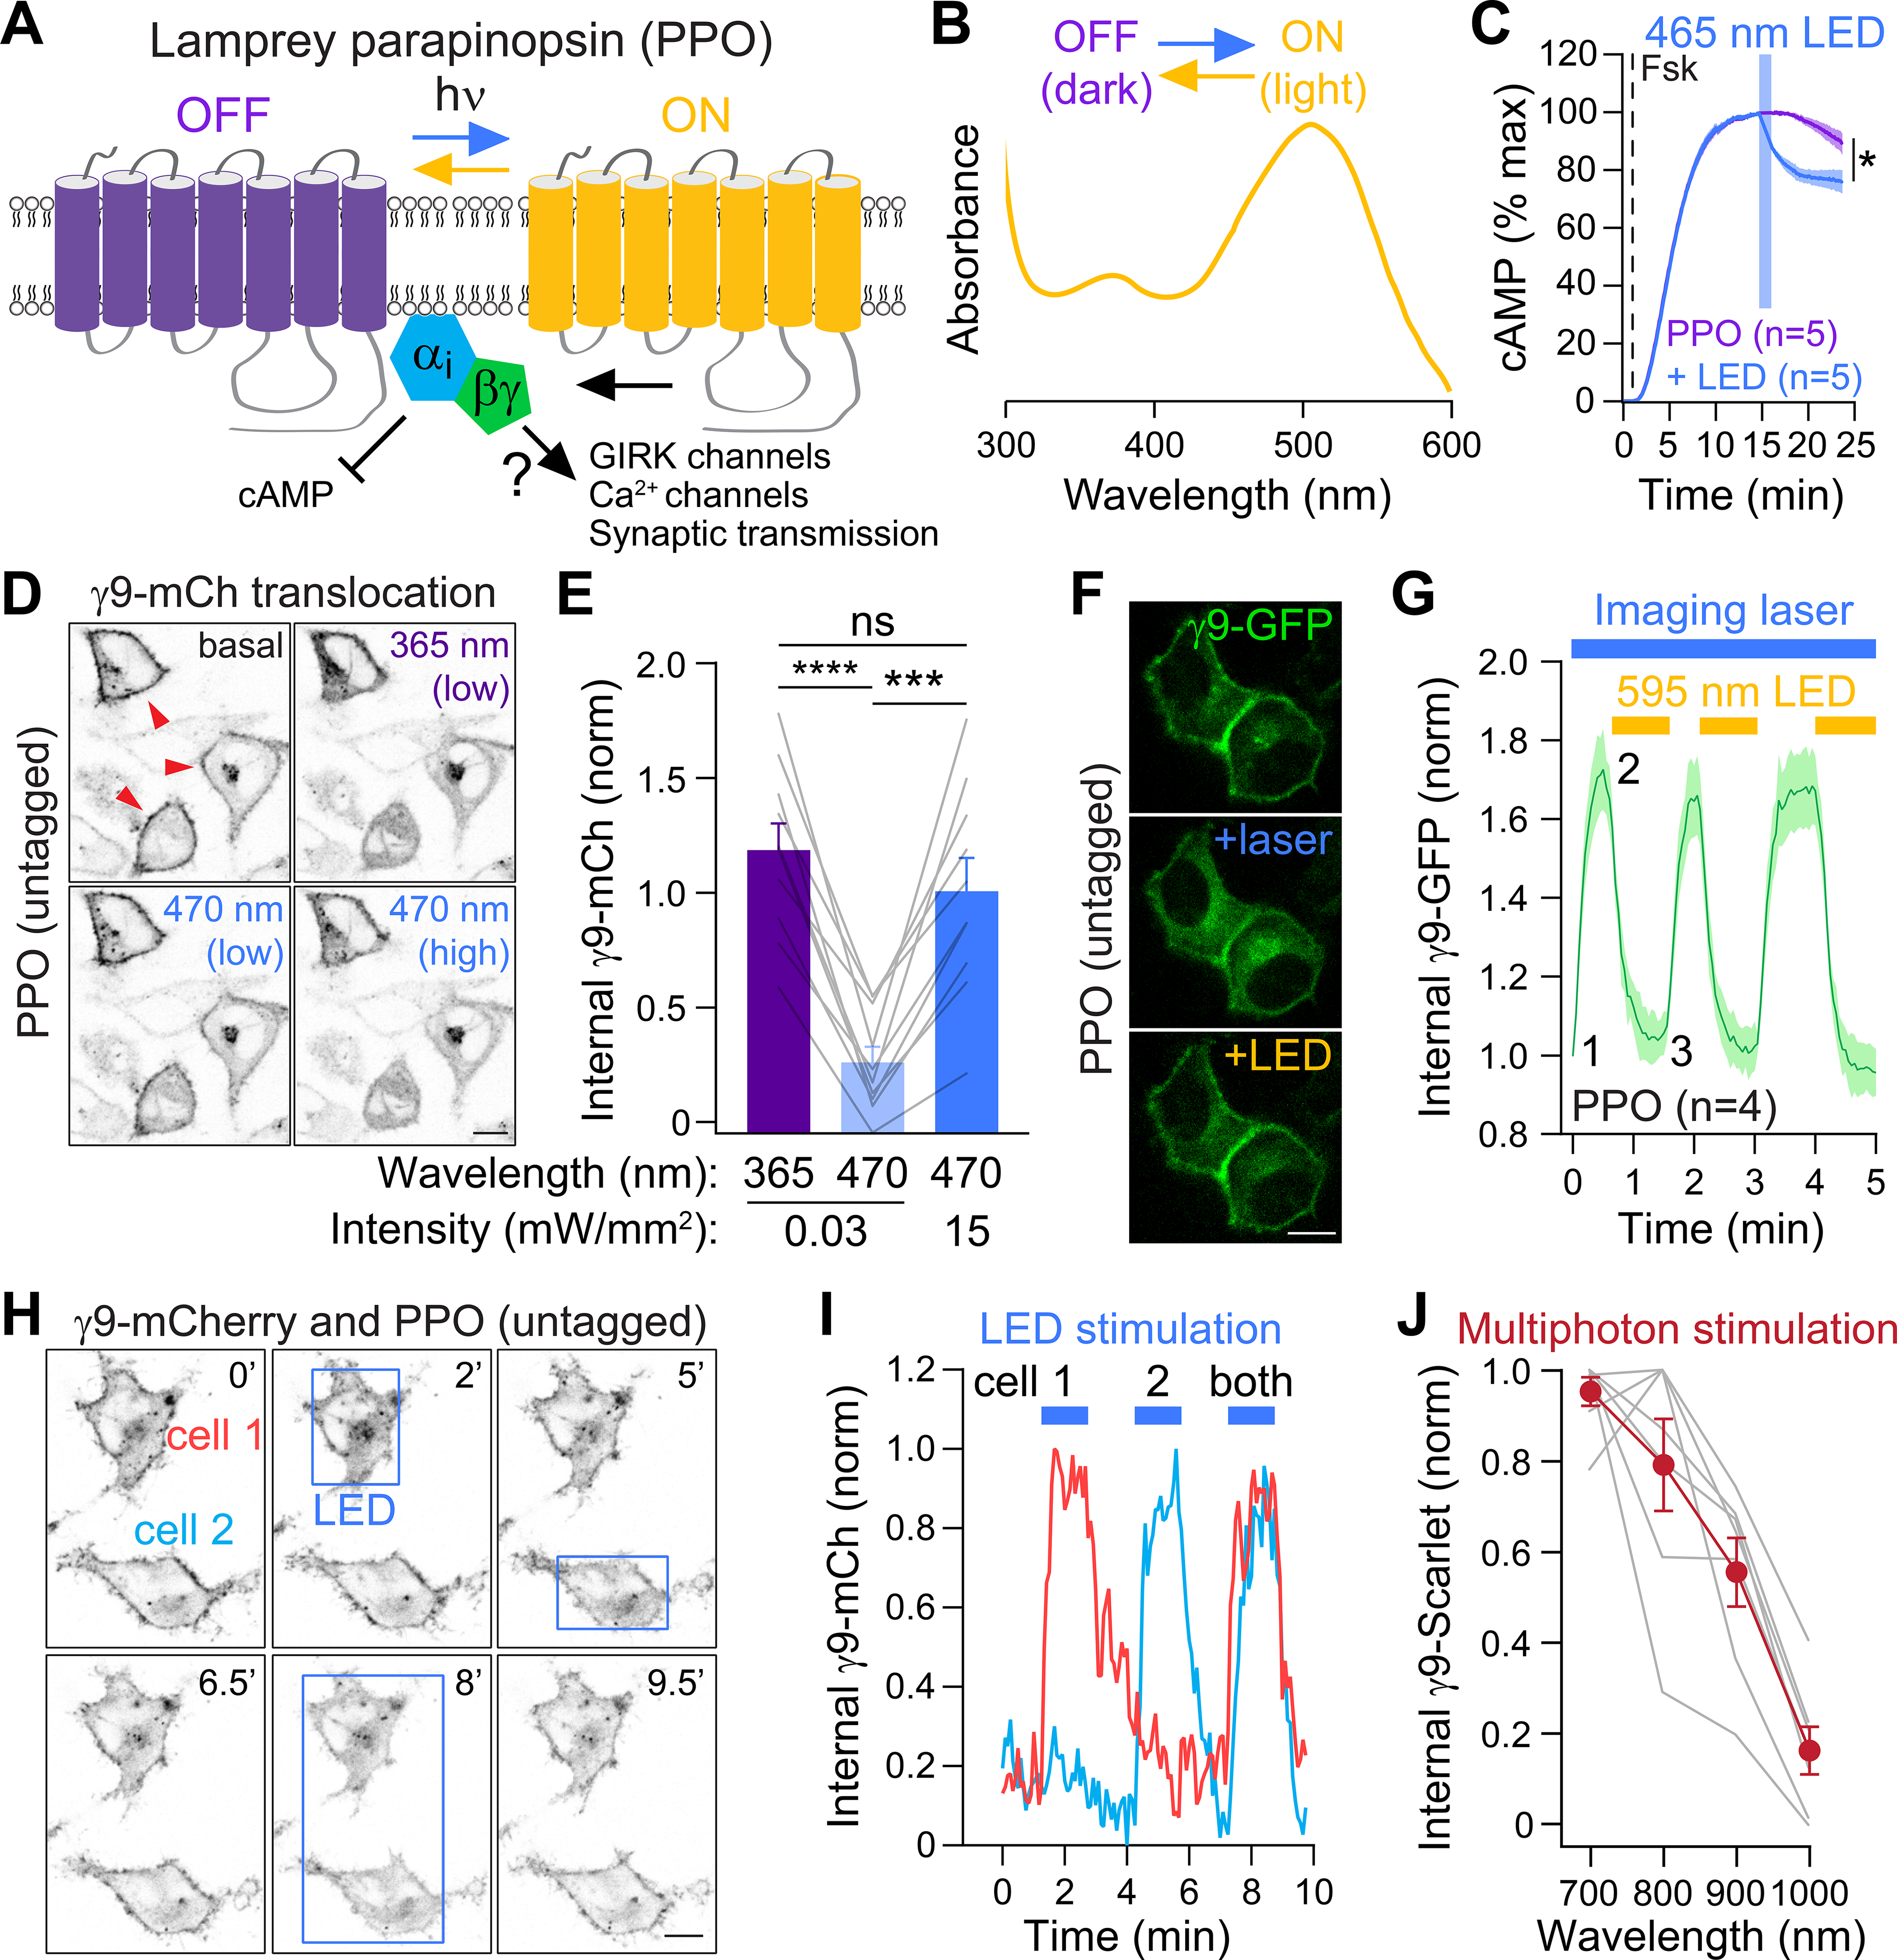
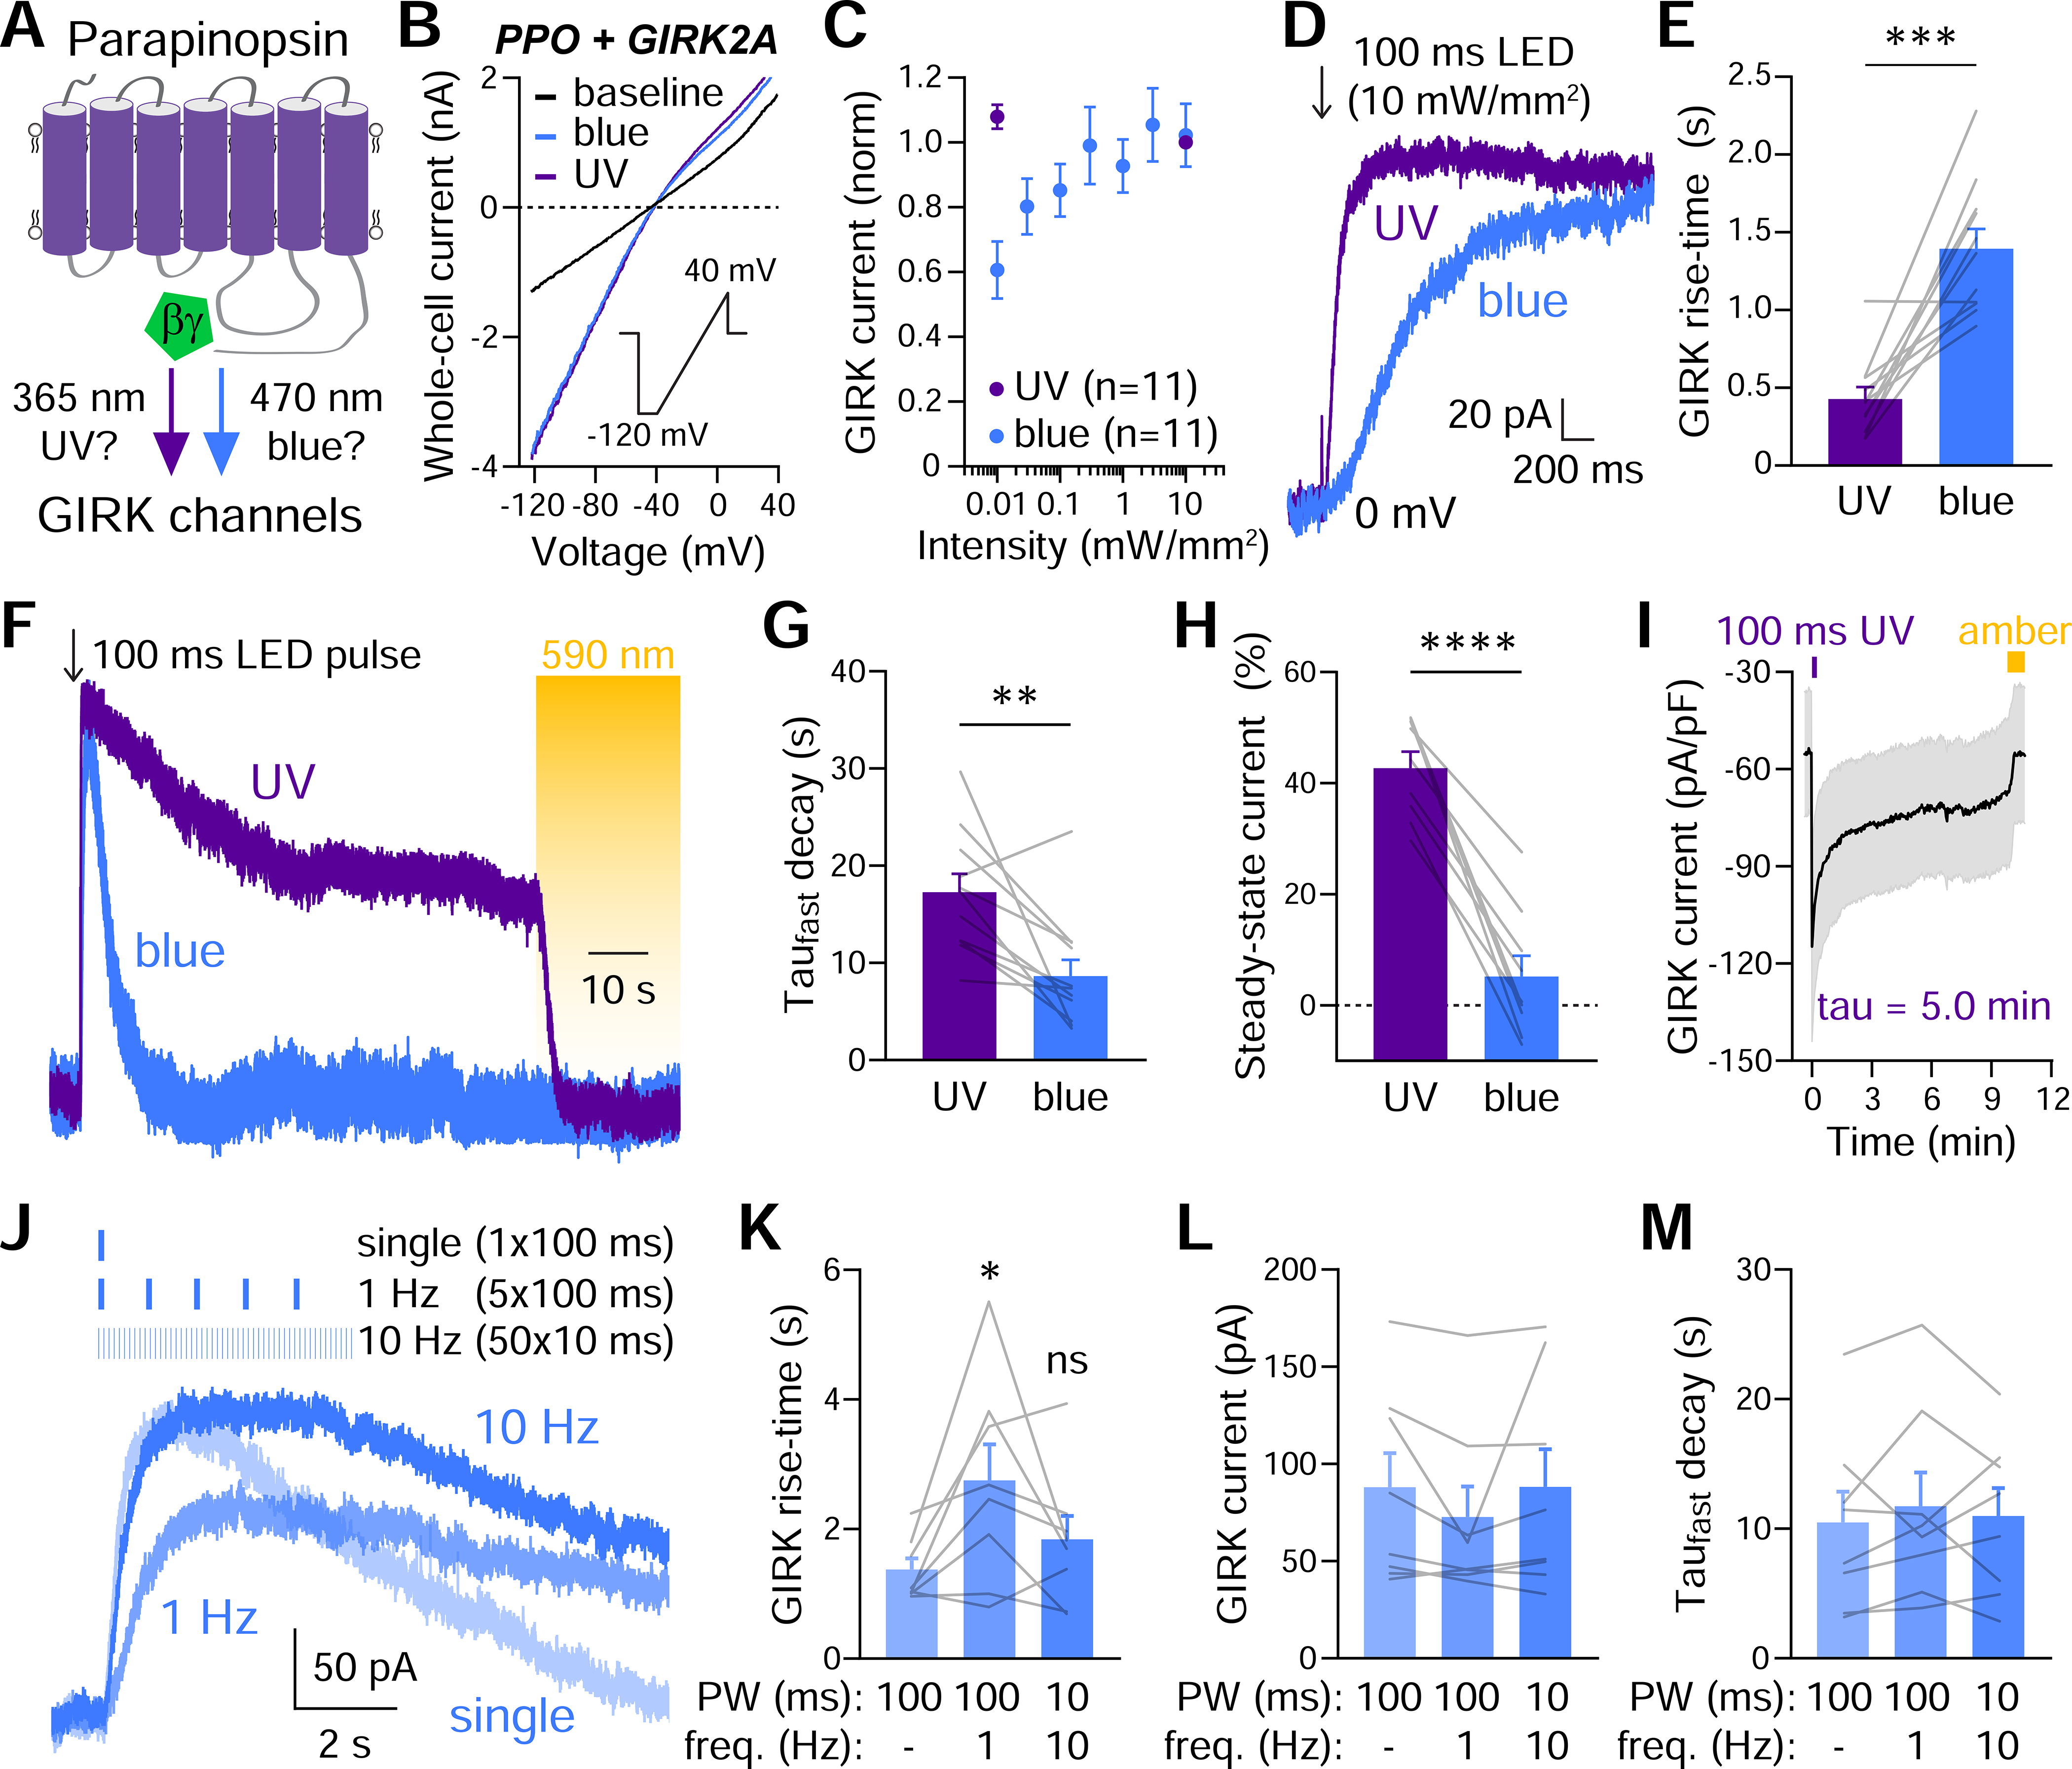
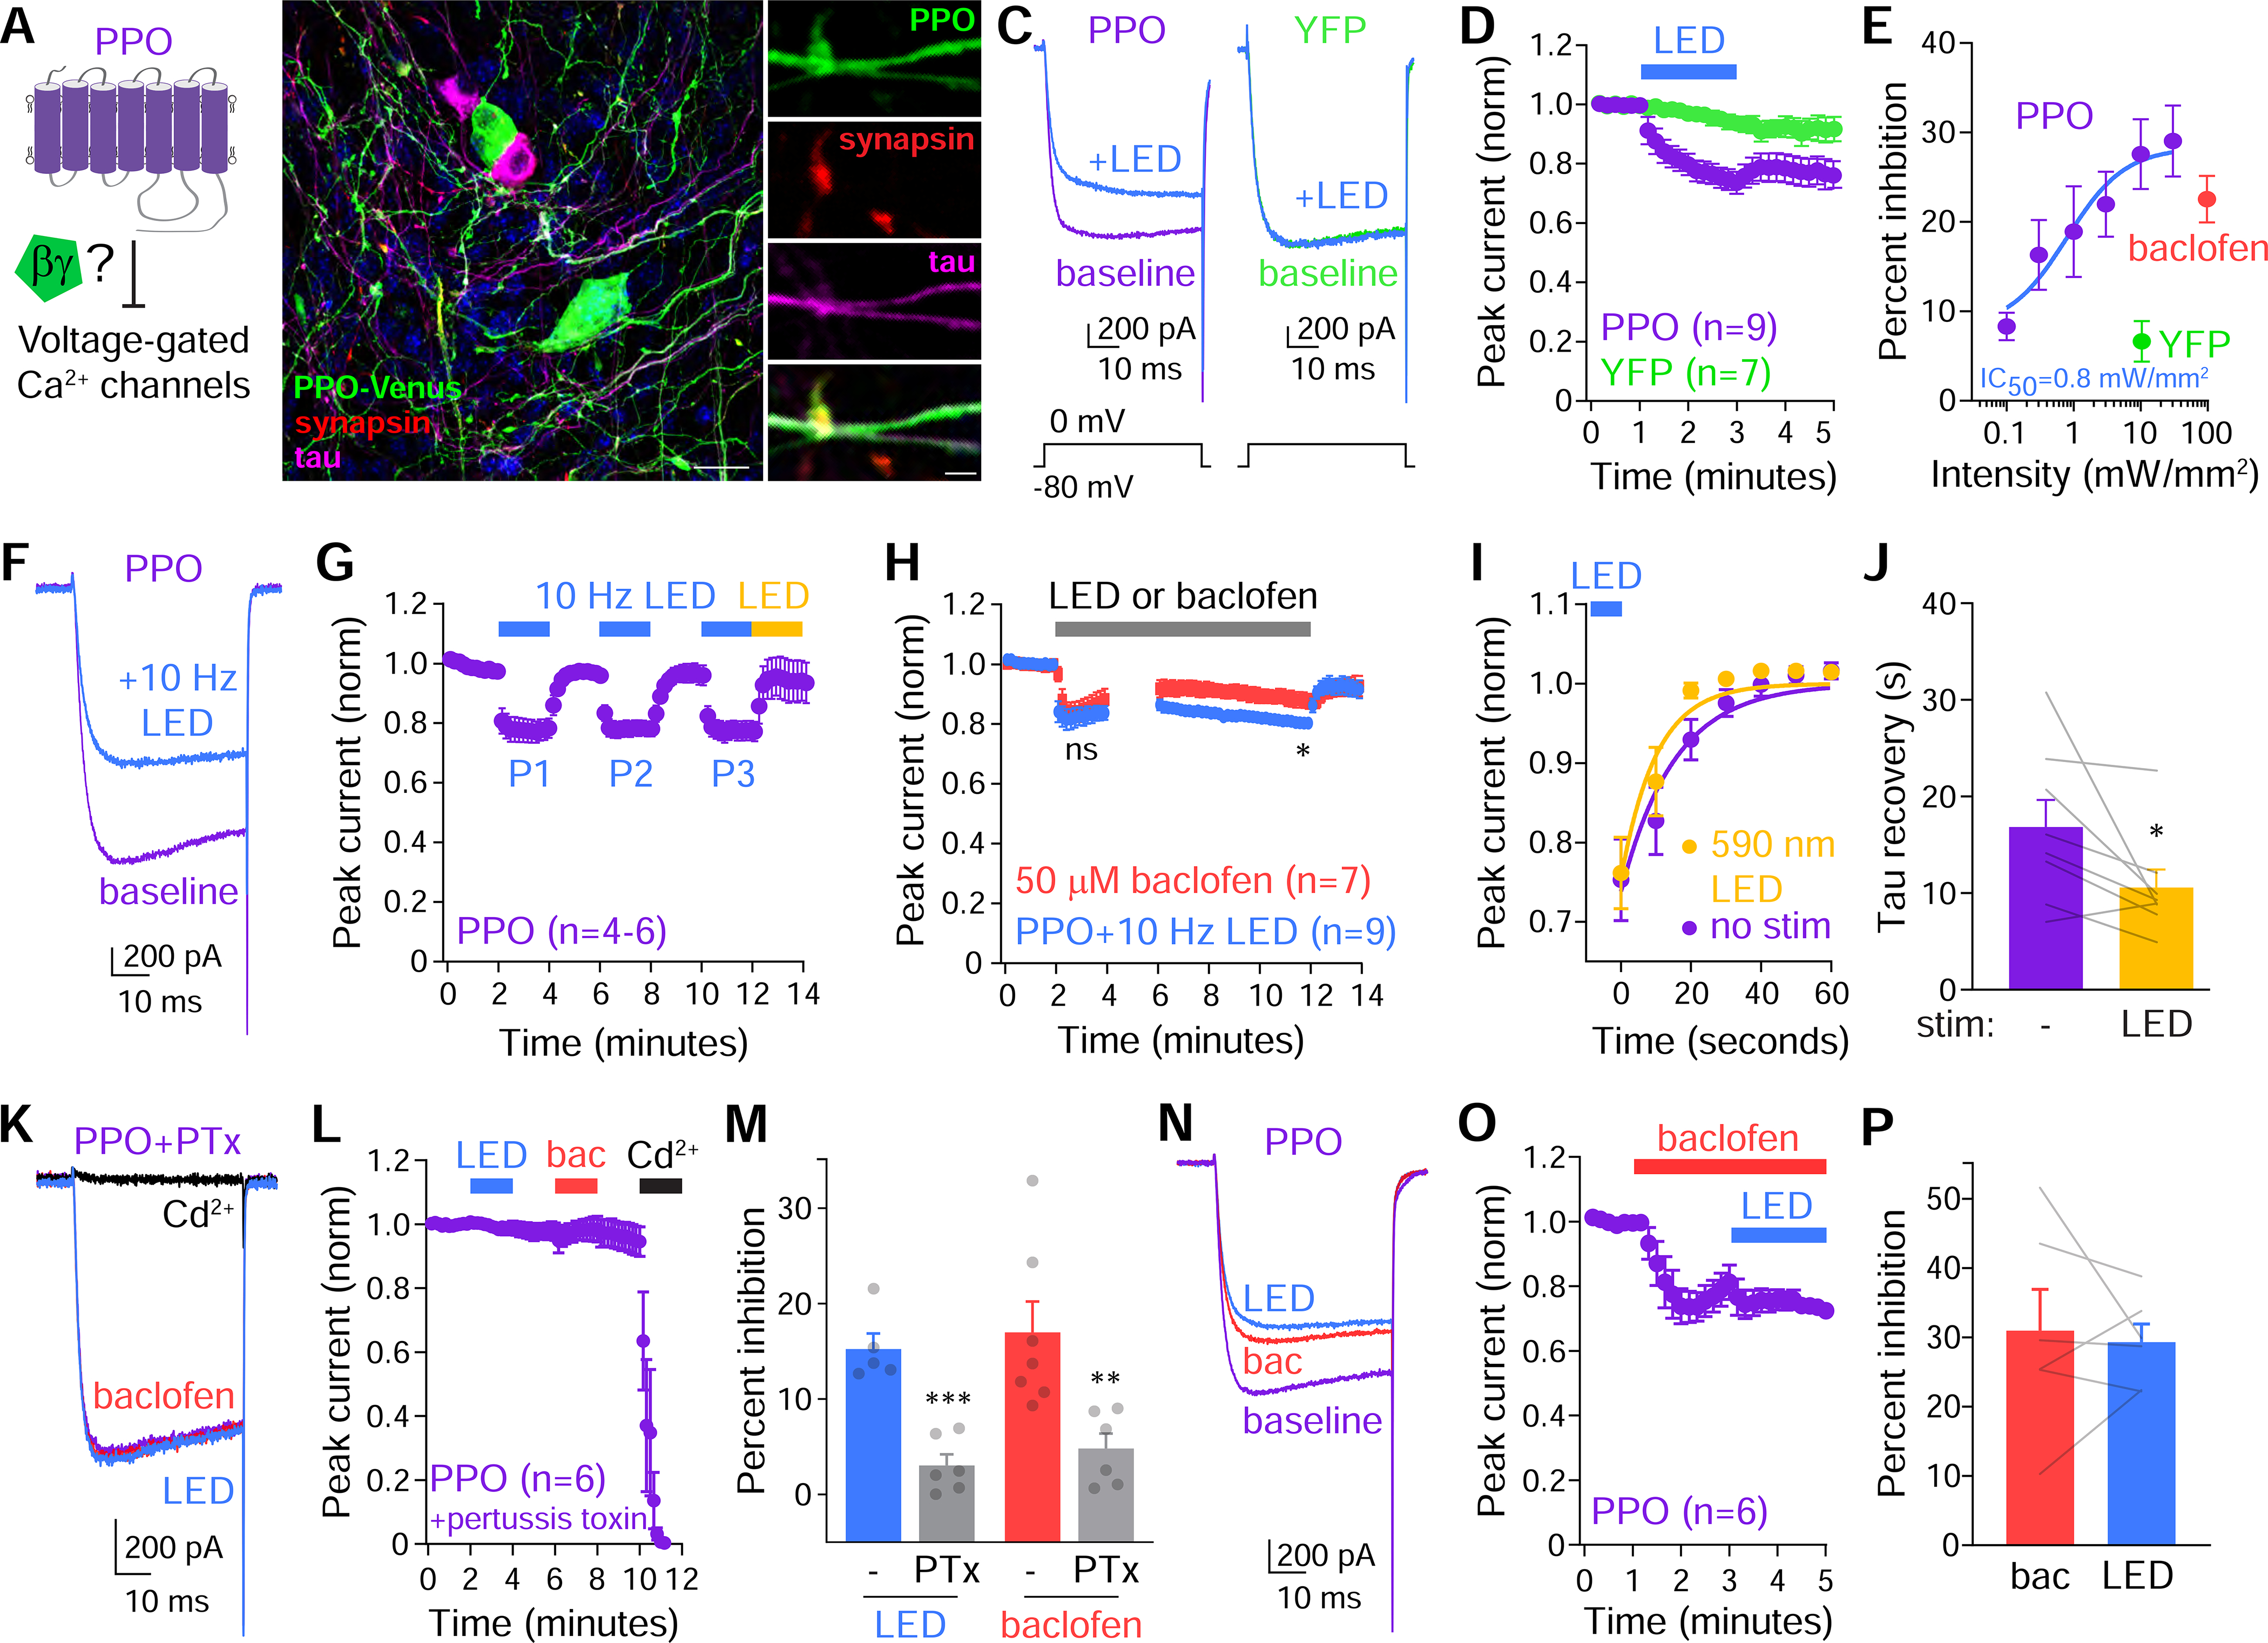
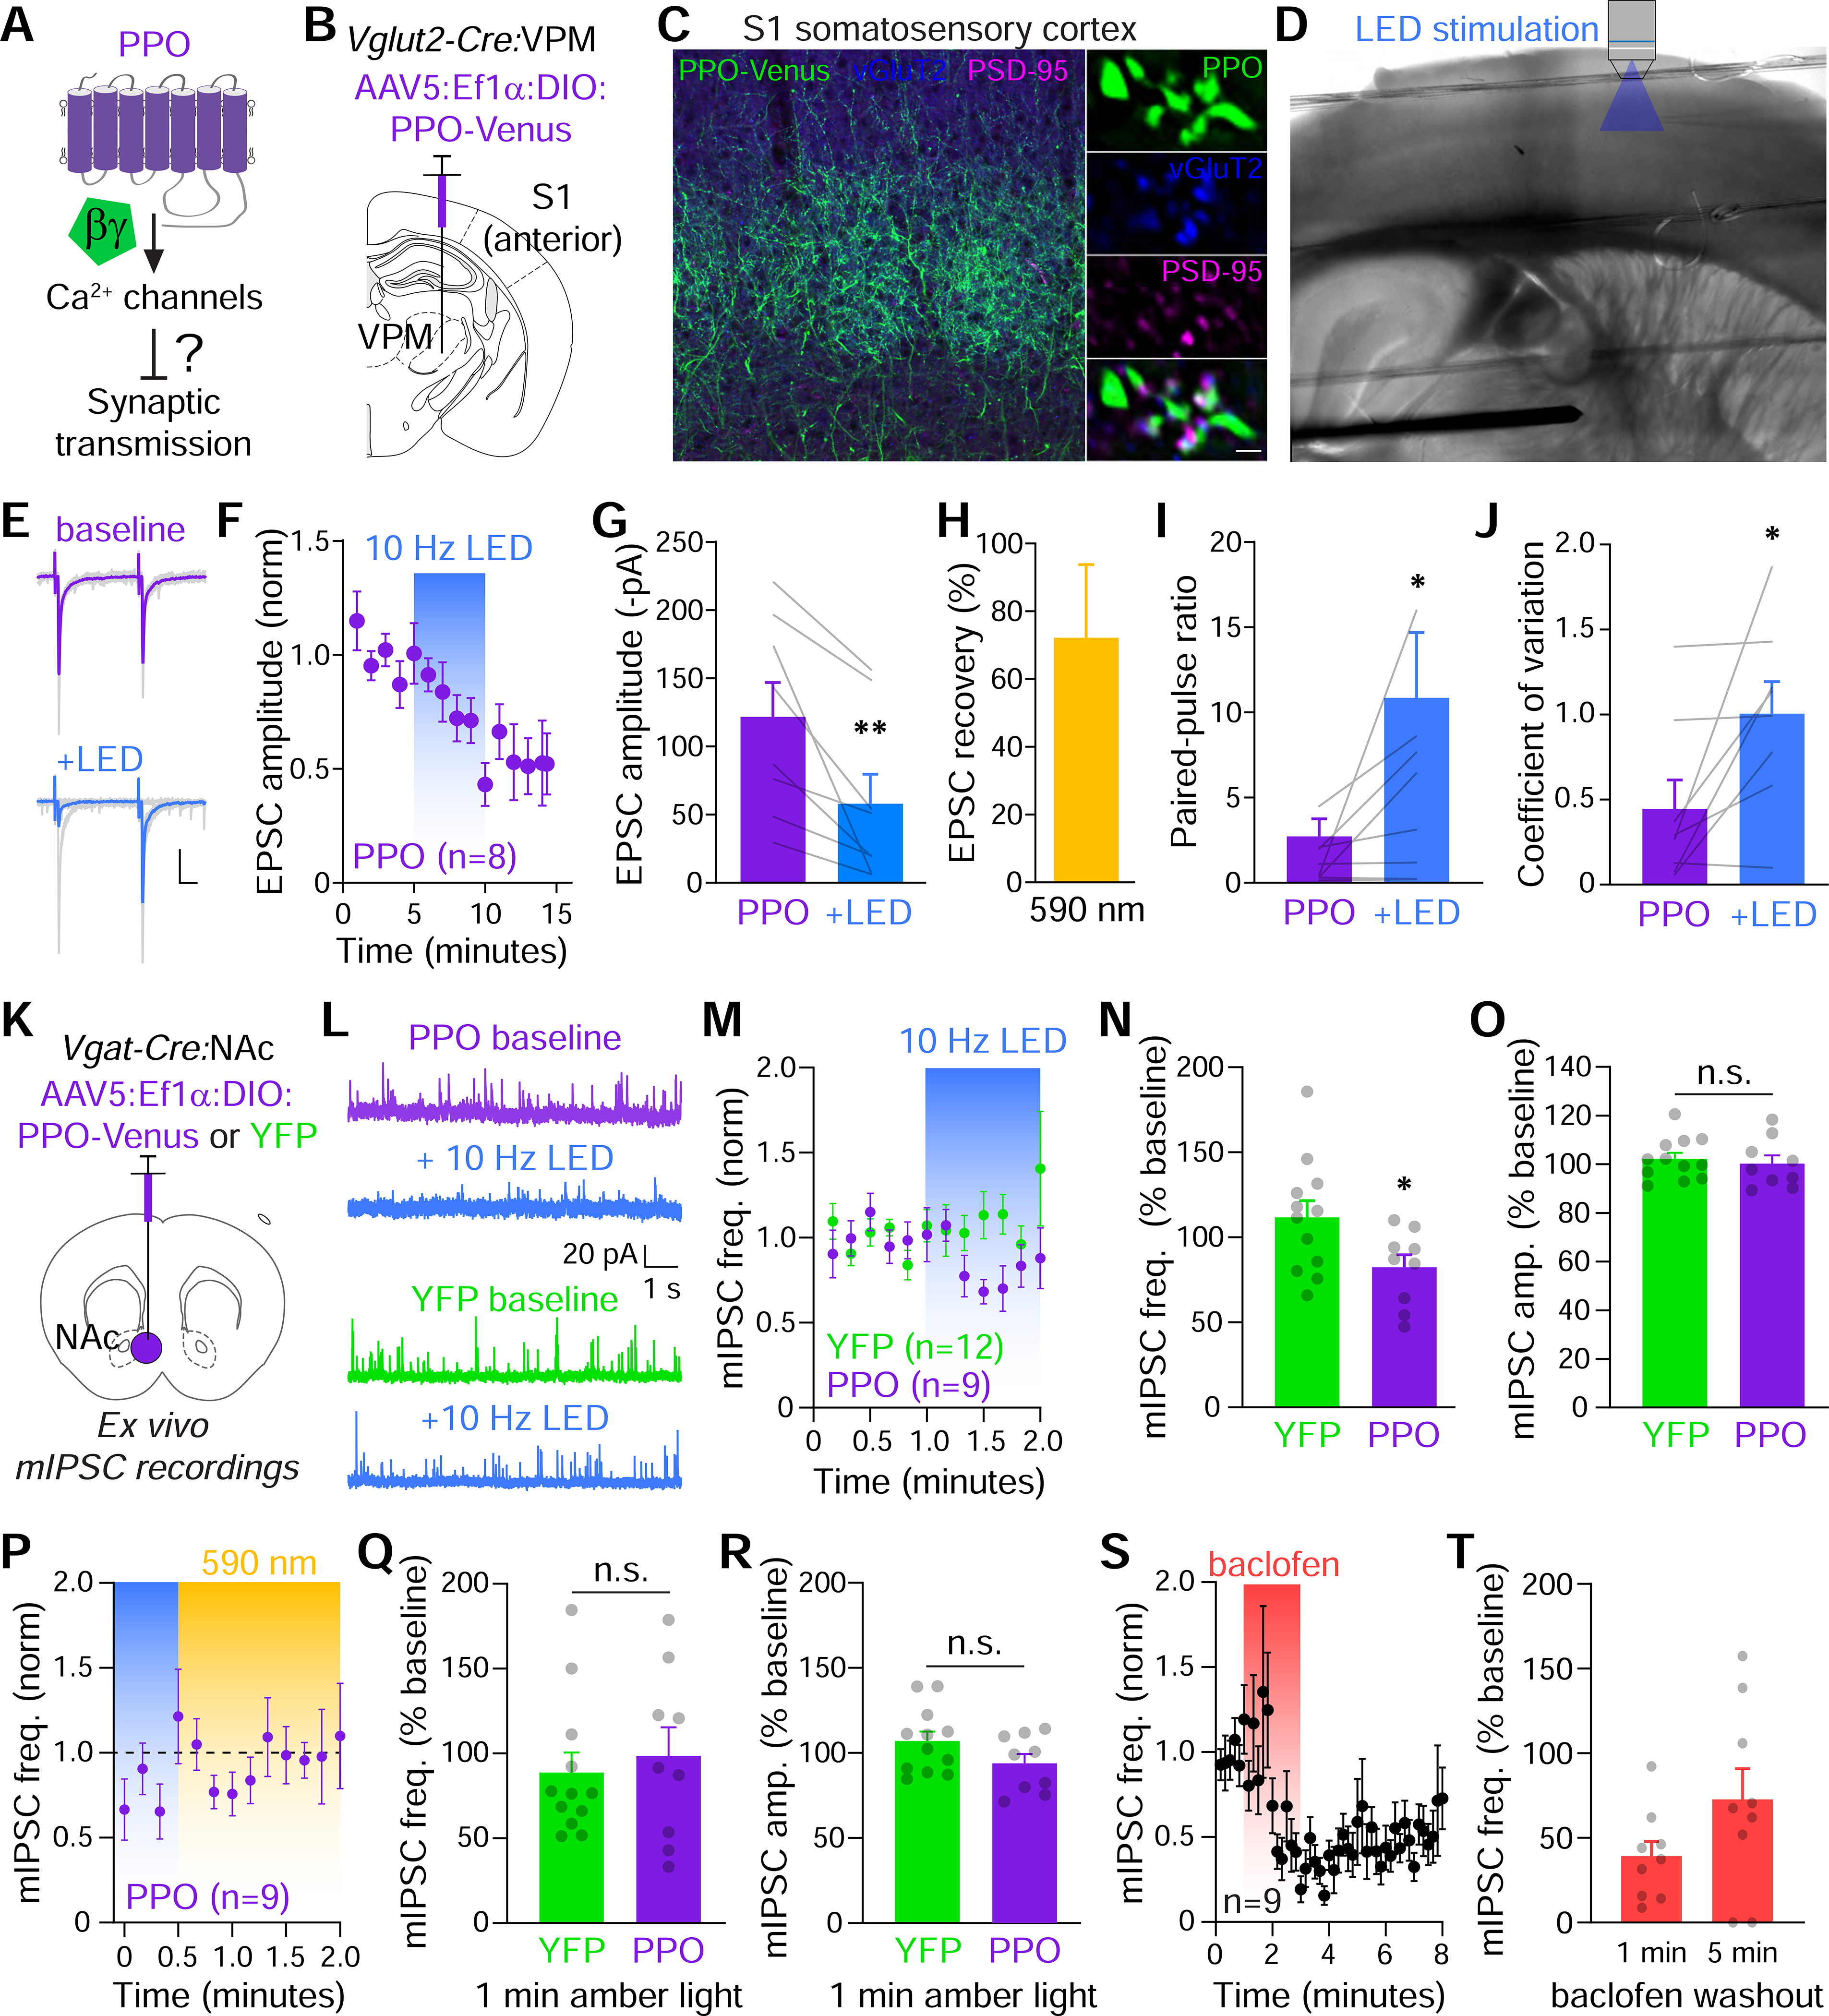
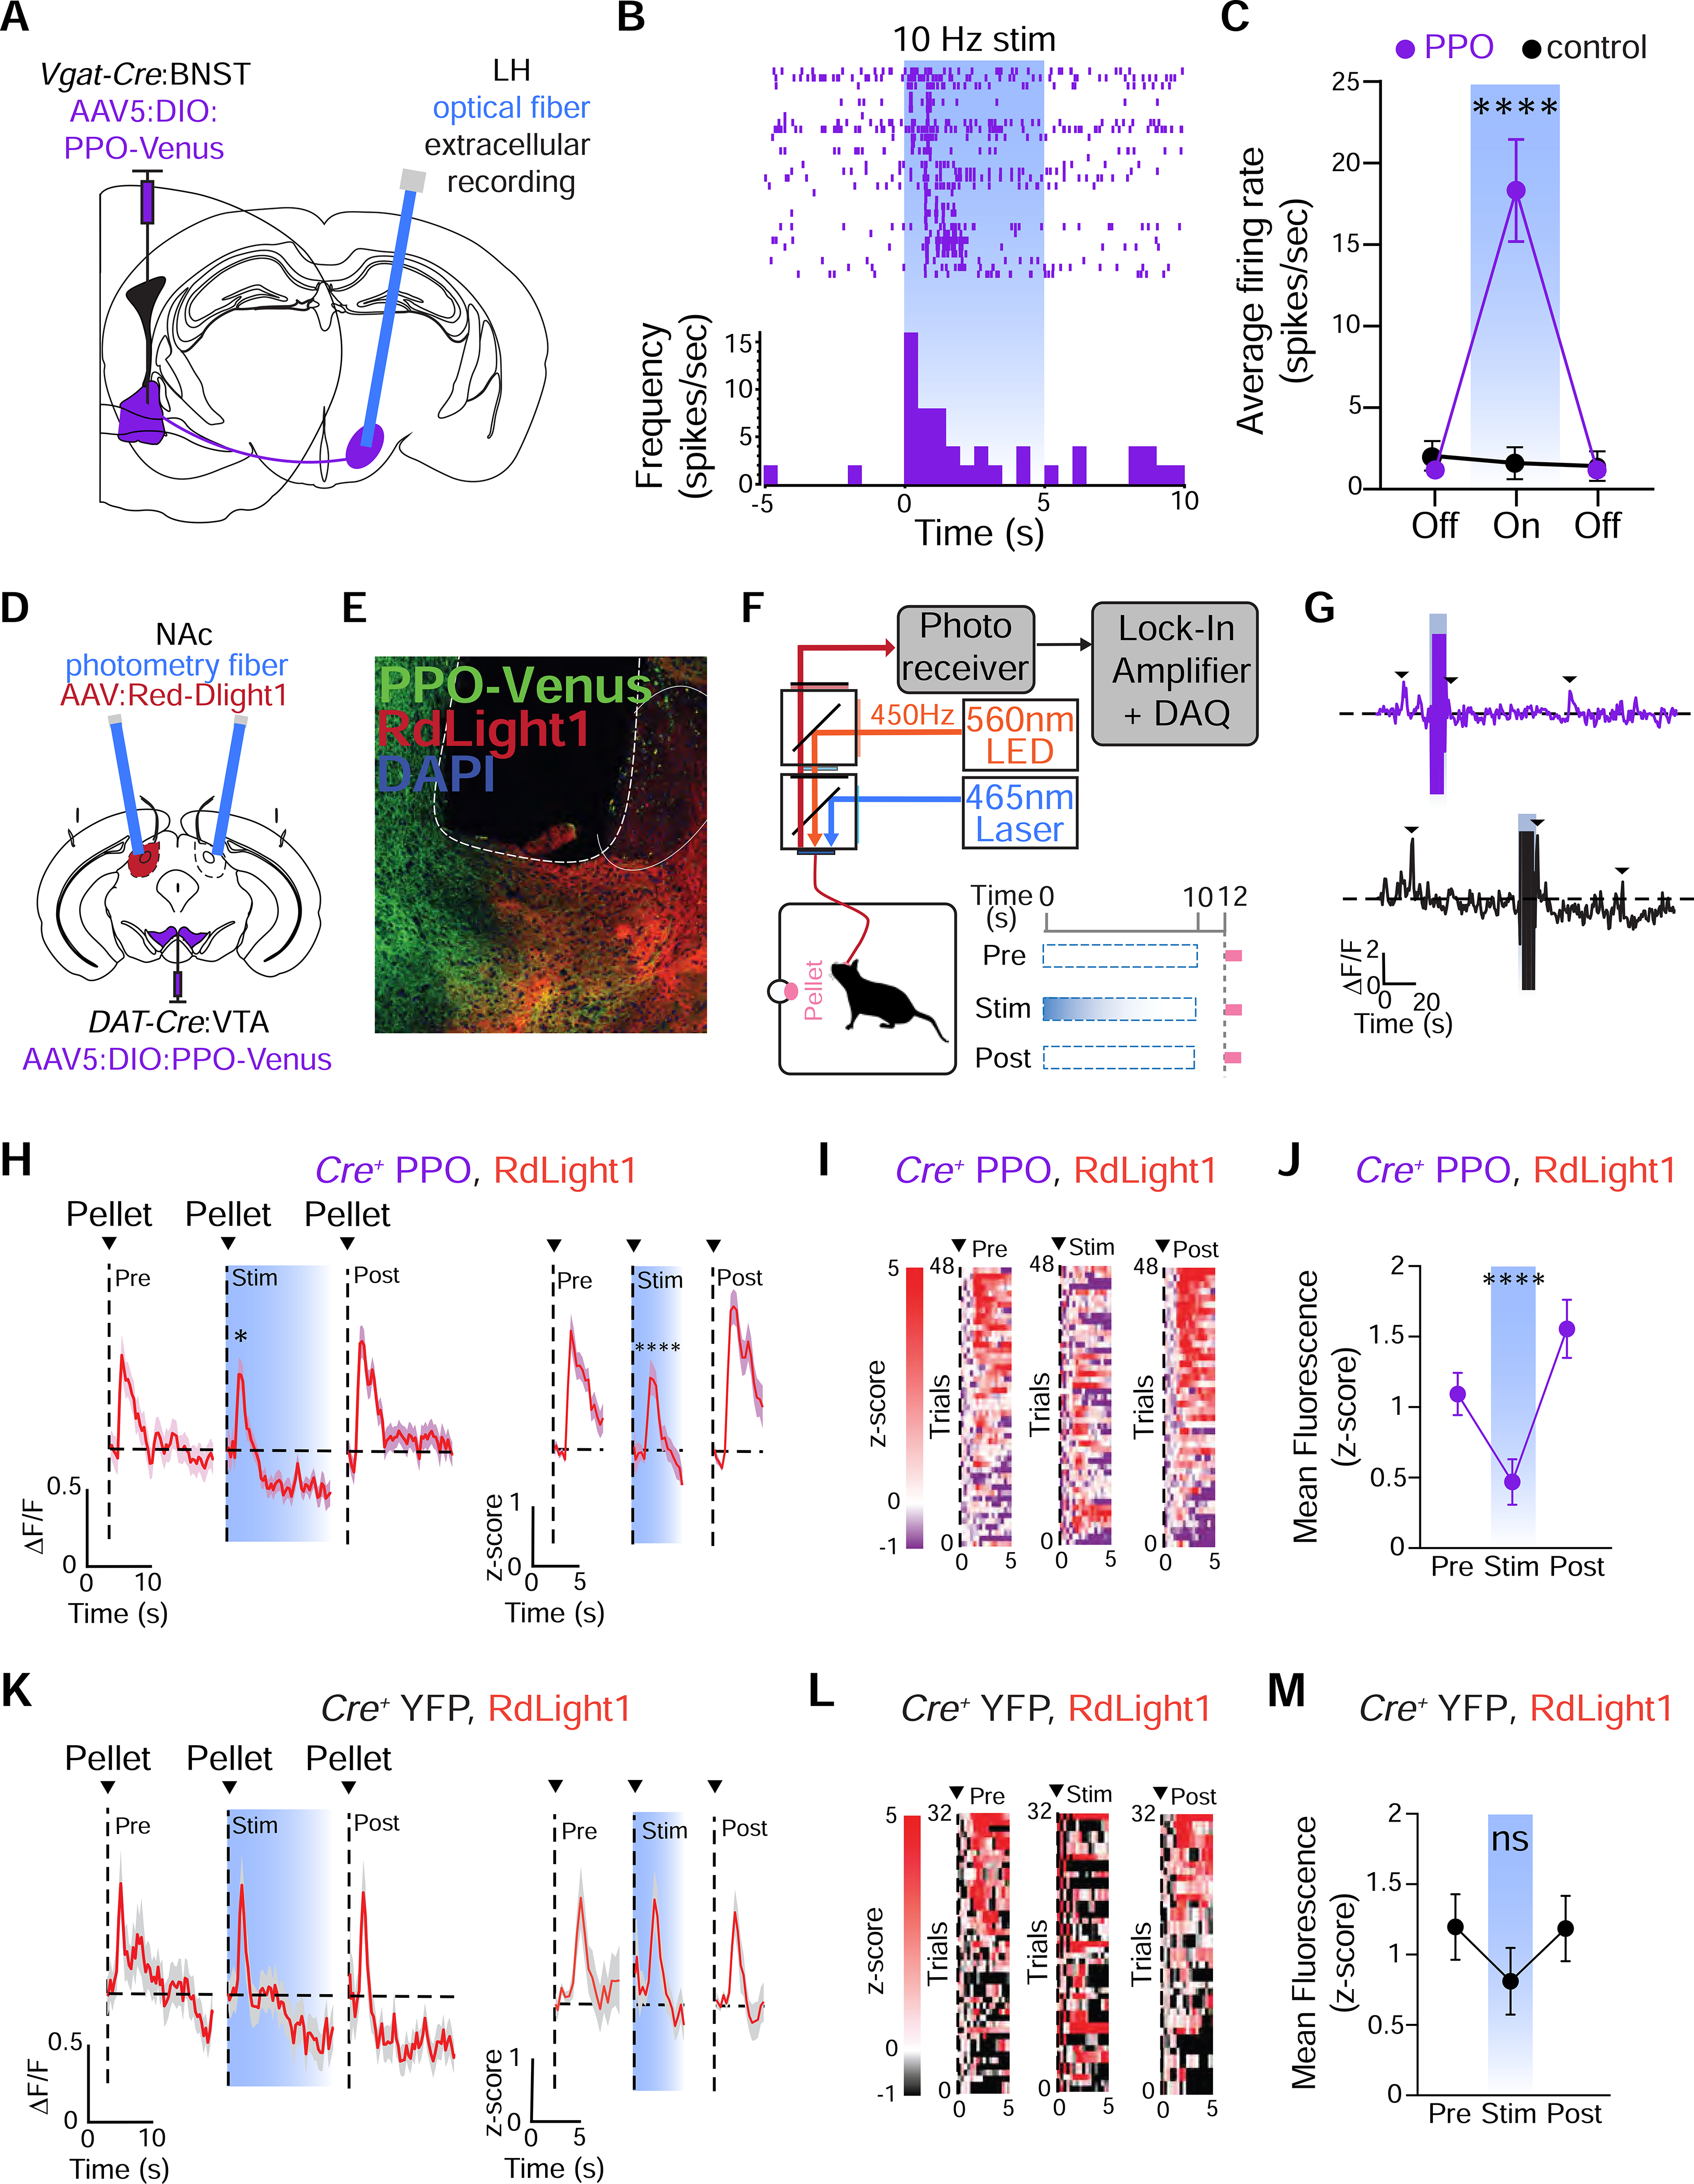
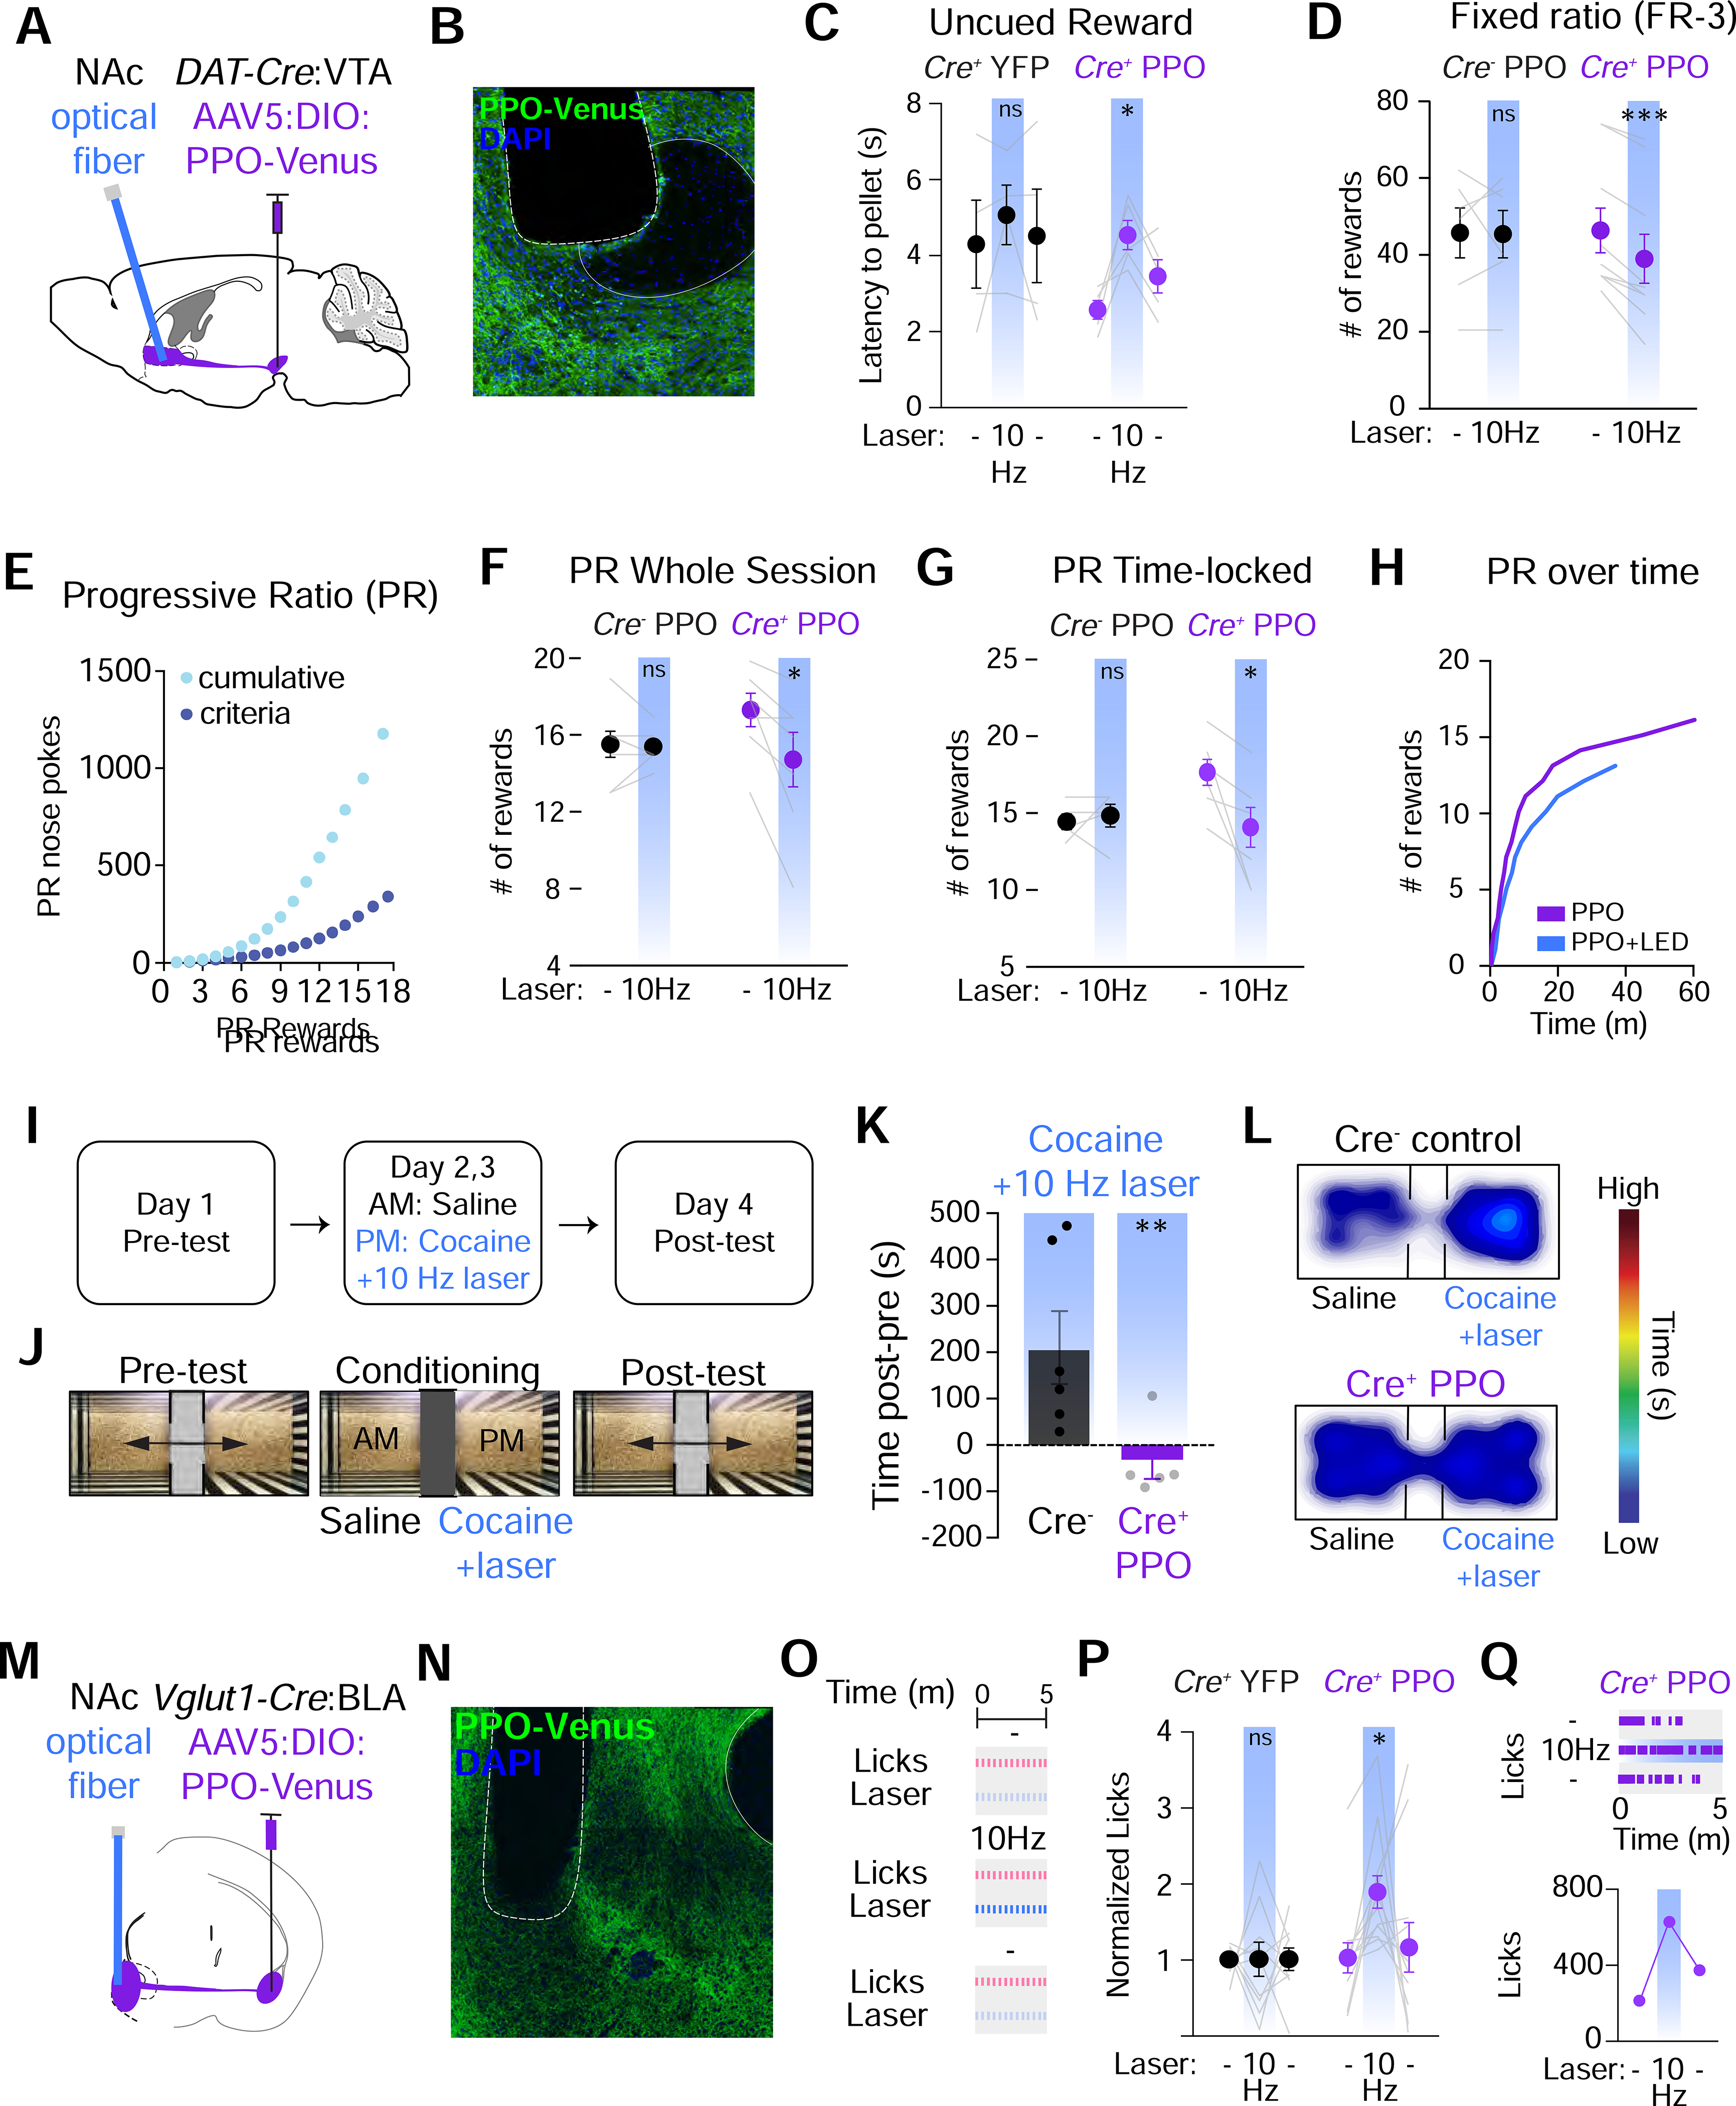
Optical manipulations of genetically defined cell types have generated significant insights into the dynamics of neural circuits. While optogenetic activation has been relatively straightforward, rapid and reversible synaptic inhibition has proven more elusive. Here, we leveraged the natural ability of inhibitory presynaptic GPCRs to suppress synaptic transmission and characterize parapinopsin (PPO) as a GPCR-based opsin for terminal inhibition. PPO is a photoswitchable opsin that couples to Gi/o signaling cascades and is rapidly activated by pulsed blue light, switched off with amber light, and effective for repeated, prolonged, and reversible inhibition. PPO rapidly and reversibly inhibits glutamate, GABA, and dopamine release at presynaptic terminals. Furthermore, PPO alters reward behaviors in a time-locked and reversible manner in vivo. These results demonstrate that PPO fills a significant gap in the neuroscience toolkit for rapid and reversible synaptic inhibition and has broad utility for spatiotemporal control of inhibitory GPCR signaling cascades.

Keywords: chemogenetics; inhibitory opsin; neuronal inhibition; optogenetics; synaptic inhibition.


Conflict of interest statement

Declaration of interests R.W.G and M.R.B. are cofounders of Neurolux Inc., a neuroscience technology company, but no related technology was used in this study. All other authors declare no competing interests.

Figures

Figure 1.
Figure 1.. Spectral characterization of a photoswitchable GPCR-based opsin.
(A) Cartoon of parapinopsin (PPO), a photoswitchable GPCR that is activated by UV light and turned off by amber light. (B) Absorption spectra of purified PPO protein in the dark off state (purple) and after UV light (amber). Graph is modified from (Koyanagi et al., 2004) (copyright 2004 National Academy of Sciences, USA) (C) Optical stimulation with blue LED light (465 nm, 15.6 mW/cm2) inhibits forskolin-induced cAMP luminescence in PPO-expressing HEK cells. n=5 (D) Live-cell images of Gβγ translocation assays. In the dark γ9-mCherry is localized to the plasma membrane (PM) (red arrows) but translocates after stimulation of PPO with UV (365 nm) or blue (470 nm) light. Scale=10 μm (E) Quantification of γ9-mCherry translocation following stimulation with UV vs. blue light. n=10, Paired t-test, ns=not significant, ***p<0.001, ****p<0.0001 (F) Translocation assays of PPO photoswitching. GFP-γ9 was imaged every 3s with a 488 nm laser (~45 μW), which also activated PPO and caused GFP-γ9 translocation from the PM (+laser). This was reversed by widefield illumination with an amber LED (590 nm, ~150 μW). Scale=10 μm. (G) Quantification of γ9-GFP translocation. n=4 cells (H) Individual photoactivation of cells expressing γ9-mCherry and untagged PPO. Boxes depict regions of blue LED photoactivation. Scale=10 μm (I) Traces of γ9-mCherry translocation from panel H. (J) Multiphoton activation of PPO using γ9-translocation assays. γ9-mScarlet was imaged with a Ti:Sapphire laser at 1080 nm, and multiphoton stimulation was delivered by a second laser at 700–1000 nm. n=7
Figure 2.
Figure 2.. UV and blue light cause differential coupling of PPO to GIRK channels.
(A) Cartoon depicting UV and/or blue light coupling PPO to GIRK channels. (B) GIRK current to voltage ramps in HEK cells transfected with PPO-Venus and GIRK2A. Baseline trace (black) and after photoactivation with 365 nm UV (purple) and 470 blue light (both 10 mW/mm2). Inset depicts the voltage protocol. (C) GIRK dose-response curves with UV and blue light. Data are normalized to 10 mW/mm2 UV light. (D) Outward GIRK currents recorded at 0 mV. Currents were activated more rapidly by UV (purple) than blue light (both 10 mWmm2) (E) Summary graph of 10–90% GIRK rise-times with UV and blue light. n=11, paired t-test, ***p<0.001 (F) Prolonged GIRK channel activation by UV but not blue light (both 100 ms, 10 mW/mm2). Constant amber light (590 nm, 1 mW/mm2) was used to deactivate PPO 75 seconds after photoactivation. (G) Summary graph of the fast decay after photoactivation with UV or blue light. n=11, paired t-test, **p<0.001 (H) Summary graph of the steady-state current sensitive to amber light. n=11, paired t-test, ****p< 0.0001 (I) GIRK currents after a single 100 ms UV pulse. GIRK activation had a decay constant of 5.0 min, remained activated for >10 minutes, and could be switched off with amber light. (J) GIRK current traces in response to blue light pulses at 1 or 10 Hz. The number of pulses and pulse widths are indicated. (K) Summary graph of 10–90% GIRK current rise-times with pulsed blue light. n=8, 1-way ANOVA, ns=not statistically significant, *p<0.05 (L) Summary graph of GIRK amplitudes to pulsed blue light. n=8 (M) Summary graph of the fast decay tau to pulsed blue light. n=8
Figure 3.
Figure 3.. PPO inhibits somatodendritic excitability to suppresses reward behaviors.
(A) Schematic of PPO coupling to GIRK channels to inhibit neuronal activity. (B) Experimental strategy for expressing Cre-dependent PPO-Venus (AAV5:Ef1α:DIO:PPO-Venus) in DAT-Cre+ dopamine neurons in the ventral tegmental area (VTA). (C) Horizontal slice depicting the VTA (purple shaded region). Overlayed IR-DIC and fluorescence images of PPO-Venus in acute horizontal slices. Patch pipette is in dashed lines. Scale=100 μm (D) 40x IR-DIC images (top) and PPO-Venus (bottom) in cell bodies of the VTA. Scale=10 μm (E) Plot of normalized holding currents in response to blue LED stimulation (10 Hz, 10 ms, 10 mW/mm2) n=6 (F) Voltage traces from PPO-expressing VTA DA neurons in response to step current injections. Neurons were held at −60 mV. (G) Same neuron in (F) during photostimulation with 10 Hz blue LED light. (H) Inhibition was reversed by bath application of the GIRK channel blocker Ba2+ (1 mM) (I-J) Summary graph of the change in rheobase (I) and input resistance (J) in response to 10 Hz LED stimulation and Ba2+. n=6, Paired t-tests of baseline to LED stimulation, p<0.05 (K) Plot of AP frequency to depolarizing current injections before (purple), during 10 Hz LED (blue) and after bath application of Ba2+ (red). (L) Summary graph of input-output gain (AP# divided by the cumulative current injected). n=6, paired t-test p<0.05 (M) Current elicited by a voltage ramp from −40 to −140 mV at baseline (purple), during 10 Hz LED (blue) and after Ba2+ (red). (N) Experimental strategy for expressing Cre-dependent PPO-Venus in DAT-Cre+ DA neurons in the VTA. Optical fibers were implanted bilaterally above the VTA to stimulate cell bodies. (O) Confocal micrograph of PPO-Venus expression in VTA DA neurons. Scale=400 μm. (P) Experimental timeline for operant task training for sucrose rewards. Mice were trained on fixed ratio (FR)-1 and FR-3 schedules. (Q) Cartoon of an operant chamber. Mice nose poke into an active port in response to a light cue to receive a sucrose reward. (R) Experimental design of the operant task where a sucrose reward is given for nose pokes in the active port after the light cue. No reward is given for pokes in the inactive port. FR-1 requires 1 nose poke for reward while FR-3 requires 3 nose pokes. (S) Summary graphs of operant behaviors. 10 Hz pulsed laser light (473 nm, 10 ms, 5–8 mW) decreased both the number of nose pokes (left) and rewards (right). n=9 mice each, paired t-test **p<0.01
Figure 4.
Figure 4.. PPO inhibits neuronal calcium channel currents.
(A) Cartoon of PPO coupling to voltage-gated Ca2+ channels. (B) Confocal micrograph of cultured DRG neurons from AvilCre mice 7 days after transduction with Cre-dependent AAV5 (CAG:DIO:PPO-Venus). PPO-Venus (green) was present at cell bodies, tau+ axons (magenta), and synapsin-1+ axonal boutons (red). Scale=20 μm (left) and 5 μm (right). (C) Ca2+ channel current traces elicited by voltage steps from −80 to 0 mV in DRG neurons. LED illumination (470 nm, 10 mW/mm2) inhibited currents in PPO-expressing neurons (purple) but not YFP+ controls (green). (D) Quantification of normalized VGCC currents in PPO+ (purple) vs. YFP control (green) neurons. Blue bar indicates stimulation with constant blue LED light (10 mW/mm2). (E) Dose-response curve of VGCC inhibition by blue light stimulation of PPO+ neurons (purple) or YFP+ controls (green). The GABABR agonist baclofen (50 μM, coral) was used to compare efficacy of PPO. n=6–11 for PPO, n=7 for YFP controls, n=20 for baclofen. (F) Ca2+ channel trace of PPO expressing neuron before (purple) and after (blue) stimulation with pulsed blue light (10 Hz, 10 ms, 10 mW/mm2). (G) Time course of peak current inhibition to repeated LED pulses (blue bars) and enhanced recovery in amber light (yellow, 590 nm LED). n=4–6 neurons (H) Plot of normalized VGCC currents in response to prolonged stimulation of PPO with 10 Hz LED light (blue) or 50 μM baclofen (coral). During minutes 4–6, we ran pre-pulse protocols (Figure S4). t-test, *p<0.05, ns=not significant (I) Normalized recovery time-course of VGCC currents with amber LED (590 nm) or in the dark (no stim, purple). The blue bar depicts LED for inhibition. n=8 cells. (J) Summary graph of the recovery tau with (amber) and without (purple) subsequent illumination with a 590 nm LED. Paired t-test, *p<0.05 (K) Ca2+ channel trace of PPO expressing neuron treated with 200 ng/ml pertussis toxin (PTx, purple) and responses to 10 Hz blue light (blue), 50 μM baclofen (coral) and 100 μm Cd2+ to block Ca2+ channels (black). (L) Time course of normalized peak VGCC currents in PPO-expressing neurons treated with PTx (purple) in response to 10 Hz LED stimulation (blue), 50 μm baclofen (coral), and 100 μm Cd2+ (black). (M) Summary graph of VGCC inhibition in neurons treated with PTx. Blue (LED) and coral (baclofen) bars represent untreated controls. Gray bars represent PTx-treated PPO+ neurons stimulated with blue LED (left) or baclofen (right). n=5–7, t-test **p<0.01, ***p<0.001 (N) Ca2+ channel trace of PPO expressing neuron (purple) stimulated with 50 μM baclofen (coral) followed by 10 Hz LED stimulation (blue). (O) Time course of normalized peak VGCC currents in PPO-expressing neurons (purple) stimulated by 50 μM baclofen (coral) and 10 Hz LED pulses (blue). n=6 (P) Summary graph of the percent inhibition of VGCC currents by baclofen and subsequent LED stimulation. n=6, paired t-test, not significant
Figure 5.
Figure 5.. PPO inhibits presynaptic release at glutamatergic and GABAergic terminals.
(A) Experimental question asking if PPO can inhibit synaptic transmission at axon terminals. (B) Cartoon depicting the injection site of Cre-dependent AAV5 (Ef1α:DIO:PPO-Venus) into the ventral posterior medial nucleus (VPM) of thalamus in Vglut2-Cre mice to target excitatory projections to primary somatosensory cortex (S1). (C) Confocal micrograph of S1 from a Vglut2-Cre mouse expressing PPO-Venus in the VPM. PPO-Venus+ axons (green) densely innervated layer IV of the barrel cortex. Scale=100 μm. PPO (green) colocalized at presynaptic vGluT2+ terminals (blue) opposed to postsynaptic sites marked by PSD-95 (magenta). Scale=1 μm. (D) IR-DIC images of an acute thalamocortical slice depicting the stimulating electrode in VPM and the patch pipette and objective for optical stimulation of terminals in S1. (E) Representative EPSCs (gray) and averaged responses during baseline (purple) and 10 Hz LED stimulation (blue). Paired pulses were delivered at 50 ms intervals. (F) Plot of normalized EPSC amplitudes which were inhibited by pulsed blue LED light (blue bar). Tau of inhibition was 2.6 minutes. (G) Summary graph of EPSC amplitudes before and after 10 Hz photostimulation. n=8, paired t-test **p<0.01 (H) Summary graph of the reversal of inhibition after 30s of constant amber light, n=6 cells. (I-J) Summary graph of EPSC paired pulse ratios (I), and coefficients of variation (J) before (purple) and after LED stimulation (blue). n=8, paired t-tests, *p<0.05 (K) Cartoon of the strategy to express Cre-dependent PPO-Venus or YFP in the NAc of Vgat-Cre mice. Acute slices were then used to record mIPSCs. (L) Representative mIPSC traces recorded at 0 mV from non-fluorescent neurons in PPO or YFP-injected mice. (M) Plot of normalized mISPC frequencies which were rapidly inhibited by the pulsed LED (blue bar) in PPO (n=9) but not YFP controls (n=12). (N) Summary graph of the effect of 10 Hz LED on mIPSC frequencies (normalized to baseline) in YFP (n=12) and PPO (n=9) slices. t-test, *p<0.05 (O) Summary graph of normalized rmIPSC amplitudes in YFP (n=12) and PPO (n=9) slices. n.s. not significant (P) Plot of normalized mIPSC frequency recovery in constant amber light (590 nm, 1 mW/mm2). n=9 slices. (Q) Summary graph of mIPSC frequency recovery after 1 min. of amber light in YFP (n=12) and PPO (n=9) slices. n.s. not significant (R) Summary graph of mIPSC amplitudes after 1 min. of amber light in YFP (n=12) and PPO (n=9) slices. n.s. not significant (S) Plot of normalized mIPSC frequencies in response to 50 μM baclofen for 2 min. (coral bar) in slices from YFP-injected mice (n=9). (T) Summary graph of mIPSC frequency recovery 1 and 5 min. after washout of baclofen, n=9 slices.
Figure 6.
Figure 6.. PPO inhibits synaptic transmission at terminals in vivo.
(A) Schematic illustrating single-unit recordings of lateral habenula (LH) neurons modulated by PPO-expressing BNST-LH terminals (B) Raster plot from recorded LH units (top) and the peri-event histogram from a representative unit (bottom) during 5 sec of 10 Hz photoinhibition of BNST-GABA terminals expressing PPO. (C) Average firing rate of LH units from PPO (purple) or control (black) groups; Mixed-effects 1-way ANOVA, ****p<0.0001, n=30 units from 6 mice. Firing rate in controls was unchanged; Mixed-effects 1-way ANOVA, p>0.05, n=19 units from 3 mice. (D) Cartoon depicting injection of Cre-dependent AAV5 (Ef1α:DIO:PPO-Venus) into the VTA of DAT-Cre mice, injection of RdLight1 (AAVDJ:CAG:RdLight1) into the NAc core and fiber implants. (E) Confocal micrograph depicting PPO-Venus (green), RdLight1 (red) and DAPI (blue) expression in the NAc core. The placement of the optical fiber is outlined. Scale=100 μm. (F) Schematic of fiber photometry set-up and behavioral design. (G) Representative ΔF/F traces for PPO (top) and YFP controls (bottom) showing RdLight1 activity during reward delivery (black arrows) and stimulation artifact (blue bar). (H) RdLight1 (ΔF/F, left or z-score, right) from PPO mice during reward delivery averaged across all trials in pre (left), stim (middle) or post (right) trials. n=6 mice. (I) Heatmap raster plot of RdLight1 fluorescence (z-score) from PPO mice during reward delivery averaged across all trials in pre (left), stim (middle) or post (right) (n=6 mice). Trials are in ascending order of activity following reward. (J) Mean fluorescence following reward delivery (1–5s). n=6 mice; Mixed-effects one-way ANOVA, ****p<0.0001. Mult. comparisons: pre vs. stim, **p<0.01 and post vs. stim, ****p<0.0001 (K) RdLight1 (ΔF/F, left or z-score, right) from YFP mice during reward delivery averaged across all trials in pre (left), stim (middle) or post (right). n=5 mice (L) Heatmap raster plot of RdLight1 fluorescence (z-score) from YFP controls during reward delivery averaged across all trials in pre (left), stim (middle) or post (right) (n=5 mice). Trials are in ascending order of activity following reward. (M) Mean fluorescence following reward delivery (1–5s). n = 5 mice; Pre vs. Stim vs. Post, Mixed-effects one-way ANOVA, p>0.05, Mult. comparisons all not significant
Figure 7.
Figure 7.. PPO inhibits dopamine neuron terminals to suppress reward seeking behaviors.
(A) Cartoon of the strategy to inhibit DA neuron projections to the NAc. Cre-dependent AAVs were injected into the VTA of DAT-Cre mice and optical fibers were placed above their terminals in the NAc core. (B) Confocal micrograph of PPO-Venus in DA neuron terminals of the NAc. The placement of the optical fiber is shown. Scale=100 μm (C) Summary graphs of uncued reward delivery task. Terminal illumination (blue bars) increased the latency to retrieve pellets in PPO mice (right, n=5), but not YFP controls (left, n=4). Mixed-effects 1-way ANOVA, *p<0.05. Mult. comparisons: (−) vs. 10 Hz, *p<0.05 (D) Summary graphs of FR-3 testing. Terminal illumination (blue bars) decreased the # of rewards that mice received in Cre+ mice (right, n=9), but not Cre controls (left, n=6). Paired t-test ***p<0.001 (E) Example graph of the escalating nose pokes to receive a reward in progressive ratio (PR) testing. (F) Summary graph of PR testing. Terminal illumination (blue bars) decreased the # of rewards received in Cre+ mice (right, n=7), but not Cre mice (left, n=8). Paired t-test *p<0.05. (G) Summary graph of nose poke-triggered, time-locked PR testing. Terminal illumination (blue bars) decreased the # of rewards received in Cre+ mice (right, n=5), but not Crecontrols (left, n=6). Paired t-test *p<0.05. (H) Representative trace of rewards earned in a PR session over time +/− blue light stimulation. (I-J) Experimental timeline and set-up for testing cocaine preference behaviors. During pre-testing mice could freely explore the 2 chambers. During pairing, mice were given saline in 1 chamber and cocaine (10 mg/kg) + 10 Hz blue light in the other. After 2 days of pairing, preference for either chamber was determined. (K) Summary graph of difference in time spent in the cocaine-paired chamber. Cre control mice (n=6) exhibit strong preference for the cocaine-paired chamber which was completely blocked by photoinhibition in PPO-expressing mice (n=5). Both groups received optical stimulation during cocaine-pairing. t-test **p<0.01 (L) Heat maps of relative time spent in each chamber. (M) Cartoon depicting glutamatergic neuron projections to the NAc. Cre-dependent AAVs were injected into the BLA of Vglut1-Cre mice and optical fibers were placed above terminals in the NAc shell. (N) Confocal micrograph of PPO-Venus expression in BLA neuron terminals of the NAc. The placement of the optical fiber is shown. Scale=100 μm (O) Schematic depicting sucrose licking task and experimental design. (P) Normalized sipper licks. n=12 Cre+ and n=10 Cre mice. For Cre+: Mixed-effects 1-way ANOVA, *p<0.05. Mult. comparisons: (−) vs. 10Hz, *p<0.05 and 10Hz vs. (−), *p<0.05. All other comparisons ns (Q) Top: Representative lick raster plots for (−) vs. 10Hz vs. (−) conditions. Bottom: Raw licks for a single animal

Comment in

References

    1. Agmon A, and Connors BW (1991). Thalamocortical responses of mouse somatosensory (barrel) cortex in vitro. Neuroscience 41, 365–379. - PubMed
    1. Airan RD, Thompson KR, Fenno LE, Bernstein H, and Deisseroth K (2009). Temporally precise in vivo control of intracellular signalling. Nature 458, 1025–1029. - PubMed
    1. Al-Hasani R, McCall JG, Shin G, Gomez AM, Schmitz GP, Bernardi JM, Pyo C-O, Park S Il, Marcinkiewcz CM, Crowley NA, et al. (2015). Distinct subpopulations of nucleus accumbens dynorphin neurons drive aversion and reward. Neuron 87, 1063–1077. - PMC - PubMed
    1. Atasoy D, and Sternson SM (2018). Chemogenetic tools for causal cellular and neuronal biology. Physiol. Rev 98, 391–418. - PMC - PubMed
    1. Azpiazu I, Akgoz M, Kalyanaraman V, and Gautam N (2006). G protein βγ11 complex translocation is induced by Gi, Gq and Gs coupling receptors and is regulated by the α subunit type. Cell. Signal 18, 1190–1200. - PMC - PubMed

Publication types

MeSH terms