. 2021 May 27;184(11):2878-2895.e20.
doi: 10.1016/j.cell.2021.04.012. Epub 2021 May 11.

Dynamic imaging of nascent RNA reveals general principles of transcription dynamics and stochastic splice site selection

Affiliations

Dynamic imaging of nascent RNA reveals general principles of transcription dynamics and stochastic splice site selection

Yihan Wan et al. Cell. .

Abstract

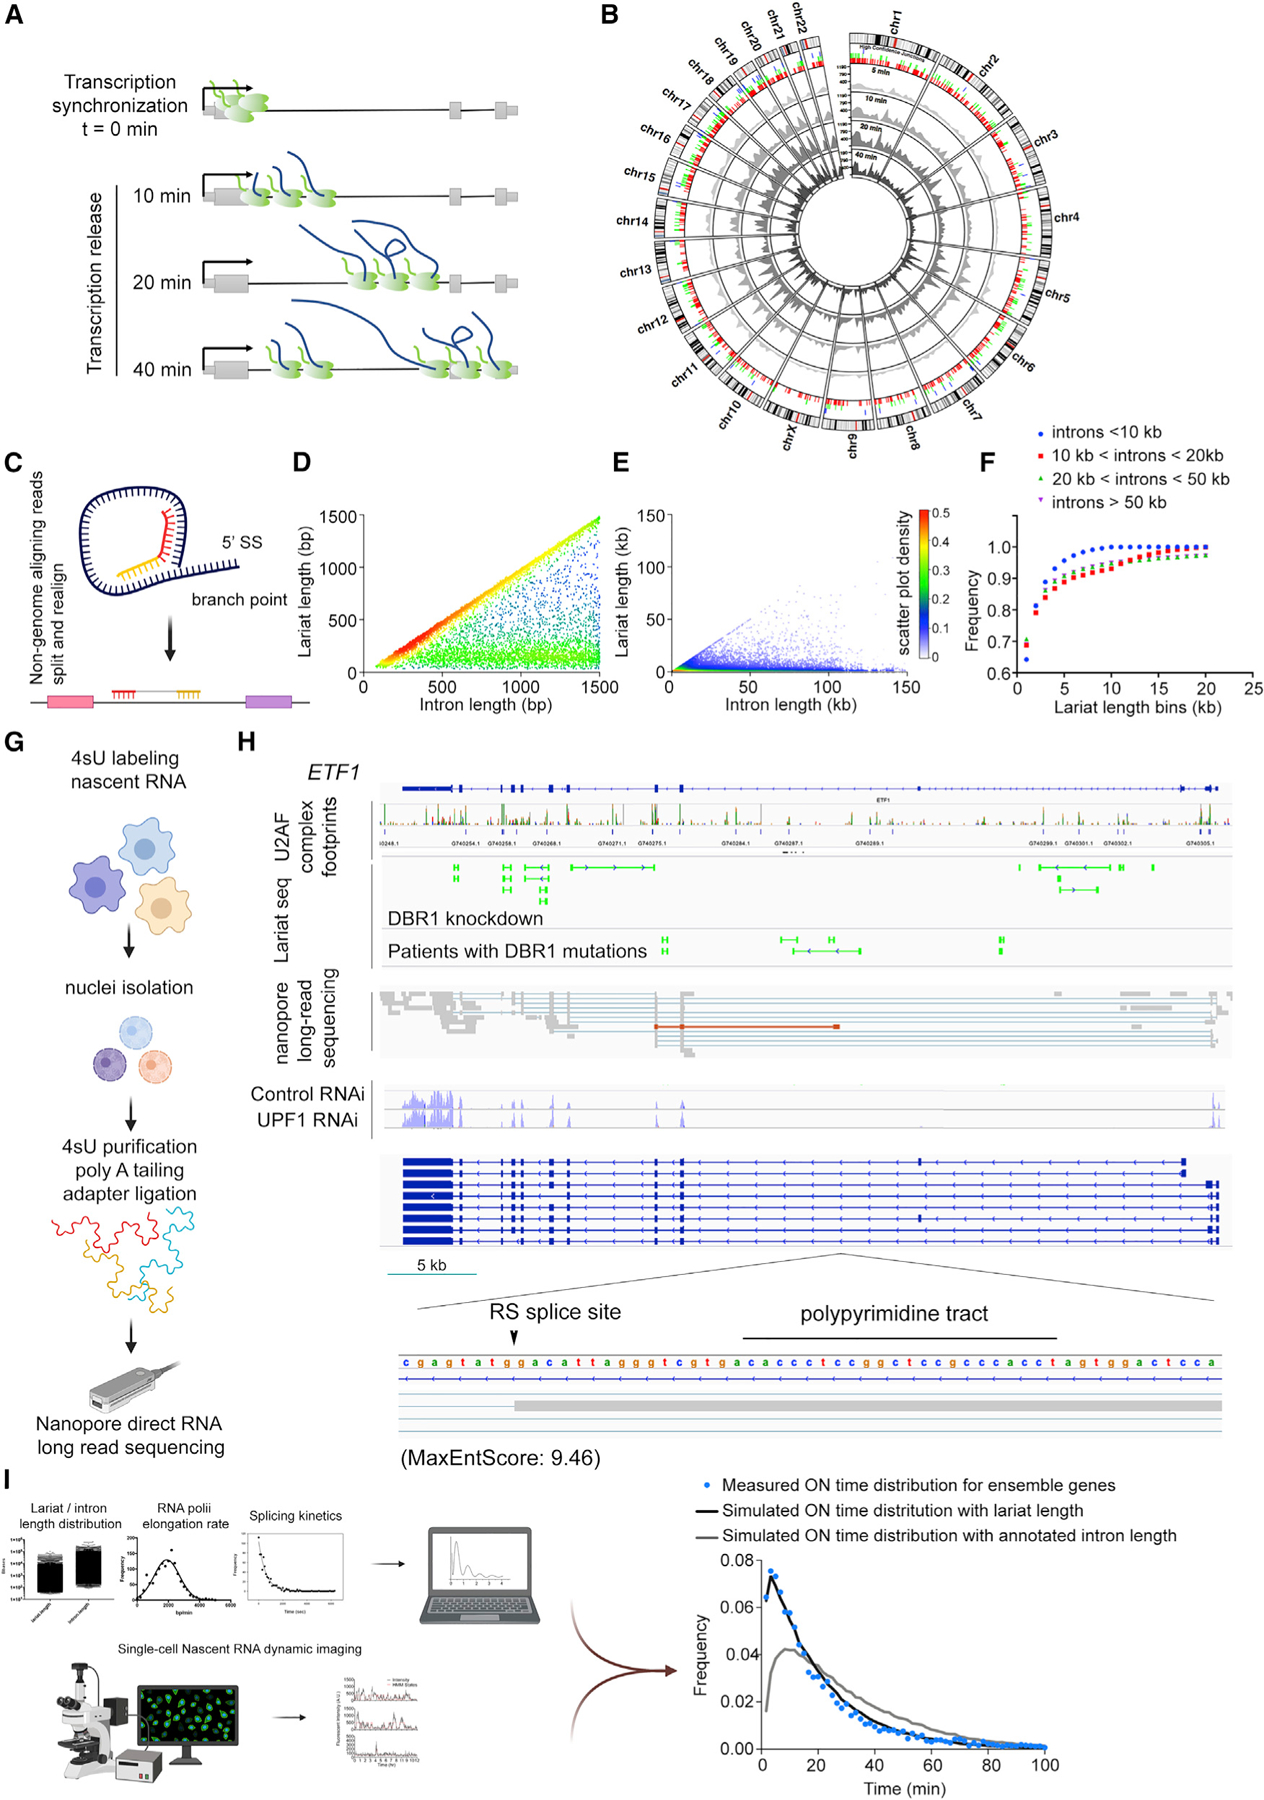
The activities of RNA polymerase and the spliceosome are responsible for the heterogeneity in the abundance and isoform composition of mRNA in human cells. However, the dynamics of these megadalton enzymatic complexes working in concert on endogenous genes have not been described. Here, we establish a quasi-genome-scale platform for observing synthesis and processing kinetics of single nascent RNA molecules in real time. We find that all observed genes show transcriptional bursting. We also observe large kinetic variation in intron removal for single introns in single cells, which is inconsistent with deterministic splice site selection. Transcriptome-wide footprinting of the U2AF complex, nascent RNA profiling, long-read sequencing, and lariat sequencing further reveal widespread stochastic recursive splicing within introns. We propose and validate a unified theoretical model to explain the general features of transcription and pervasive stochastic splice site selection.

Keywords: RNA; fluorescence; heterogeneity; imaging; single molecule; spliceosome; splicing; stochastic; transcription.


Conflict of interest statement

Declaration of interests The authors declare no competing interests.

Figures

Figure 1.
Figure 1.. Single-molecule imaging of nascent RNA reveals general principles of transcriptional bursting
(A) Design of gene-trap (GT) vector to integrated stem loops genome-wide at endogenous loci. SA, splicing acceptor; pA, poly(A); 2A, self-cleaving peptides. (B) A pipeline illustration for high-throughput imaging and analysis of nascent RNA dynamics. (C) Representative live-cell traces from three different genes showing fluorescence intensity of TS (black) and hidden Markov model (HMM) fitting (red). (D) Live-cell traces (n = 1,225) from single-cell clones and the polyclonal population. Hierarchical clustering is based on the distance matrix calculated through integrated periodogram. (E) Cumulative frequency for ON time and OFF time distributions of three clusters (cluster 1, chocolate; cluster 2, cyan; cluster 3, lavender).
Figure 2.
Figure 2.. The kinetic features of human transcription
(A) Ideogram of genes selected for clonal analysis. (B) Heatmap of intensity traces from six genes. Each row represents a single cell recorded for 12 h with 100-s intervals. Traces are sorted according to the duration of the first OFF period. (C) Cumulative frequency of ON time and OFF time distribution for genes in (A). (D) The heterogeneity of mRNA in single cells correlate with transcription OFF time. Correlation between OFF time (τoff) and the coefficient of variation (CV) in single-cell mRNA distribution. R2 = 0.54. mRNA distribution for TFF1 is from our previous work (Rodriguez et al., 2019).
Figure 3.
Figure 3.. Single-intron imaging reveals stochastic splicing kinetics
(A) Probability distribution of ON time from dynamic single-cell imaging. Gene structure, intron length, and MS2 insertion sites are shown. Dashed lines indicate estimated time points when RNAPII reaches the 3′ SS and the transcription termination site (TTSs). (B) Collective ON time distribution of 10 genes (median with 95% confidence interval). (C) Inhibition of splicing resulted in prolonged ON times. Integrated live-cell imaging traces with 100-s intervals for RAB7A with mock or pladienolide B (plad B; 1 µM) treatment. (D) Cumulative frequency of ON time distribution for RAB7A with mock or plad B (10 nM, 100 nM, and 1 µM) treatment. (E–G) Rates of in situ transcription and splicing measured in a population of cells. (E) Transcription was synchronized with 100 µM DRB treatment for 3 h. After DRB washout, a transcription wave visualized by live-cell imaging. (F) Schematic representation of ensemble splicing kinetics measurement. (G) Transcription of exon 2 (Ex2-In2) and splicing of intron 1 (Ex1-In2) of RAB7A in WT (left) and RAB7A-MS2 engineered cells (right) are measured by qPCR. The gene structure is shown below each graph with arrows indicating the exon-intron junctions that are analyzed. Green bar indicates the insertion site for MS2 stem loops. Average trace intensity reflecting transcription wave measured through live-cell imaging (gray curves) is shown in the same chart for the MS2-engineered clones. Right y axis indicates the fluorescent intensity (A.U.) from live-cell imaging. Error bars represent SEM.
Figure 4.
Figure 4.. PAR-CLIP of U2AF heterodimer indicates pervasive intronic binding
(A) Experimental design for PAR-CLIP of the U2AF heterodimer in the nuclear fraction. (B) Distribution of U2AF-complex footprints across annotation categories. (C) Sequence logo from U2AF footprints on annotated SSs, within introns and intergenic regions. (D) Correlation between U2AF footprints abundance and intron length. Each dot corresponds to one intron. (E and F) U2AF footprints in RAB7A. U2AF footprints are identified within introns (blue vertical hash marks) as well as at the annotated 3′ SS. Read coverage for representative U2AF complex footprints identified in intron are shown (marked by cyan rectangles). T > C transitions in the sequenced reads indicate direct binding and successful crosslinking. Maximum entropy score is labeled for each potential SS. (G) Validation of the RS events by primer-extension sequencing. Each splice junction is represented by an arc from the beginning to the end of the junction. The arc thickness is proportional to the read coverage. Primer positions are indicated by red vertical hash marks. (H) An overlay between RS event and U2AF complex footprint identified in RAB7A first intron is shown (region marked by cyan rectangle in G). Junction reads indicating the splicing event are detected through primer-extension sequencing.
Figure 5.
Figure 5.. Direct visualization of stochastic splice site selection in real time.
(A) Schematic of the dual-color labeling in RAB7A first intron (top). MS2 stem loops were integrated ~5 kb downstream of exon1. PP7 stem loops were integrated via CRISPR-Cas9 746 bp upstream of exon 2. The distance between MS2 and PP7 stem loops is ~63 kb. Representative live-cell traces showing the occurrence of RS (1) and canonical splicing (2) in a single cell in real time (bottom) (Video S2). (B) The fluctuation analysis of dual-color fluorescence traces. Approximated fluorescence profile describing the transcription and splicing in RAB7A. The fluorescence signals rise as ramps when stem loops are transcribed and fall when splicing occurs. Three limiting scenarios are described by cross-correlation functions: (1) no RS makes the MS2 to PP7 cross-correlation (blue curve) start as a plateau at τ = 0; (2) all RS imposes the cross-correlation to have a G(τ)=0 at τ = 0 delay; and (3) the hybrid model, which is the combination of the above two scenarios, indicating the occurrence of both RS and canonical splicing. The change of slope at τ = 0 delay is indicative of the fraction of RS events occurring. (C) Autocorrelations of MS2 (green) and PP7 (red) signals from experimental traces (n = 19). (D) Cross-correlation of dual-color time traces (n = 19). Error bars represent SEM (bootstrap). Fraction of RS events are calculated according to the slop change at τ = 0 (inset). (E–I) Stochastic splice site selection is functionally important for splicing efficiency. (E) Schematic of the targeting sites for antisense oligos (ASOs) and smFISH probes in the RAB7A first intron. Two sets of smFISH probes targeting intronic regions near 5′ SS (red) and 3′ SS (green) are indicated. (F) ASOs targeting RS sites result in the accumulation of intronic intermediates in the nucleus. Plad B (1 µM) treatment served as a positive control. Colocalizing foci indicate an intact RAB7A intron1. (G) Distribution of intronic intermediates in the nucleoplasm with ASO blocking. (H) Frequency of overlap between 3′ and 5′ probes with plad B treatment or ASO transfection. (I) Blocking RS sites with ASO compromises total splicing efficiency. The copy number of unspliced pre-mRNA and total spliced mRNA measured by ddPCR from samples collected 24 h after ASO transfection. Error bars represent SD.
Figure 6.
Figure 6.. A unified model based on stochastic splice site selection describes transcription and splicing dynamics
(A) Generalized transcription model with stochastic intron ejection. X, Y, and Z indicate gene states; R indicates RNA steps; S indicates splicing steps; M is the mature transcript; and ∅ denotes RNA degradation. (B) Occupancy distributions for gene states, actual burst size, visible burst size, and splicing probabilities at each RNA step. Circle area is proportional to state occupancy or probability. P indicates the post-transcriptional splicing. For splicing probabilities, the model could predict whether the splicing occurs within the labeled intron or after the synthesis of the 3′ SS (Table S3). (C) The WAIC (Bayesian measure of model predictive ability accounting for model complexity) for all 20 models tested (Methods S1). (D) Splicing kinetics of MYH9 and RAB7A intron 1 explained by the stochastic splice site selection model. Numbers in parentheses indicate co-transcriptional splicing probability at each R step. (E) Splicing kinetics of MYH9 can be explained by an exponential distribution. (F) U2AF complex binding profile for MYH9. The MS2 stem-loop insertion site (indicated by an arrowhead) is 4,019 bp upstream of the annotated 3′ SS. No U2AF complex footprint is detected between the MS2 insertion site and the 3′ SS. (G) Model predicted splicing time distribution.
Figure 7.
Figure 7.. Stochastic splice site selection is a prevalent mechanism across human genome
(A) The experimental design for pulse-chase nascent RNA sequencing. (B) Circos plot overview of pulse-chase nascent RNA-sequencing data. The outer ring is a circular ideogram of the human genome labeled with chromosome number. The inner rings denote all the novel splice junctions detected at each pulse-chase time point. The positions of high-confidence RS sites are indicated by vertical bars between inner and outer rings. Red, splice junctions ligate annotated 5′ SS to a novel site; green, splice junctions ligate annotated 3′ SS to a novel site; blue, nested splice junctions within intron. (C) Diagram illustration of lariat sequencing alignment strategy. (D and E) Scatter density plot of lariat length versus intron length. Each dot represents a lariat and the intron it derived from. Intron length <1,500 bp are shown in (D) and <150 kb are shown in (E). (F) Cumulative distribution of lariat length across binned intron length categories. (G) Diagram of nascent RNA long-read sequencing with Nanopore direct RNA-sequencing approach. (H) An overview of the stochastic splice site selection model revealed by multiple ensemble measurements, including U2AF complex footprints, lariat sequencing, and nascent RNA long-read sequencing (also see Figure S7). Lariat sequencing results are shown as split reads representing ligated 5′ SS and branch point (green). Direct nascent RNA long-read sequencing reads are shown in gray, with thick lines indicate mapped reads and thin lines indicated splice junctions. The RS intermediate is highlighted in brown. Annotated gene structures from RefSeq are shown below. UPF1 depletion data showed no accumulation of poison exons after NMD pathway perturbation. The sequence of the RS site is shown in a zoomed-in window. (I) Simulation of nascent RNA dwell time (ON time) according to the sequencing measured lariat length distribution, our measure of RNAPII velocity (~2 kb/min), and our measure of splicing kinetics (8.2 min). The computed nascent RNA ON time recovered the empirical distribution of intronic dwell times from our live-cell imaging in polyclonal population (blue dots). There are no free fitting parameters. The computed dwell time using annotated intron size is shown as a comparison (gray line).

Comment in

References

    1. Ameur A, Zaghlool A, Halvardson J, Wetterbom A, Gyllensten U, Cavelier L, and Feuk L (2011). Total RNA sequencing reveals nascent transcription and widespread co-transcriptional splicing in the human brain. Nat. Struct. Mol. Biol 18, 1435–1440. - PubMed
    1. Attig J, Ruiz de Los Mozos I, Haberman N, Wang Z, Emmett W, Zarnack K, König J, and Ule J (2016). Splicing repression allows the gradual emergence of new Alu-exons in primate evolution. eLife 5, e19545. - PMC - PubMed
    1. Berthold MR, Cebron N, Dill F, Gabriel TR, Kötter T, Meinl T, Ohl P, Sieb C, Thiel K, and Wiswedel B (2008). KNIME: The Konstanz Information Miner. In Studies in Classification, Data Analysis, and Knowledge Organization, Preisach C, Burkhardt H, Schmidt-Thieme L, and Decker R, eds. (Springer; ), pp. 319–326.
    1. Burke JE, Longhurst AD, Merkurjev D, Sales-Lee J, Rao B, Moresco JJ, Yates JR 3rd, Li JJ, and Madhani HD (2018). Spliceosome Profiling Visualizes Operations of a Dynamic RNP at Nucleotide Resolution. Cell 173, 1014–1030.e17. - PMC - PubMed
    1. Burnette JM, Miyamoto-Sato E, Schaub MA, Conklin J, and Lopez AJ (2005). Subdivision of large introns in Drosophila by recursive splicing at non-exonic elements. Genetics 170, 661–674. - PMC - PubMed

Publication types