

High throughput quantification of short nucleic acid samples by capillary electrophoresis with automated data processing
- PMID: 33979658
- PMCID: PMC8384658
- DOI: 10.1016/j.ab.2021.114239
High throughput quantification of short nucleic acid samples by capillary electrophoresis with automated data processing
Abstract
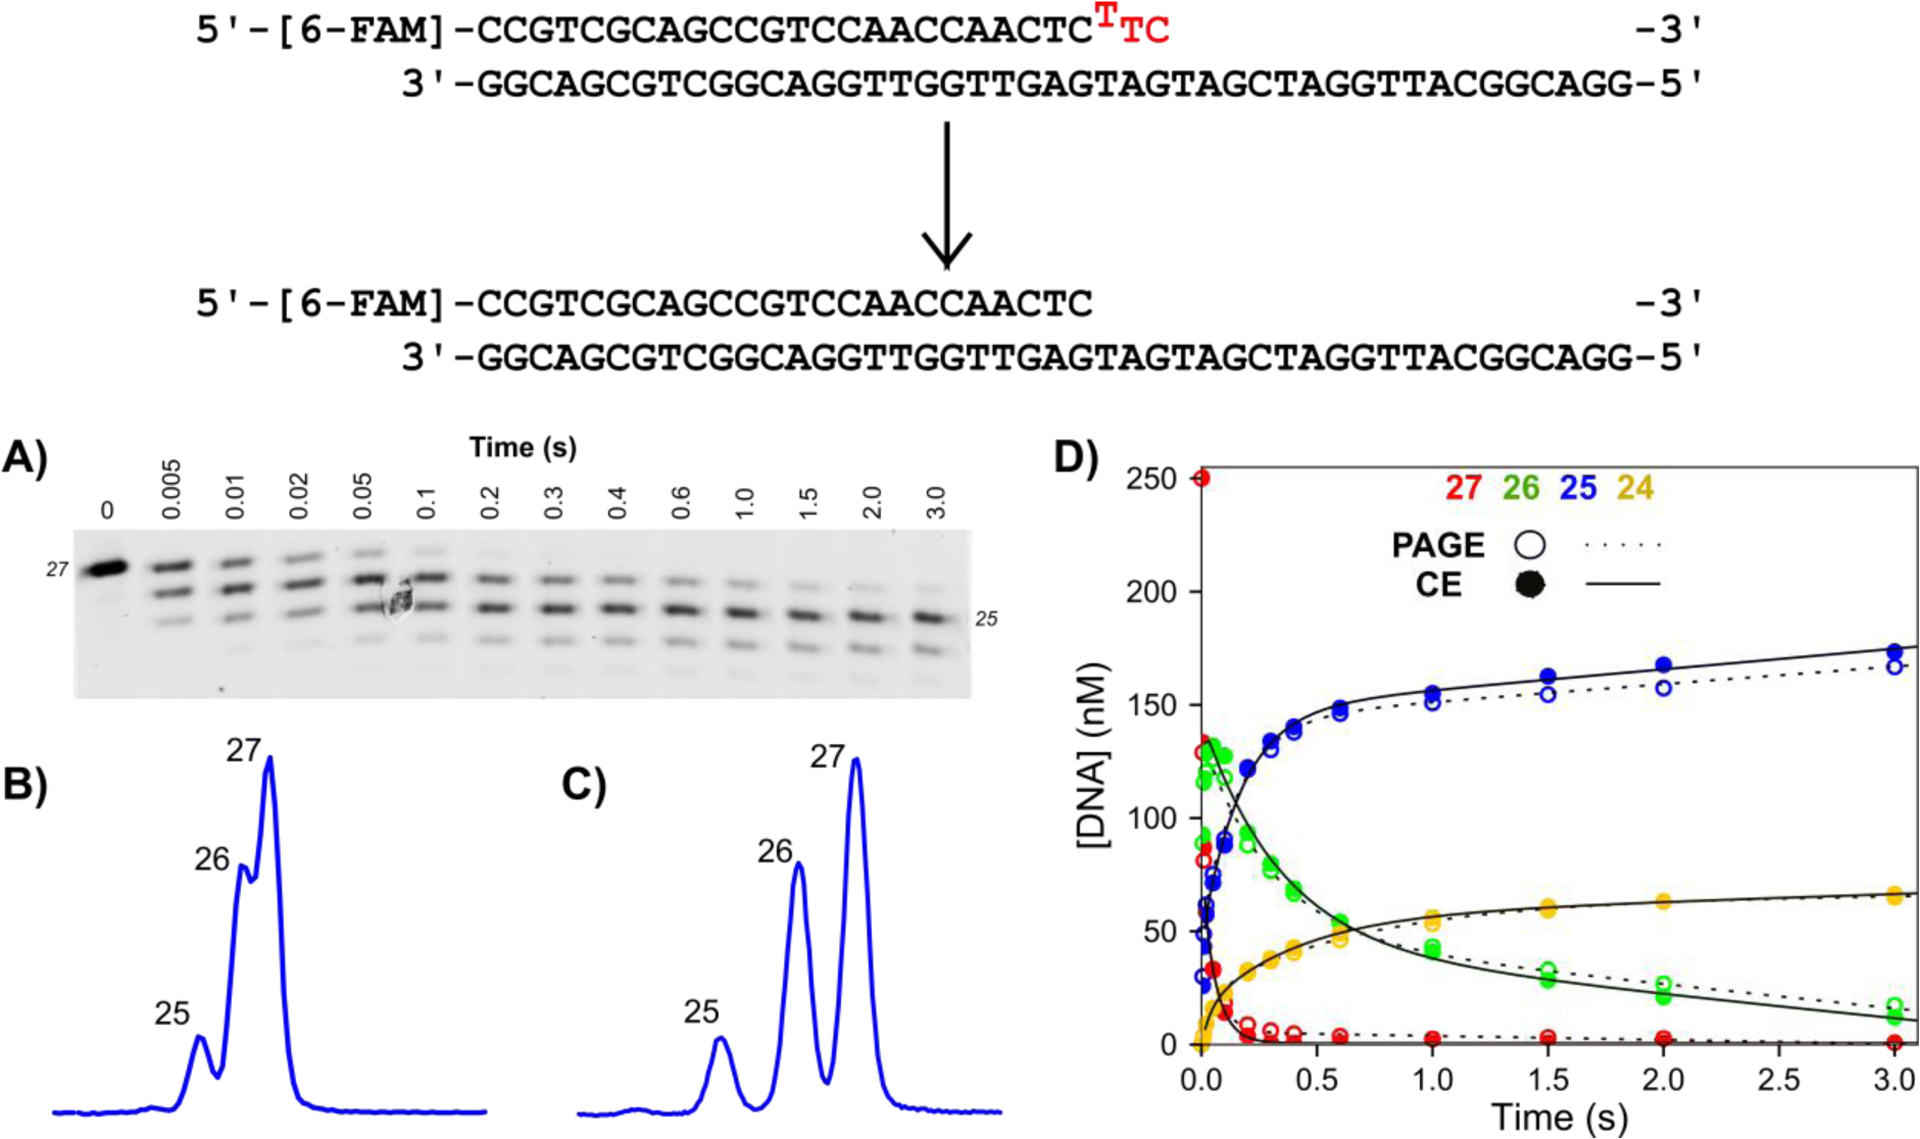
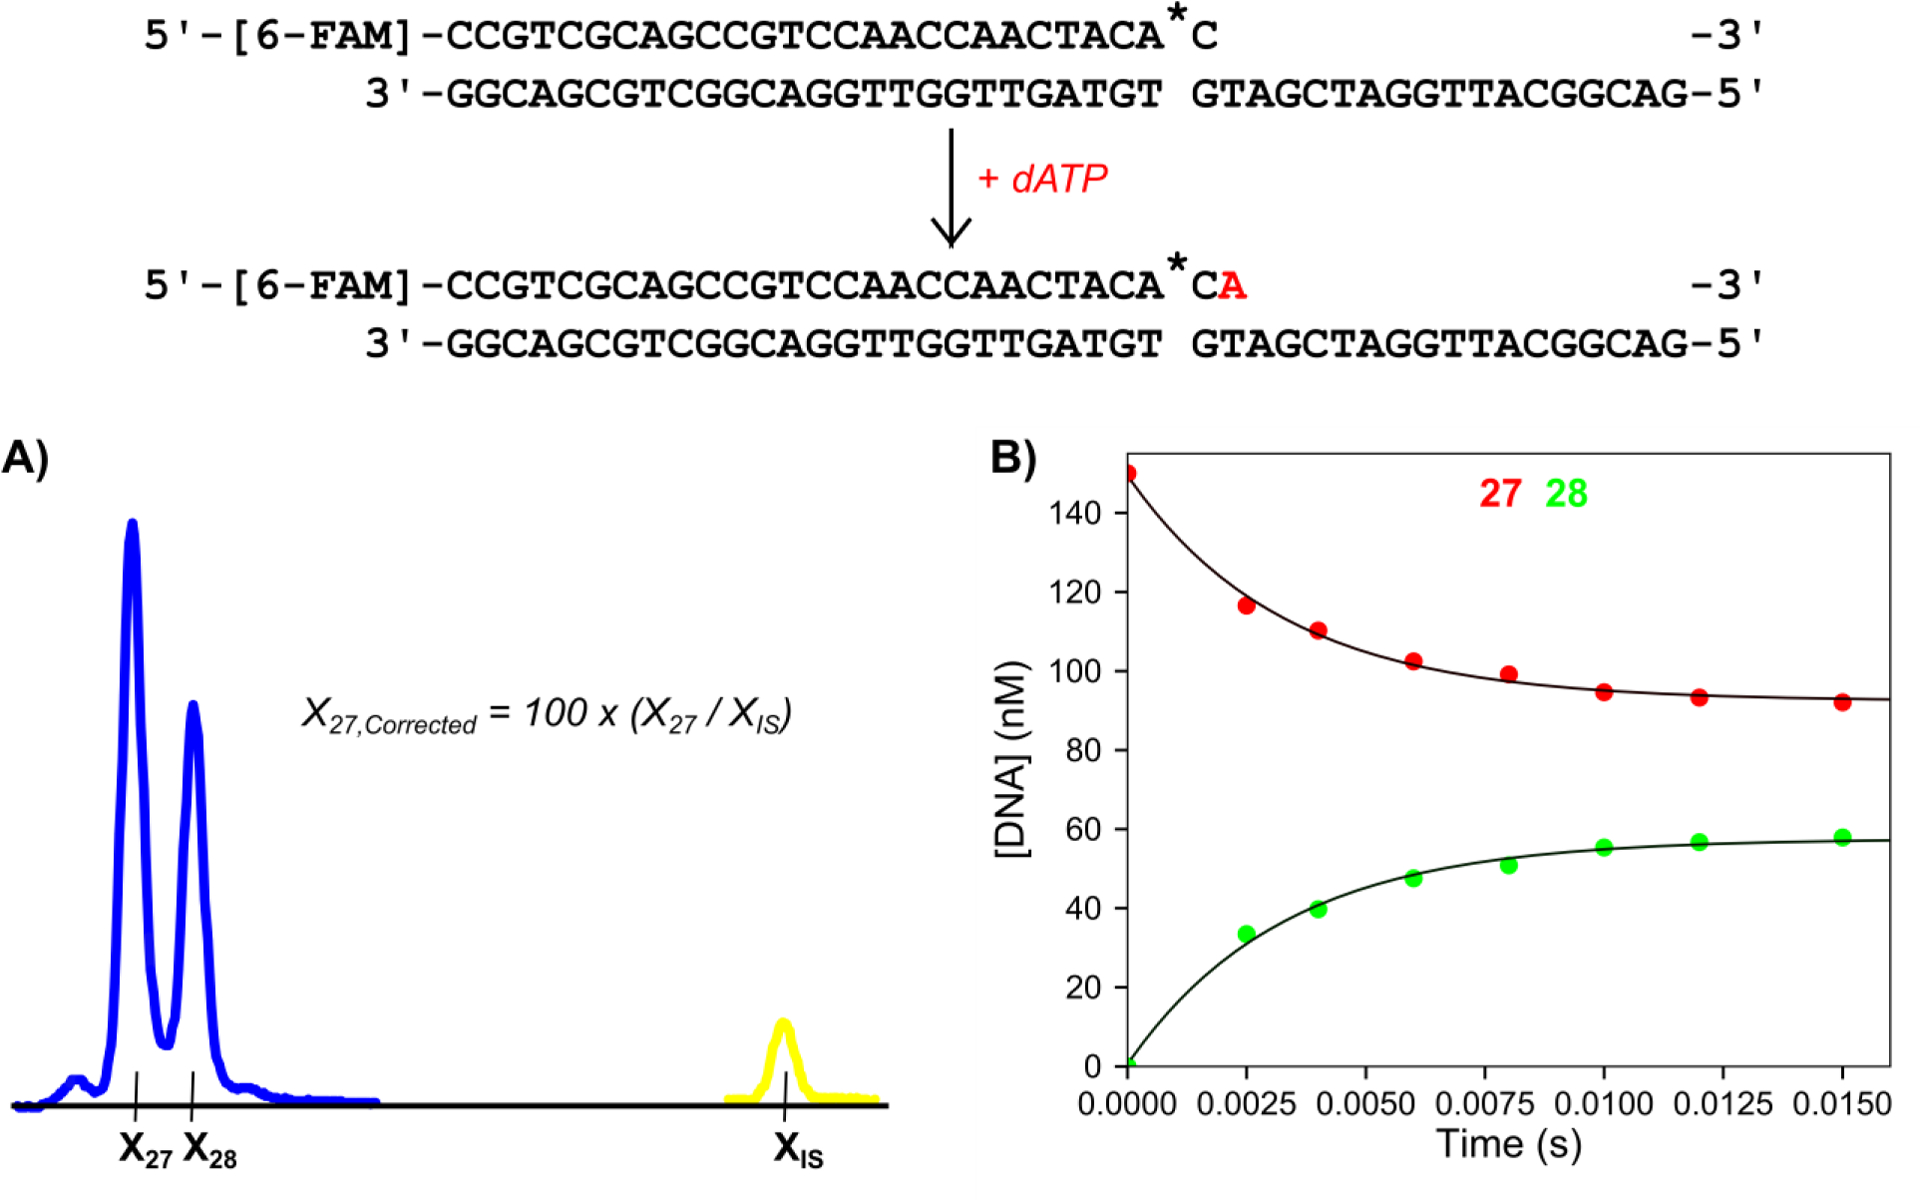
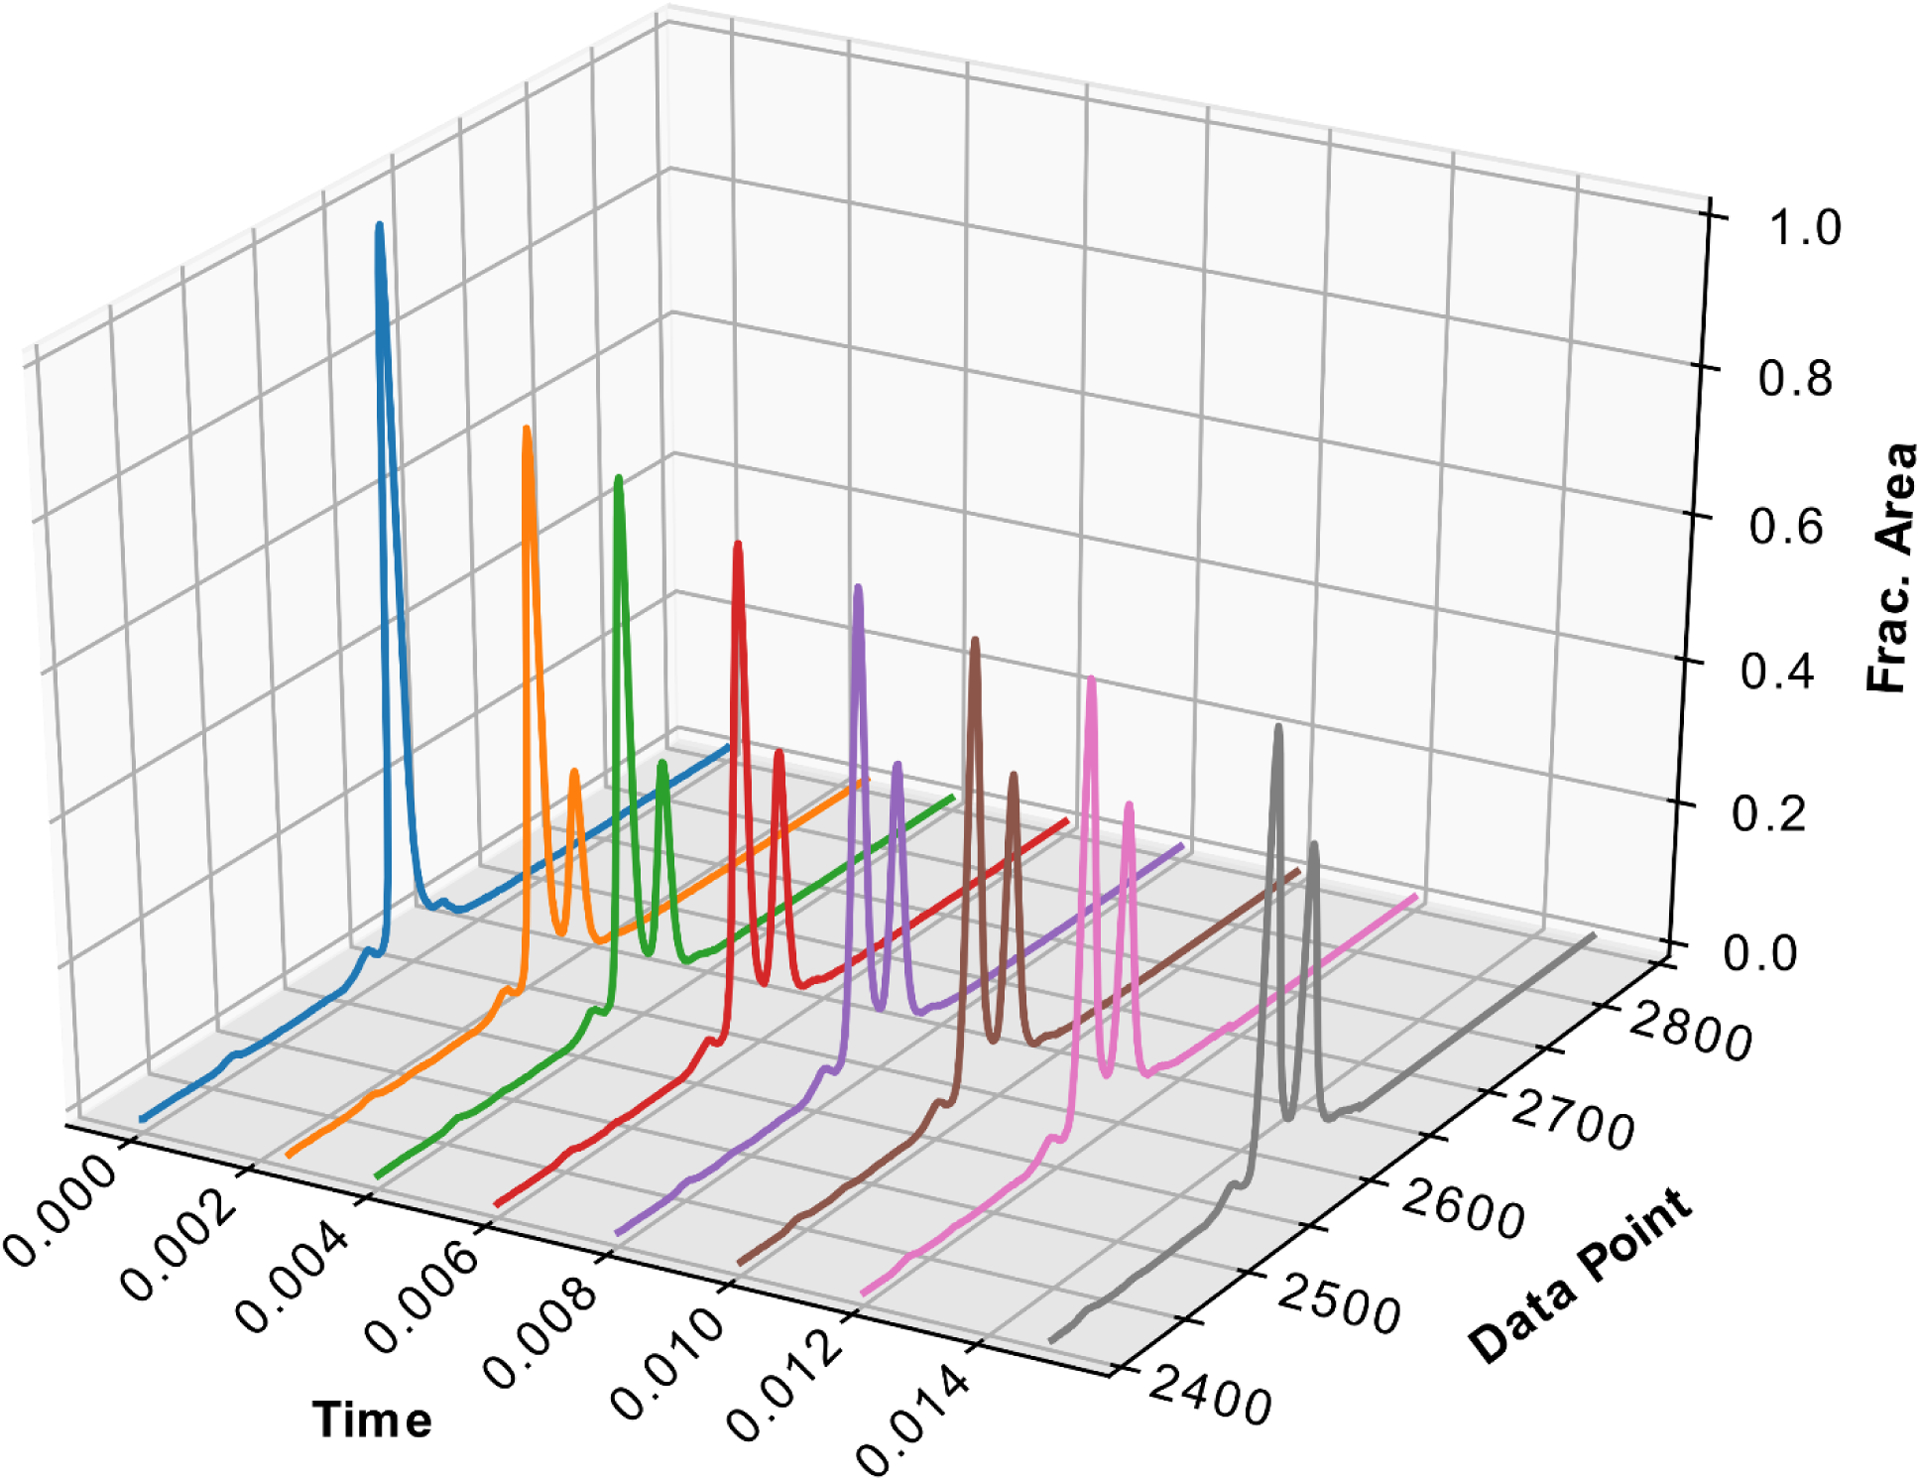
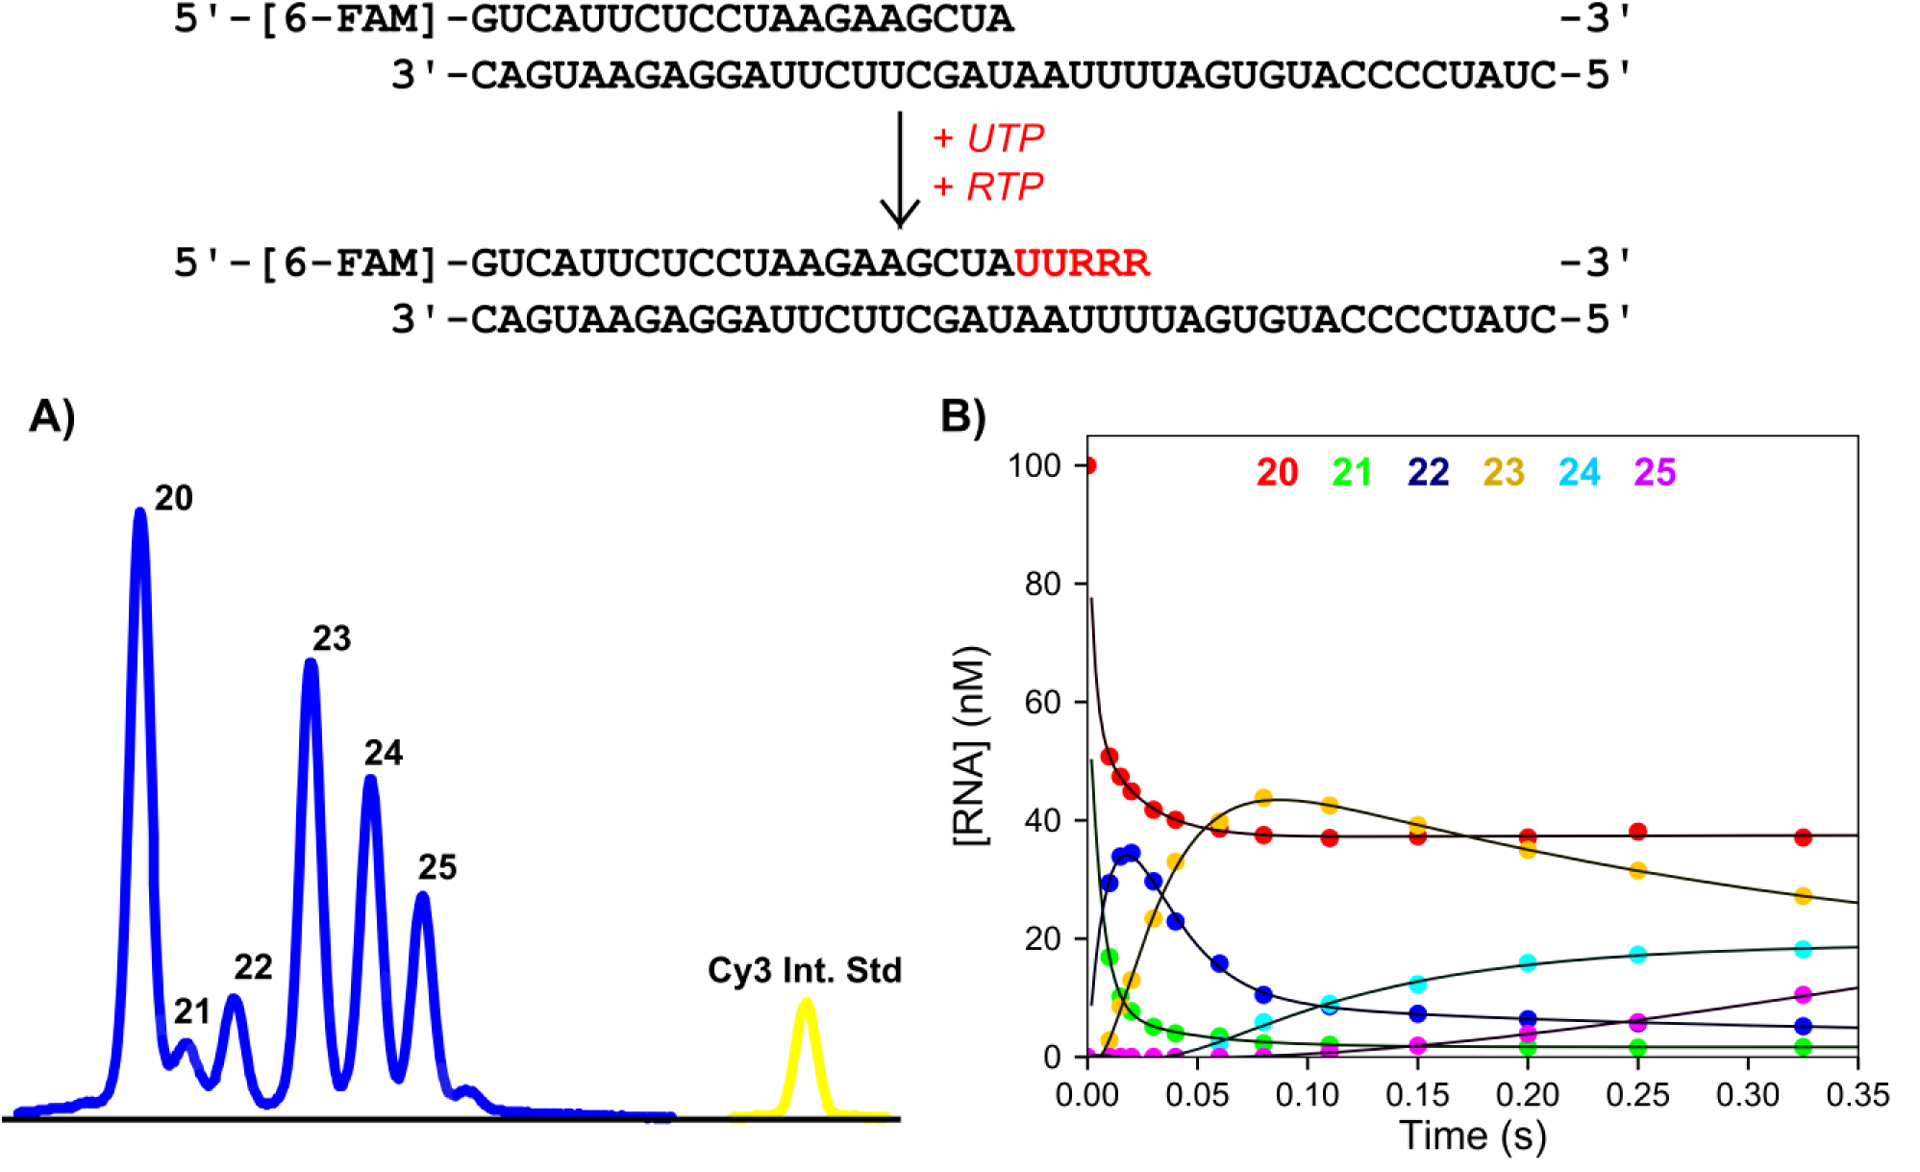
Analysis of catalytic activity of nucleic acid enzymes is crucial for many applications, ranging from biotechnology to the search for antiviral drugs. Commonly used analytical methods for quantifying DNA and RNA reaction products based on slab-gel electrophoresis are limited in throughput, speed, and accuracy. Here we report the optimization of high throughput methods to separate and quantify short nucleic acid reaction products using DNA sequencing instruments based on capillary electrophoresis with fluorescence detection. These methods afford single base resolution without requiring extensive sample preparation. Additionally, we show that the utility of our system extends to quantifying RNA products. The efficiency and reliability of modern instruments offers a large increase in throughput but complications due to variations in migration times between capillaries required us to develop a computer program to normalize the data and quantify the products for automated kinetic analysis. The methods presented here greatly increase sample throughput and accuracy and should be applicable to many nucleic acid enzymes.
Keywords: Capillary electrophoresis; DNA and RNA analysis; DNA polymerase; High throughput; Quantification and analysis software; Sanger sequencer.
Copyright © 2021 Elsevier Inc. All rights reserved.
Conflict of interest statement
Conflict of interest:
KAJ is president of KinTek Corporation, which provided the RQF-3 rapid quench-flow instrument, and KinTek Explorer software used in this study.
Figures
Similar articles
-
[Advances in on-line enzyme assays by sequence analysis-based capillary electrophoresis].Se Pu. 2020 Oct 8;38(10):1143-1153. doi: 10.3724/SP.J.1123.2020.05008. Se Pu. 2020. PMID: 34213111 Review. Chinese.
-
Capillary electrophoresis based on nucleic acid analysis for diagnosing inherited diseases.Clin Chem Lab Med. 2020 May 5;59(2):249-266. doi: 10.1515/cclm-2020-0186. Clin Chem Lab Med. 2020. PMID: 32374277 Review.
-
RIKEN integrated sequence analysis (RISA) system--384-format sequencing pipeline with 384 multicapillary sequencer.Genome Res. 2000 Nov;10(11):1757-71. doi: 10.1101/gr.152600. Genome Res. 2000. PMID: 11076861 Free PMC article.
-
Adapting capillary gel electrophoresis as a sensitive, high-throughput method to accelerate characterization of nucleic acid metabolic enzymes.Nucleic Acids Res. 2016 Jan 29;44(2):e15. doi: 10.1093/nar/gkv899. Epub 2015 Sep 13. Nucleic Acids Res. 2016. PMID: 26365239 Free PMC article.
-
Radial capillary array electrophoresis microplate and scanner for high-performance nucleic acid analysis.Anal Chem. 1999 Dec 1;71(23):5354-61. doi: 10.1021/ac990518p. Anal Chem. 1999. PMID: 10596215
Cited by
-
Mechanisms of inhibition of viral RNA replication by nucleotide analogs.Enzymes. 2021;49:39-62. doi: 10.1016/bs.enz.2021.07.001. Epub 2021 Sep 27. Enzymes. 2021. PMID: 34696838 Free PMC article. Review.
-
Kinetics of elementary steps in loop-mediated isothermal amplification (LAMP) show that strand invasion during initiation is rate-limiting.Nucleic Acids Res. 2023 Jan 11;51(1):488-499. doi: 10.1093/nar/gkac1221. Nucleic Acids Res. 2023. PMID: 36583345 Free PMC article.
-
Quantitative Analysis of Genomic DNA Degradation of E. coli Using Automated Gel Electrophoresis under Various Levels of Microwave Exposure.Gels. 2024 Apr 2;10(4):242. doi: 10.3390/gels10040242. Gels. 2024. PMID: 38667661 Free PMC article.
-
Structural basis of a dual-function type II-B CRISPR-Cas9.Nucleic Acids Res. 2025 Jun 20;53(12):gkaf585. doi: 10.1093/nar/gkaf585. Nucleic Acids Res. 2025. PMID: 40613710 Free PMC article.
-
Substrate Specificity and Kinetics of RNA Hydrolysis by SARS-CoV-2 NSP10/14 Exonuclease.ACS Bio Med Chem Au. 2022 Dec 21;2(6):600-606. doi: 10.1021/acsbiomedchemau.2c00046. Epub 2022 Nov 16. ACS Bio Med Chem Au. 2022. PMID: 36570070 Free PMC article.
References
-
- Donlin MJ, Patel SS, Johnson KA, Kinetic partitioning between the exonuclease and polymerase sites in DNA error correction, Biochemistry, 30 (1991) 538–546. - PubMed
-
- Capson TL, Peliska JA, Kaboord BF, Frey MW, Lively C, Dahlberg M, Benkovic SJ, Kinetic characterization of the polymerase and exonuclease activities of the gene 43 protein of bacteriophage T4, Biochemistry, 31 (1992) 10984–10994. - PubMed
-
- Kati WM, Johnson KA, Jerva LF, Anderson KS, Mechanism and fidelity of HIV reverse transcriptase, Journal of Biological Chemistry, 267 (1992) 25988–25997. - PubMed
-
- Reddy MK, Weitzel SE, von Hippel PH, Processive proofreading is intrinsic to T4 DNA polymerase, Journal of Biological Chemistry, 267 (1992) 14157–14166. - PubMed
-
- Jia Y, Patel SS, Kinetic Mechanism of Transcription Initiation by Bacteriophage T7 RNA Polymerase, Biochemistry, 36 (1997) 4223–4232. - PubMed
Publication types
MeSH terms
Substances
Grants and funding
LinkOut - more resources
Full Text Sources
Other Literature Sources
