. 2021 May 12;22(1):340.
doi: 10.1186/s12864-021-07663-6.

How imputation can mitigate SNP ascertainment Bias

Affiliations

How imputation can mitigate SNP ascertainment Bias

Johannes Geibel et al. BMC Genomics. .

Abstract

Background: Population genetic studies based on genotyped single nucleotide polymorphisms (SNPs) are influenced by a non-random selection of the SNPs included in the used genotyping arrays. The resulting bias in the estimation of allele frequency spectra and population genetics parameters like heterozygosity and genetic distances relative to whole genome sequencing (WGS) data is known as SNP ascertainment bias. Full correction for this bias requires detailed knowledge of the array design process, which is often not available in practice. This study suggests an alternative approach to mitigate ascertainment bias of a large set of genotyped individuals by using information of a small set of sequenced individuals via imputation without the need for prior knowledge on the array design.

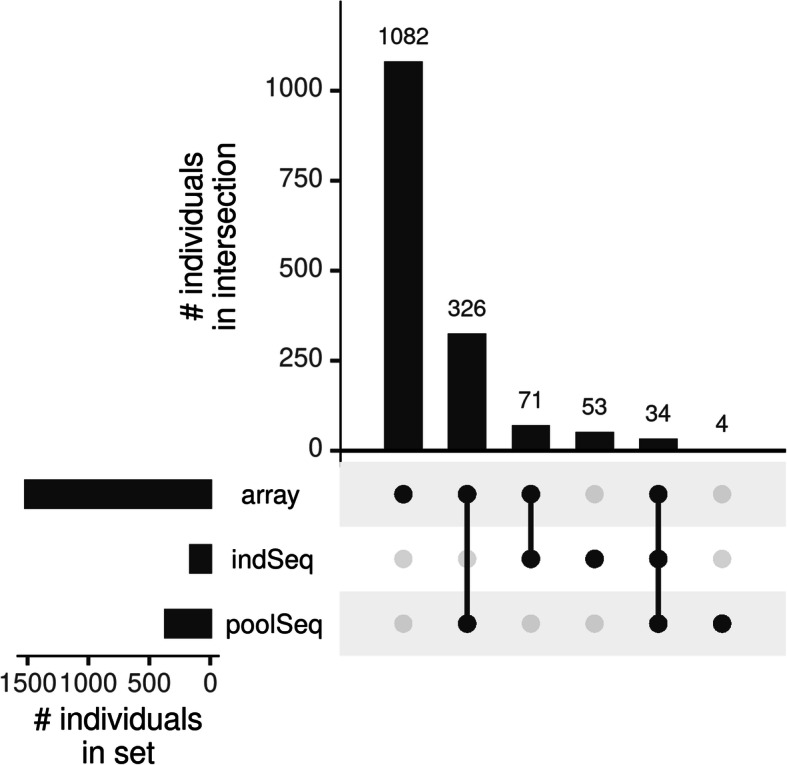
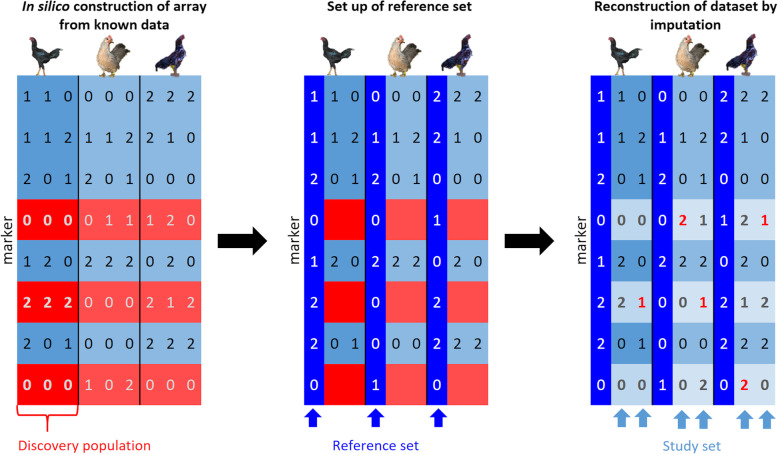
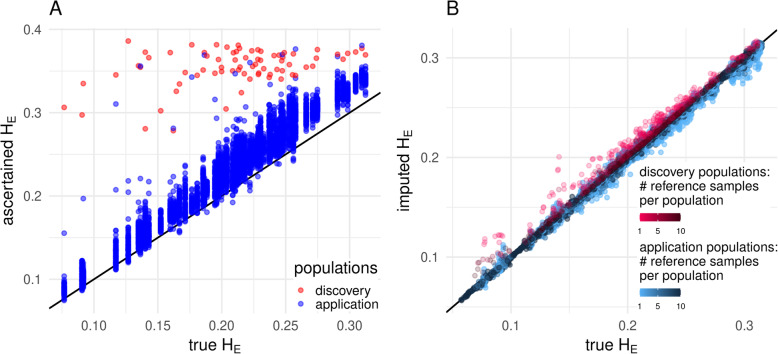
Results: The strategy was first tested by simulating additional ascertainment bias with a set of 1566 chickens from 74 populations that were genotyped for the positions of the Affymetrix Axiom™ 580 k Genome-Wide Chicken Array. Imputation accuracy was shown to be consistently higher for populations used for SNP discovery during the simulated array design process. Reference sets of at least one individual per population in the study set led to a strong correction of ascertainment bias for estimates of expected and observed heterozygosity, Wright's Fixation Index and Nei's Standard Genetic Distance. In contrast, unbalanced reference sets (overrepresentation of populations compared to the study set) introduced a new bias towards the reference populations. Finally, the array genotypes were imputed to WGS by utilization of reference sets of 74 individuals (one per population) to 98 individuals (additional commercial chickens) and compared with a mixture of individually and pooled sequenced populations. The imputation reduced the slope between heterozygosity estimates of array data and WGS data from 1.94 to 1.26 when using the smaller balanced reference panel and to 1.44 when using the larger but unbalanced reference panel. This generally supported the results from simulation but was less favorable, advocating for a larger reference panel when imputing to WGS.

Conclusions: The results highlight the potential of using imputation for mitigation of SNP ascertainment bias but also underline the need for unbiased reference sets.

Keywords: Chickens; Imputation; Population genetics; SNP ascertainment bias.


Conflict of interest statement

The authors declare that they have no competing interests.

Figures

Fig. 1
Fig. 1
UpSet plot showing the distinct intersections of chickens between the used sequencing/ genotyping technologies. The left bar plot contains the total number of individuals that were genotyped (array), individually sequenced (indSeq), or pooled sequenced (poolSeq). The upper bar plot contains the number of individuals within each distinct intersection, indicated by the connected points below
Fig. 2
Fig. 2
Schematic representation of the workflow of creating and re-imputing the in silico arrays. The starting point was a 0/1/2 coded marker matrix with SNPs in rows and individuals in columns (different populations separated by vertical lines). In a first step, an array (light blue rows) was constructed in silico from known data by setting all SNPs to missing which were invariable (MAF < 0.05, red rows) in the discovery population (first three columns). In a second step, a reference set (dark blue columns) was set up from animals for which complete knowledge of all SNPs was assumed. This Reference set was then used in a third step to impute the missing SNPs in the study set using Beagle 5.0 and resulting in a certain amount of imputation errors (red numbers)
Fig. 3
Fig. 3
True HE vs. ascertained HE (a) and imputed HE (b) by population group. For the imputed case, the strategy of using the same number of reference samples per population (allPop_74_740) is shown, an increase in the number of reference samples per population (1–10) is marked by an increasing color gradient and the line of identity is marked by a solid black line
Fig. 4
Fig. 4
Development of correlation within population group (a), slope (b) and mean overestimation (c) of the regression lines for the two heterozygosity estimates when distributing the reference samples equally across all populations (allPop_74_740). The intended value for unbiasedness and minimum variance is marked as dense black horizontal line. Note that the case without imputation is consistent with zero reference samples
Fig. 5
Fig. 5
Development of the per-animal imputation accuracy for the in silico array to genotype set imputation with an increasing number of reference animals per population. Individuals are grouped on whether they belong to the population used for SNP discovery or not and reference individuals were chosen as in scenario allPop_74_740. The lines show the trend of the median and outliers are not shown in the plot as they do not add valuable information due to the high number of repetitions
Fig. 6
Fig. 6
Effect of different correction strategies on ascertainment bias for expected heterozygosity (HE; A + B) and for Nei’s standard genetic distance (D; C + D). A + C – uncorrected array, linkage pruned array and imputed array (reference set 74_1perLine) based vs. sequence-based HE/ D. B + D – array imputed with different reference sets vs. sequence-based HE/ D. The solid black line represents the line of identity, the solid colored lines are regression lines within the individually sequenced populations (larger points) and the dashed lines regression lines within all populations which include individually and pooled (small points) sequenced populations. Note that there is also an effect of pooled sequencing which affects the ‘true’ values of the pooled sequenced populations

References

    1. Novembre J, Johnson T, Bryc K, Kutalik Z, Boyko AR, Auton A, Indap A, King KS, Bergmann S, Nelson MR, Stephens M, Bustamante CD. Genes mirror geography within Europe. Nature. 2008;456(7218):98–101. doi: 10.1038/nature07331. - DOI - PMC - PubMed
    1. Patterson N, Moorjani P, Luo Y, Mallick S, Rohland N, Zhan Y, Genschoreck T, Webster T, Reich D. Ancient admixture in human history. Genetics. 2012;192(3):1065–1093. doi: 10.1534/genetics.112.145037. - DOI - PMC - PubMed
    1. Laurie CC, Nickerson DA, Anderson AD, Weir BS, Livingston RJ, Dean MD, Smith KL, Schadt EE, Nachman MW. Linkage disequilibrium in wild mice. Plos Genet. 2007;3(8):e144. doi: 10.1371/journal.pgen.0030144. - DOI - PMC - PubMed
    1. Platt A, Horton M, Huang YS, Li Y, Anastasio AE, Mulyati NW, Ågren J, Bossdorf O, Byers D, Donohue K, Dunning M, Holub EB, Hudson A, le Corre V, Loudet O, Roux F, Warthmann N, Weigel D, Rivero L, Scholl R, Nordborg M, Bergelson J, Borevitz JO. The scale of population structure in Arabidopsis thaliana. Plos Genet. 2010;6(2):e1000843. doi: 10.1371/journal.pgen.1000843. - DOI - PMC - PubMed
    1. Travis AJ, Norton GJ, Datta S, Sarma R, Dasgupta T, Savio FL, Macaulay M, Hedley PE, McNally KL, Sumon MH, Islam MR, Price AH. Assessing the genetic diversity of rice originating from Bangladesh, Assam and West Bengal. Rice. 2015;8(1):35. doi: 10.1186/s12284-015-0068-z. - DOI - PMC - PubMed

LinkOut - more resources