

Multivendor comparison of global and regional 2D cardiovascular magnetic resonance feature tracking strains vs tissue tagging at 3T
- PMID: 33980259
- PMCID: PMC8117295
- DOI: 10.1186/s12968-021-00742-3
Multivendor comparison of global and regional 2D cardiovascular magnetic resonance feature tracking strains vs tissue tagging at 3T
Abstract
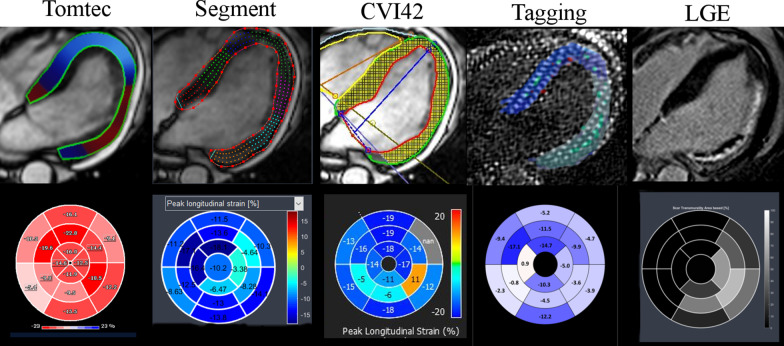
Background: Cardiovascular magnetic resonance (CMR) 2D feature tracking (FT) left ventricular (LV) myocardial strain has seen widespread use to characterize myocardial deformation. Yet, validation of CMR FT measurements remains scarce, particularly for regional strain. Therefore, we aimed to perform intervendor comparison of 3 different FT software against tagging.
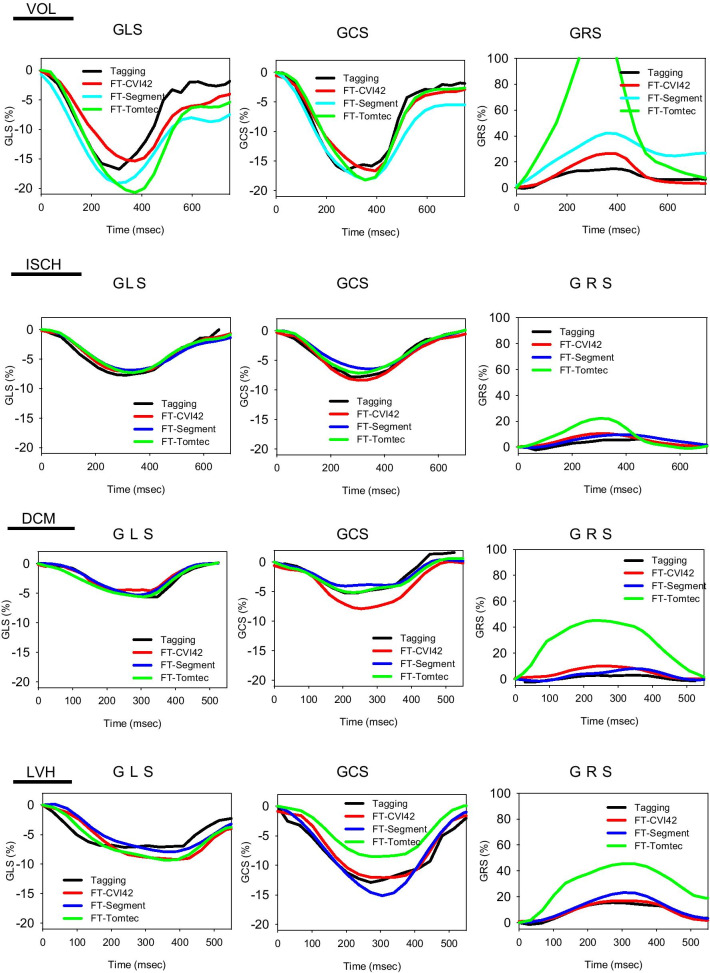
Methods: In 61 subjects (18 healthy subjects, 18 patients with chronic myocardial infarction, 15 with dilated cardiomyopathy, and 10 with LV hypertrophy due to hypertrophic cardiomyopathy or aortic stenosis) were prospectively compared global (G) and regional transmural peak-systolic Lagrangian longitudinal (LS), circumferential (CS) and radial strains (RS) by 3 FT software (cvi42, Segment, and Tomtec) among each other and with tagging at 3T. We also evaluated the ability of regional LS, CS, and RS by different FT software vs tagging to identify late gadolinium enhancement (LGE) in the 18 infarct patients.
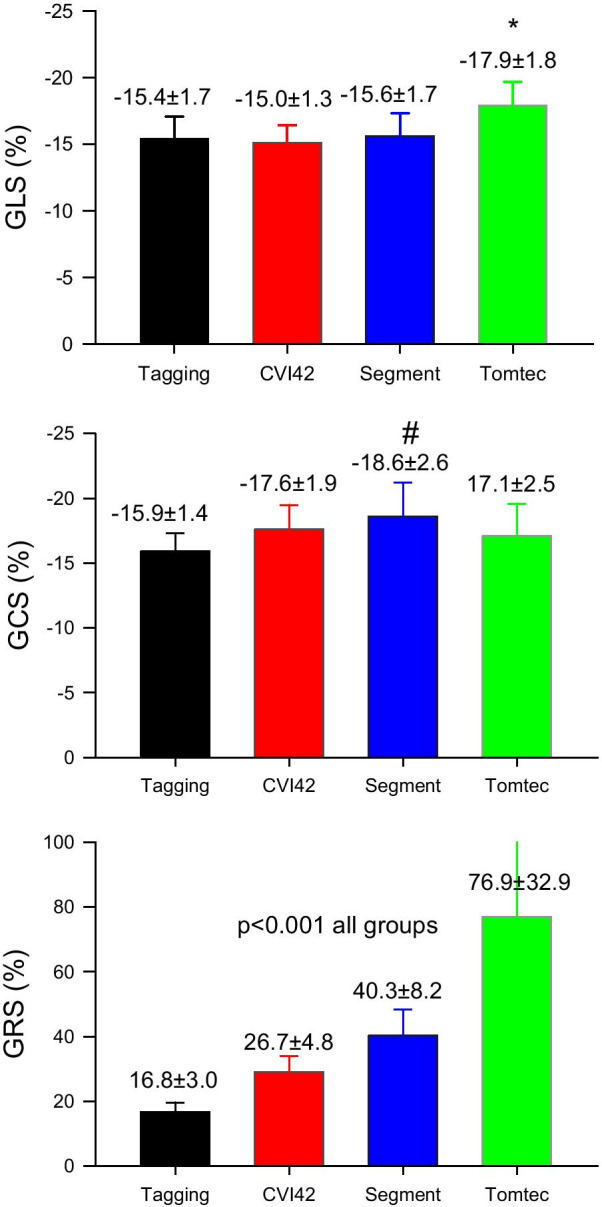
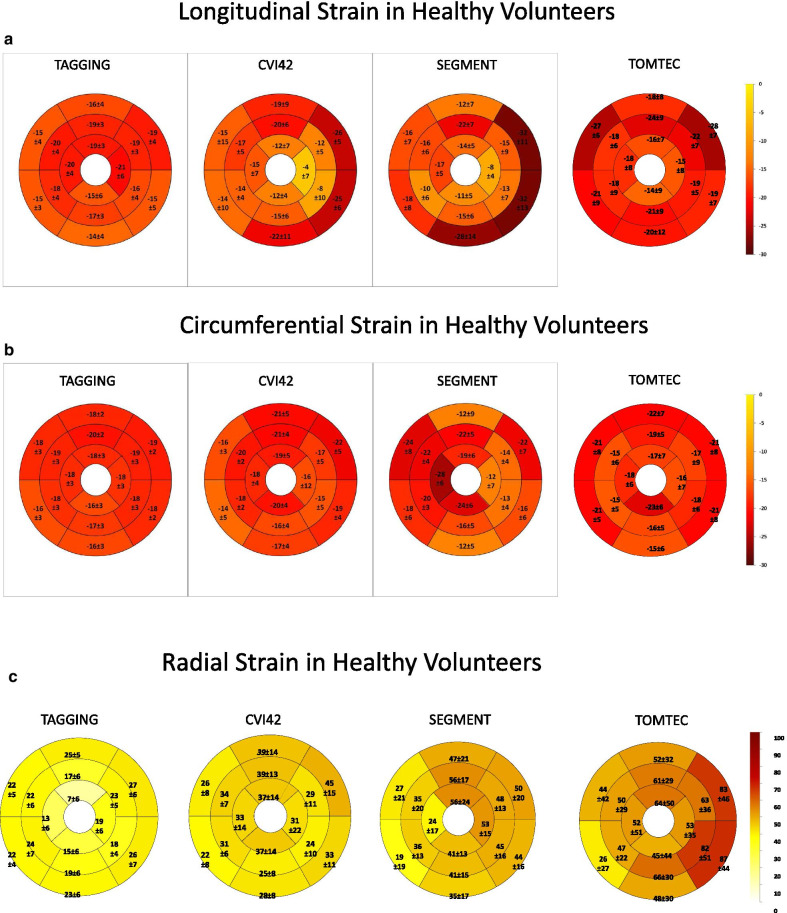
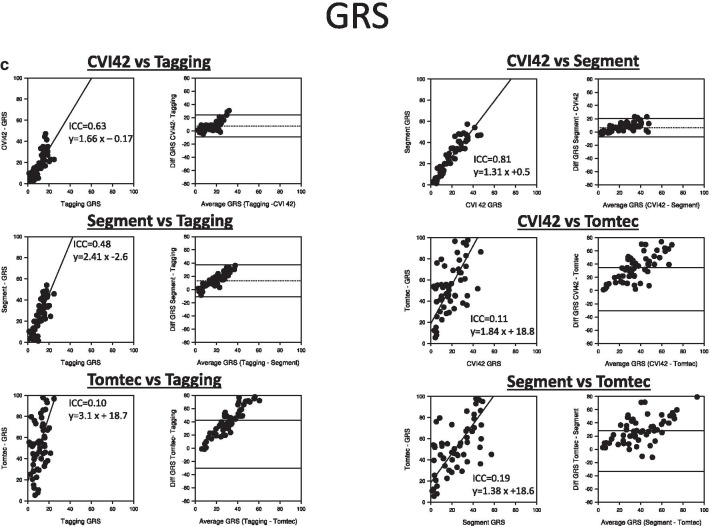
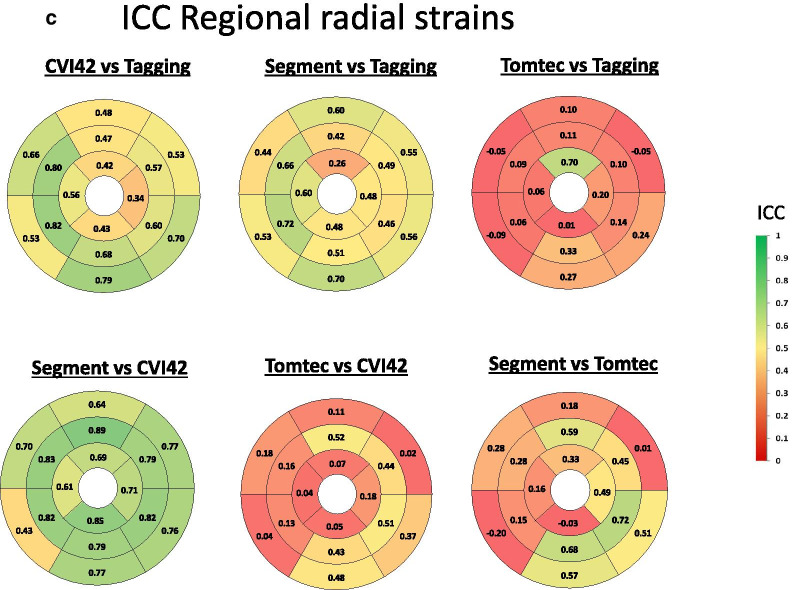
Results: GLS and GCS by all 3 software had an excellent agreement among each other (ICC = 0.94-0.98 for GLS and ICC = 0.96-0.98 for GCS respectively) and against tagging (ICC = 0.92-0.94 for GLS and ICC = 0.88-0.91 for GCS respectively), while GRS showed inconsistent agreement between vendors (ICC 0.10-0.81). For regional LS, the agreement was good (ICC = 0.68) between 2 vendors but less vs the 3rd (ICC 0.50-0.59) and moderate to poor (ICC 0.44-0.47) between all three FT software and tagging. Also, for regional CS agreement between 2 software was higher (ICC = 0.80) than against the 3rd (ICC = 0.58-0.60), and both better agreed with tagging (ICC = 0.70-0.72) than the 3rd (ICC = 0.57). Regional RS had more variation in the agreement between methods ranging from good (ICC = 0.75) to poor (ICC = 0.05). Finally, the accuracy of scar detection by regional strains differed among the 3 FT software. While the accuracy of regional LS was similar, CS by one software was less accurate (AUC 0.68) than tagging (AUC 0.80, p < 0.006) and RS less accurate (AUC 0.578) than the other two (AUC 0.76 and 0.73, p < 0.02) to discriminate segments with LGE.
Conclusions: We confirm good agreement of CMR FT and little intervendor difference for GLS and GCS evaluation, with variable agreement for GRS. For regional strain evaluation, intervendor difference was larger, especially for RS, and the diagnostic performance varied more substantially among different vendors for regional strain analysis.
Keywords: Feature tracking; Magnetic resonance imaging; Strain; Tagging.
Conflict of interest statement
None.
Figures


References
-
- Farsalinos KE, Daraban AM, Unlu S, Thomas JD, Badano LP, Voigt JU. Head-to-head comparison of global longitudinal strain measurements among nine different vendors: the EACVI/ASE Inter-Vendor Comparison Study. J Am Soc Echocardiography. 2015;28(10):1171–81,e2. doi: 10.1016/j.echo.2015.06.011. - DOI - PubMed
-
- Risum N, Ali S, Olsen NT, Jons C, Khouri MG, Lauridsen TK, et al. Variability of global left ventricular deformation analysis using vendor dependent and independent two-dimensional speckle-tracking software in adults. J Am Soc Echocardiography. 2012;25(11):1195–203. doi: 10.1016/j.echo.2012.08.007. - DOI - PubMed
Publication types
MeSH terms
Substances
LinkOut - more resources
Full Text Sources
Other Literature Sources
Miscellaneous
