

Characterizing environmental geographic inequalities using an integrated exposure assessment
- PMID: 33980260
- PMCID: PMC8117491
- DOI: 10.1186/s12940-021-00736-9
Characterizing environmental geographic inequalities using an integrated exposure assessment
Abstract
Background: At a regional or continental scale, the characterization of environmental health inequities (EHI) expresses the idea that populations are not equal in the face of pollution. It implies an analysis be conducted in order to identify and manage the areas at risk of overexposure where an increasing risk to human health is suspected. The development of methods is a prerequisite for implementing public health activities aimed at protecting populations.
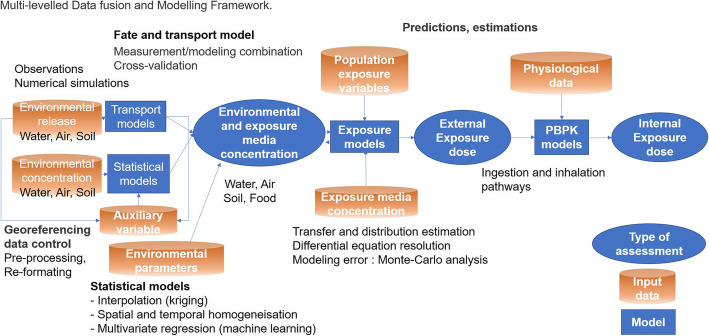
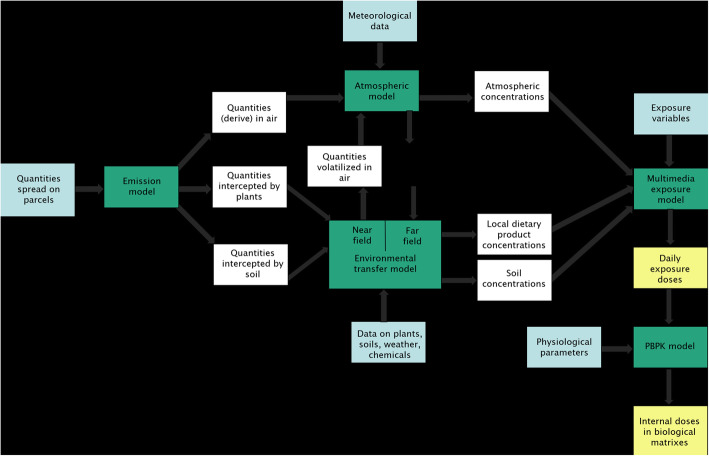
Methods: This paper presents the methodological framework developed by INERIS (French National Institute for Industrial Environment and Risks) to identify a common framework for a structured and operationalized assessment of human exposure. An integrated exposure assessment approach has been developed to integrate the multiplicity of exposure pathways from various sources, through a series of models enabling the final exposure of a population to be defined.
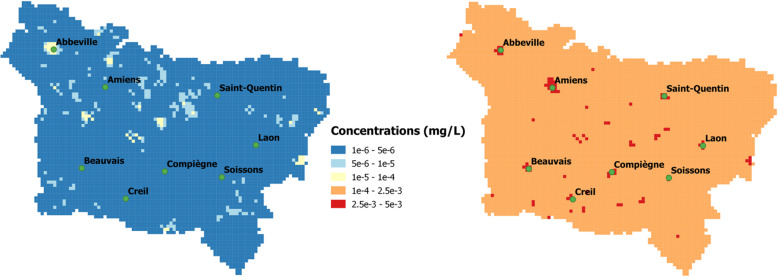
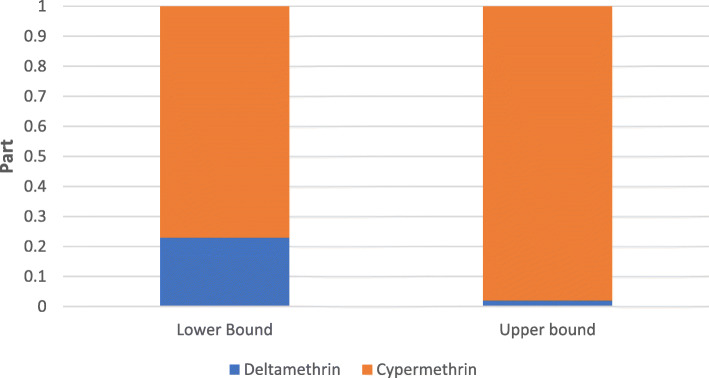
Results: Measured data from environmental networks reflecting the actual contamination of the environment are used to gauge the population's exposure. Sophisticated methods of spatial analysis are applied to include additional information and take benefit of spatial and inter-variable correlation to improve data representativeness and characterize the associated uncertainty. Integrated approaches bring together all the information available for assessing the source-to-human-dose continuum using a Geographic Information System, multimedia exposure and toxicokinetic model.
Discussion: One of the objectives of the integrated approach was to demonstrate the feasibility of building complex realistic exposure scenarios satisfying the needs of stakeholders and the accuracy of the modelling predictions at a fine spatial-temporal resolution. A case study is presented to provide a specific application of the proposed framework and how the results could be used to identify an overexposed population.
Conclusion: This framework could be used for many purposes, such as mapping EHI, identifying vulnerable populations and providing determinants of exposure to manage and plan remedial actions and to assess the spatial relationships between health and the environment to identify factors that influence the variability of disease patterns.
Keywords: Exposure; Inequities; Integrated; Modeling; Spatial.
Conflict of interest statement
The authors declare that they have no competing interests.
Figures
References
-
- WHO Regional Office for Europe . Environmental health inequities in Europe: assessment report. Copenhagen: WHO Regional office for Europe; 2012.
-
- Bulle C, Margni M, Kashef-Haghighi S, Boulay AM, Bourgault G, De Bruille V, et al. IMPACT world+: a globally regionalized life cycle impact assessment method. Int J Life Cycle Assess 2019;1–22. 10.1007/s11367-019-01583-0, 24, 9.
Publication types
MeSH terms
Substances
Associated data
LinkOut - more resources
Full Text Sources
Other Literature Sources
