. 2021 May 12;40(1):166.
doi: 10.1186/s13046-021-01965-z.

MYLK4 promotes tumor progression through the activation of epidermal growth factor receptor signaling in osteosarcoma

Affiliations

MYLK4 promotes tumor progression through the activation of epidermal growth factor receptor signaling in osteosarcoma

Mengkai Yang et al. J Exp Clin Cancer Res. .

Abstract

Background: Osteosarcoma (OS) is the most common primary bone cancer in adolescents and lung metastasis is the leading cause of death in patients with OS. However, the molecular mechanisms that promote OS growth and metastasis remain unknown.

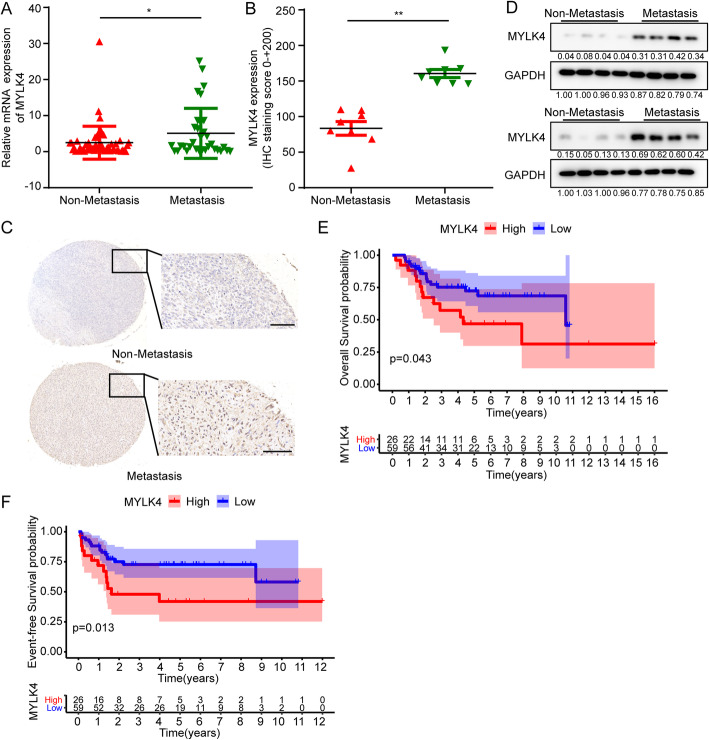
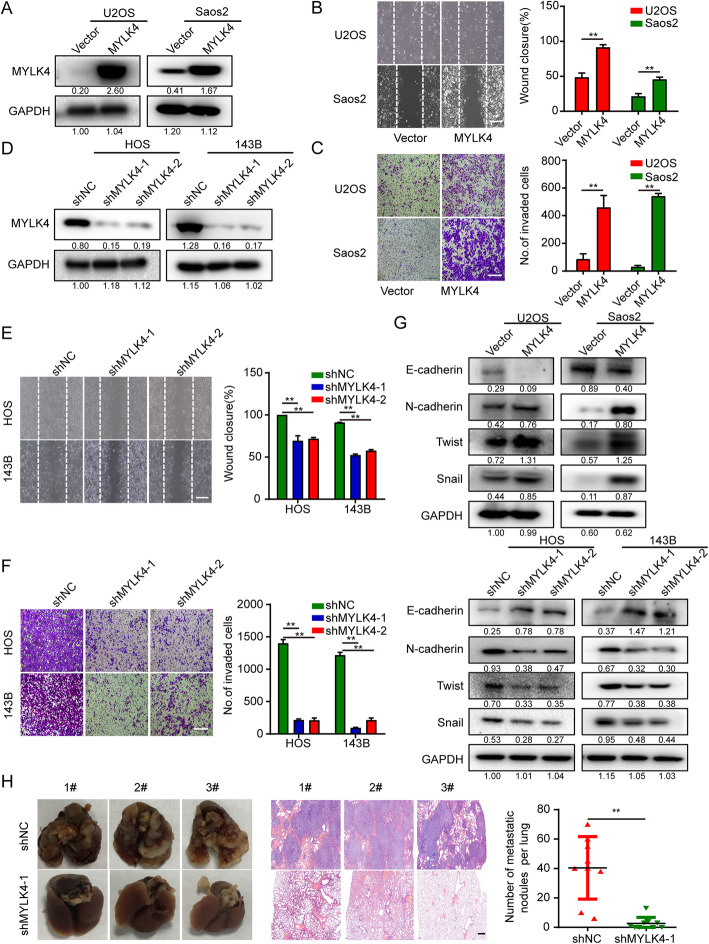
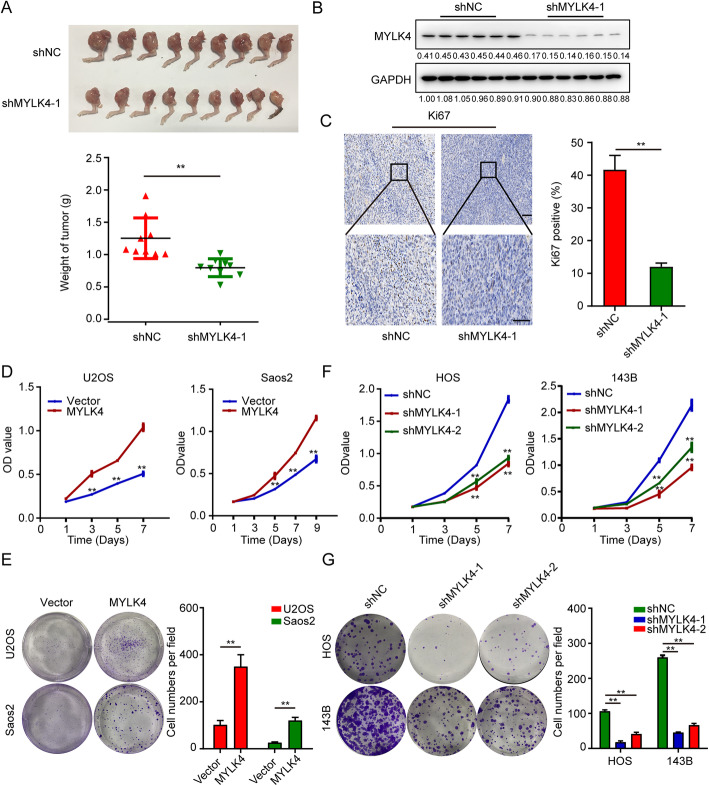
Methods: We investigated the expression of myosin light chain kinase family members between metastasis and non-metastasis patients in the TARGET database and ensured that only myosin light chain kinase family member 4 (MYLK4) had higher expression in metastatic osteosarcoma patients. Then we confirmed the results by immunohistochemistry (IHC) and Western blotting (WB) of OS tissues. The effect of MYLK4 on the metastasis and proliferation of OS cells was investigated by wound healing, Transwell and colony-formation assays. Mass spectrum analysis was used to ensure the new binding protein of MYLK4. Tissue microarrays analysis was used to show the correlation between MYLK4 and pEGFR (Y1068). A series of in vivo experiments were conducted to reveal the mechanisms by which MYLK4 modulated the metastasis and proliferation of OS.

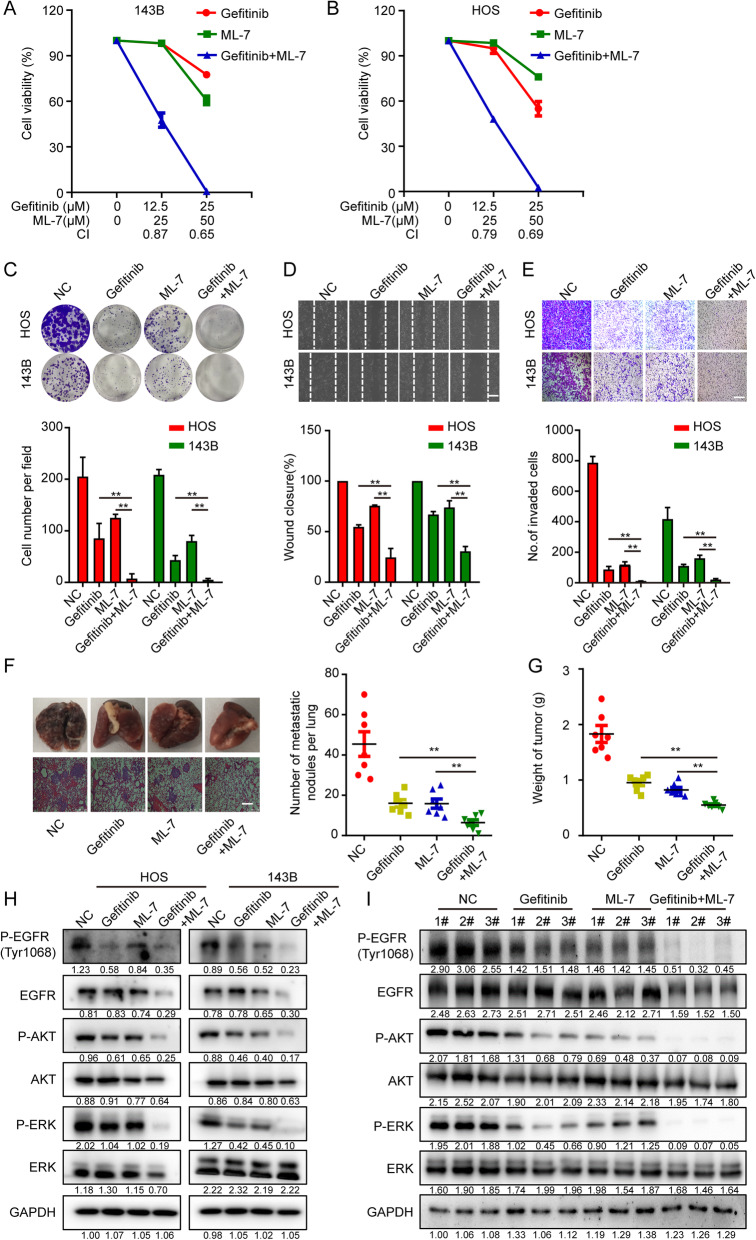
Results: Myosin Light Chain Kinase Family Member 4 (MYLK4) was significantly upregulated in metastatic human OS tissues. Growth and metastasis of OS could be accelerated by MYLK4 overexpression, whereas silencing MYLK4 expression resulted in decreased cell growth and metastasis. Mechanistically, mass spectrum analysis showed that MYLK4 interacted with the epidermal growth factor receptor (EGFR) in osteosarcoma cells and promoted growth and metastasis via the EGFR signaling pathway. Tissue microarrays analysis also showed that MYLK4 expression had a positive correlation with the expression of pEGFR (Y1068). Moreover, the EGFR inhibitor gefitinib could partially reverse the effect of cell proliferation and metastasis caused by MYLK4 overexpression. Importantly, the combination of MYLK4 and EGFR inhibitors had synergistic effects on growth and metastasis of OS in vitro and in vivo.

Conclusion: Our results indicate that MYLK4 promotes OS growth and metastasis by activating the EGFR signaling pathway and can be a novel therapeutic target for the treatment of OS patients.

Keywords: Epidermal growth factor receptor; Growth; MYLK4; Metastasis; Osteosarcoma.


Conflict of interest statement

The authors declare no conflict of interest.

Figures

Fig. 1
Fig. 1
MYLK4 is upregulated in metastatic human OS tissues. a The expression of MYLK4 in non-metastasis and metastasis OS samples in TARGET database. Statistically significant differences (t-test), *P < 0.05. b Immunohistochemistry analyses of MYLK4 expression levels in 8 paired metastatic human OS and non-metastatic human OS tissues. Statistically significant differences (t-test), **P < 0.01. c Representative immunohistochemical assays of MYLK4 expression in metastatic human OS (down) and non-metastatic human OS tissues (up). d Western blot analysis of MYLK4 expression in metastatic human OS compared with non-metastatic human OS tissues. e-f KM survival curves for overall survival and event-free survival of osteosarcoma patients from MYLK4-high and MYLK4-low groups
Fig. 2
Fig. 2
MYLK4 promotes osteosarcoma cell metastasis in vivo and in vitro. a The MYLK4 overexpression effects were confirmed by western blotting. b The effect of MYLK4 overexpression on OS cell migration was assessed by a wound healing assay. Representative images of migration were shown in the left panel. The degrees to which the wounds healed in the indicated groups were shown in the histogram. The bars indicate the mean ± s.d. Statistically significant differences (t-test), **P < 0.01, Scale bars = 250 μm. c The effect of MYLK4 overexpression on OS cell invasion was assessed by a transwell assay (left panel). The relative proportions of invading cells were shown in the histogram. The bars indicate the mean ± s.d. Statistically significant differences (t-test), **P < 0.01, Scale bars = 200 μm. d The MYLK4 knockdown effects were confirmed by western blotting. e The effect of MYLK4 knockdown on OS cell migration was assessed by a wound healing assay. Representative images of migration were shown in the left panel. The degrees to which the wounds healed in the indicated groups were shown in the histogram. The bars indicate the mean ± s.d. Statistically significant differences (t-test), **P < 0.01, Scale bars = 250 μm. f The effect of MYLK4 knockdown on OS cell invasion was assessed by a transwell assay (left panel). The relative proportions of invading cells were shown in the histogram. The bars indicate the mean ± s.d. Statistically significant differences (t-test), **P < 0.01, Scale bars = 200 μm. g The expression of EMT markers was detected by western blotting in MYLK4 over-expression and MYLK4-knockdown OS cells. h The number of lung metastasis nodules formed by MYLK4-knockdown 143B cells and control cells in orthotopic osteosarcoma implanted mice was shown in the right panel. Statistically significant differences (t-test), **P < 0.01. Representative images of lung morphology and lung metastatic nodules formed by MYLK4-knockdown 143B cells and control cells were shown in the left panel. Corresponding HE staining was shown in the middle panel. Scale bars = 100 μm
Fig. 3
Fig. 3
MYLK4 promotes osteosarcoma cell proliferation. a Osteosarcoma tissues from mice with tumor xenografts inoculated with MYLK4-knockdown 143B cells. The weight of osteosarcoma samples was shown in the down panel. Statistically significant differences (t-test), **P < 0.01. b Western blotting were performed to detect the shRNA interference efficiency in vivo. c The expression of Ki67 was detected by IHC in orthotopic OS implanted-mice tumor tissues formed by MYLK4-knockdown 143B cells and control cells. The results of Ki67 positive (%) were shown in the right panel. The bars indicate the mean ± s.d. Statistically significant differences (t-test), **P < 0.01, Scale bars = 100 μm. d The effect of MYLK4 overexpressing on OS cell proliferation was assessed by the CCK8 assay. The bars indicate the mean ± s.d. Statistically significant differences (t-test), **P < 0.01. e The effect of MYLK4 overexpression on colony formation in OS cells. Representative images of colony formation were shown in the left panel. The numbers of cells in the indicated groups are shown in the histogram. The bars indicate the mean ± s.d. Statistically significant differences (t-test), **P < 0.01. f Cell proliferation was measured by CCK8 assay with/without MYLK4 knockdown in OS cells. The bars indicate the mean ± s.d. Statistically significant differences (t-test), **P < 0.01. g The effect of MYLK4 knockdown on colony formation in OS cells. Representative images of colony formation were shown in the left panel. The numbers of cells in the indicated groups were shown in the histogram. The bars indicate the mean ± s.d. Statistically significant differences (t-test), **P < 0.01
Fig. 4
Fig. 4
MYLK4 interacts with EGFR. a Silver staining of whole cell lysates (WCL) and immunoprecipitates (IP) of FLAG-MYLK4 143B cells. The indicated bands were sequenced by mass spectrometry (MS) analysis. b Secondary peptide structure of EGFR acquired by MS. c 143B cells were transfected with Flag-tagged MYLK4 construct and the interaction between exogenous MYLK4 and EGFR was detected by IP and immunoblotting (IB). d Interaction between endogenous MYLK4 and EGFR by IP analyses in 143B cells. e HEK-293 T cells were cotransfected with Flag-tagged MYLK4 and HIS-tagged EGFR constructs, and the interaction between exogenous MYLK4 and EGFR was detected by IP and IB
Fig. 5
Fig. 5
MYLK4 promotes EGFR phosphorylation and the downstream signaling pathway. a The expression of p-EGFR, p-AKT and p-ERK was detected by western blotting in MYLK4-overexpressing cells. b The expression of p-EGFR, p-AKT and p-ERK was detected by western blotting in MYLK4-knockdown cells. c The expressions of p-EGFR, p-AKT and p-ERK were detected by western blotting with/without EGF stimulation for 15 min. d The expression of p-EGFR was detected by western blotting with EGF (50 ng/ml) stimulation for different time period respectively in MYLK4-knockdown and the control cells. e The expressions of MYLK4 and P-EGFR (Y1068) expression in human OS tissues were detected by IHC assay. Scale bars = 200 μm. f The score of MYLK4 and P-EGFR (Y1068)-positive staining were quantified and the Spearman correlation was performed
Fig. 6
Fig. 6
The inhibitor of MYLK4 shows synergistic effect with the EGFR inhibitor in OS in vitro and in vivo. a 143B and b HOS cells treated with Gefitinib alone, ML-7 alone, or Gefitinib/ML-7 in combination. Cell viability was determined by CCK-8 assay. Combination index (CI) was calculated by using CompuSyn software. c Divide cells into four groups, Control group, Gefitinib alone group, ML-7 alone group and Gefitinib/ML-7 in combination group. Colony-formation assay was carried out in those four groups. Representative images of colony formation are shown in the upper panel. The numbers of cells in the indicated groups were shown in the histogram. The bars indicate the mean ± s.d. Statistically significant differences (t-test), **P < 0.01. d Wound healing assay was carried out in those four groups. Representative images of migration were shown in the upper panel. The degrees to which the wounds healed was shown in the histogram. The bars indicate the mean ± s.d. Statistically significant differences (t-test), **P < 0.01, Scale bars = 250 μm. e Transwell assay was carried out in those four groups. Representative images of invasion were shown in the upper panel. The proportions of invading cells were shown in the histogram. The bars indicate the mean ± s.d. Statistically significant differences (t-test), **P < 0.01, Scale bars = 200 μm. f The number of lung metastasis nodules formed by 143B cells in orthotopic osteosarcoma implanted mice was shown in the right panel, the mice were divided into four groups: mice treated with dmso only, mice treated with Gefitinib only, mice treated with ML-7 only and mice treated with Gefitinib plus ML-7. Statistically significant differences (t-test), **P < 0.01. Representative images of lung morphology and lung metastatic nodules in the four groups were shown in the left panel. Scale bars = 250 μm. g Tumor weights of the tumors in the four groups were recorded. Statistically significant differences (t-test), **P < 0.05. h The expressions of p-EGFR, p-AKT and p-ERK in vitro were measured by western blotting in different groups. i The expressions of p-EGFR, p-AKT and p-ERK in tumor xenograft tissues were measured by western blotting

Similar articles

Cited by

References

    1. Rosenberg AE. WHO classification of soft tissue and bone, fourth edition: summary and commentary. Curr Opin Oncol. 2013;25:571–573. doi: 10.1097/01.cco.0000432522.16734.2d. - DOI - PubMed
    1. Tang N, Song WX, Luo J, Haydon RC, He TC. Osteosarcoma development and stem cell differentiation. Clin Orthop Relat Res. 2008;466:2114–2130. doi: 10.1007/s11999-008-0335-z. - DOI - PMC - PubMed
    1. Siclari VA, Qin L. Targeting the osteosarcoma cancer stem cell. J Orthop Surg Res. 2010;5:78. doi: 10.1186/1749-799X-5-78. - DOI - PMC - PubMed
    1. Pires E, Perry SV, Thomas MA. Myosin light-chain kinase, a new enzyme from striated muscle. FEBS Lett. 1974;41:292–296. doi: 10.1016/0014-5793(74)81232-9. - DOI - PubMed
    1. Kamm KE, Stull JT. Signaling to myosin regulatory light chain in sarcomeres. J Biol Chem. 2011;286:9941–9947. doi: 10.1074/jbc.R110.198697. - DOI - PMC - PubMed