. 2021 May 12;21(1):141.
doi: 10.1186/s12906-021-03310-5.

Echinacea purpurea (L.) Moench treatment of monocytes promotes tonic interferon signaling, increased innate immunity gene expression and DNA repeat hypermethylated silencing of endogenous retroviral sequences

Affiliations

Echinacea purpurea (L.) Moench treatment of monocytes promotes tonic interferon signaling, increased innate immunity gene expression and DNA repeat hypermethylated silencing of endogenous retroviral sequences

Ken Declerck et al. BMC Complement Med Ther. .

Abstract

Background: Herbal remedies of Echinacea purpurea tinctures are widely used today to reduce common cold respiratory tract infections.

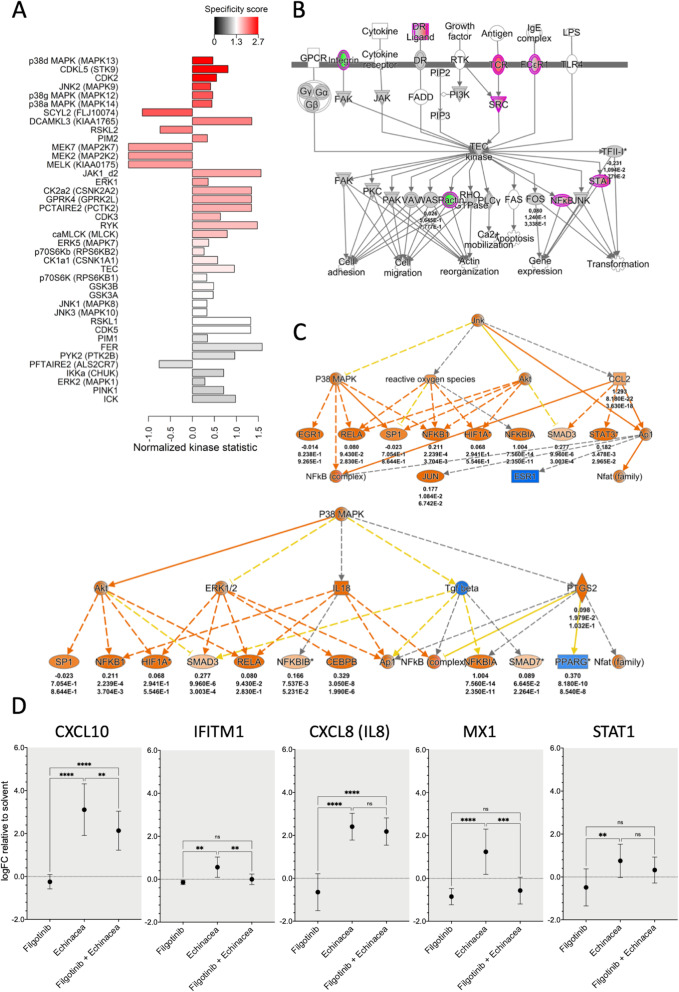
Methods: Transcriptome, epigenome and kinome profiling allowed a systems biology level characterisation of genomewide immunomodulatory effects of a standardized Echinacea purpurea (L.) Moench extract in THP1 monocytes.

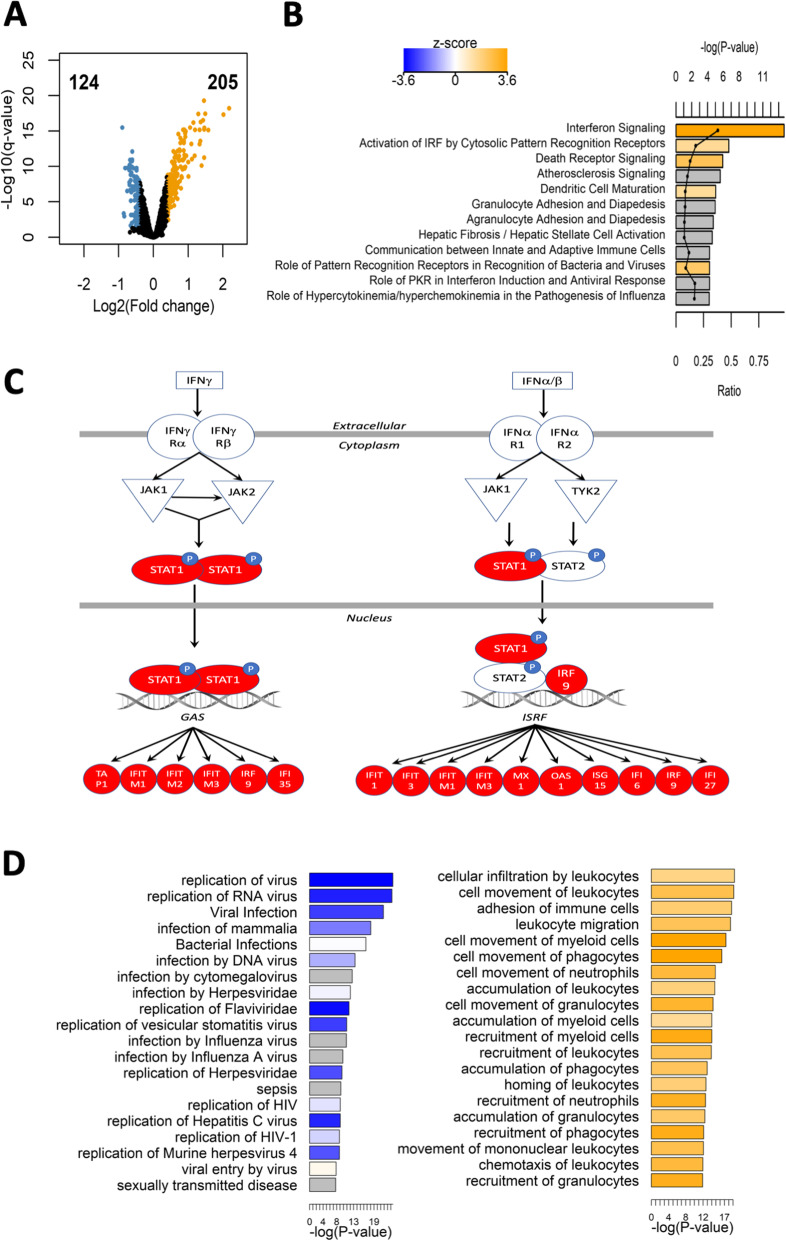
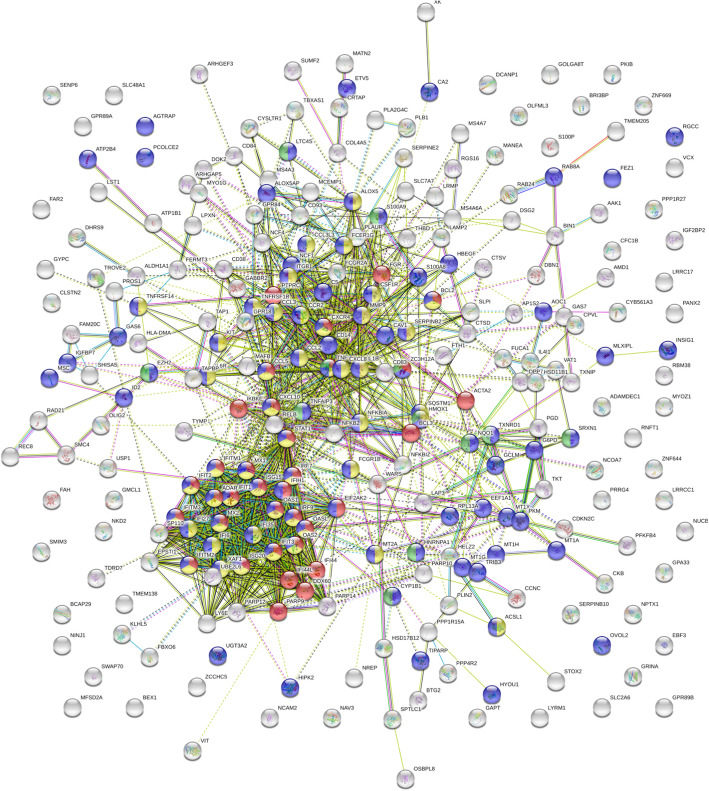
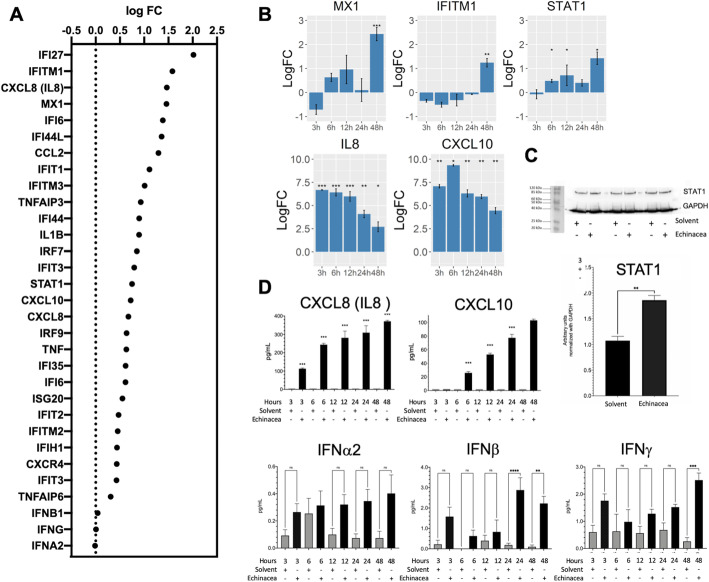
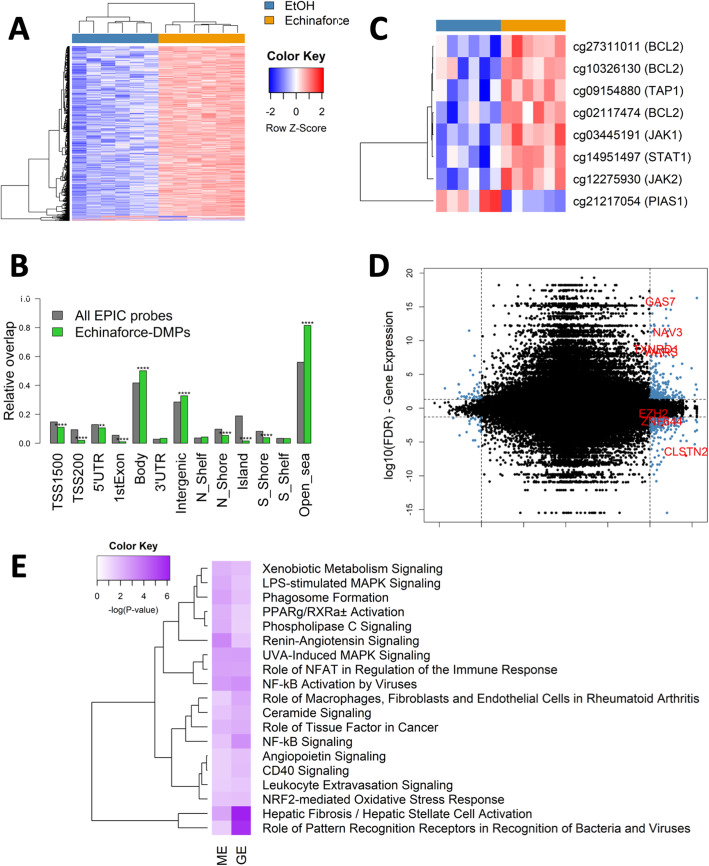
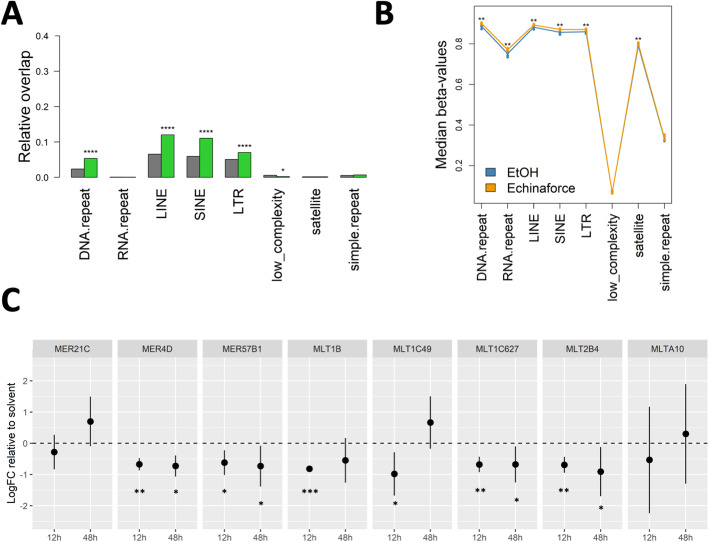
Results: Gene expression and DNA methylation analysis revealed that Echinaforce® treatment triggers antiviral innate immunity pathways, involving tonic IFN signaling, activation of pattern recognition receptors, chemotaxis and immunometabolism. Furthermore, phosphopeptide based kinome activity profiling and pharmacological inhibitor experiments with filgotinib confirm a key role for Janus Kinase (JAK)-1 dependent gene expression changes in innate immune signaling. Finally, Echinaforce® treatment induces DNA hypermethylation at intergenic CpG, long/short interspersed nuclear DNA repeat elements (LINE, SINE) or long termininal DNA repeats (LTR). This changes transcription of flanking endogenous retroviral sequences (HERVs), involved in an evolutionary conserved (epi) genomic protective response against viral infections.

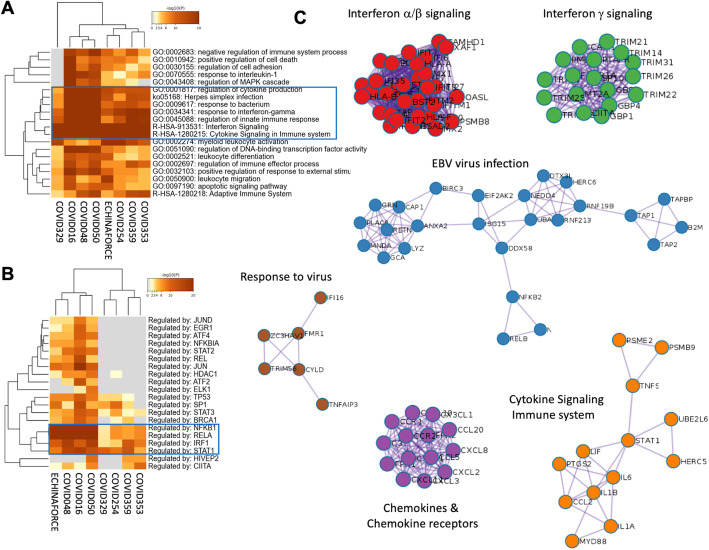
Conclusions: Altogether, our results suggest that Echinaforce® phytochemicals strengthen antiviral innate immunity through tonic IFN regulation of pattern recognition and chemokine gene expression and DNA repeat hypermethylated silencing of HERVs in monocytes. These results suggest that immunomodulation by Echinaforce® treatment holds promise to reduce symptoms and duration of infection episodes of common cold corona viruses (CoV), Severe Acute Respiratory Syndrome (SARS)-CoV, and new occurring strains such as SARS-CoV-2, with strongly impaired interferon (IFN) response and weak innate antiviral defense.


Conflict of interest statement

Author Andreas Suter was employed by the company A. Vogel Bioforce AG, Roggwil, Switzerland. The remaining authors declare that the research was conducted in the absence of any commercial or financial relationships that could be construed as a potential conflict of interest.

Figures

Fig. 1
Fig. 1
Echinaforce® induced gene expression activates innate immunity pathways a Volcano plot showing the upregulated genes (orange color, number of probes: 205), and downregulated genes (blue color, number of probes: 124) upon treatment of THP1 cells for 48 h with Echinaforce® tincture (1%). b Top enriched IPA canonical pathways. Bars are colored by activation z-score. c IPA interferon signaling pathway with Echinaforce®-induced upregulated genes colored in red and green, respectively. d Top enriched IPA infectious diseases and IPA immune trafficking disease and biological function. Bar charts are colored by activation z-score
Fig. 2
Fig. 2
Protein-protein-interaction network analysis of Echinaforce® treatment responsive genes. STRING based protein-protein-interaction network analysis of differentially expressed genes of THP1 cells treated for 48 h with Echinaforce® tincture (1%) shows a strong network overlap of the cellular response to a chemical stimulus (FDR 2,91 E-18) (blue colored dots-pies), cellular defense to virus (FDR 5,54 E-19) (red colored dots-pies) and innate immune cytokine response (FDR 2,23 E-18) (yellow colored dots-pies) (see also, supplementary Table 4)
Fig. 3
Fig. 3
Induction of innate immune response by Echinaforce®. A) transcriptome gene expression changes IFN, innate immunity, chemokine, cytokine genes (logFC) B) transcription levels of MX1, IFITM1, STAT1, CXCL8(IL8) and CXCL10 genes at different time points, the bars represent the mean logFC values + − SD compared to the solvent control. *: P ≤ 0.05, ** P: ≤ 0.01, *** P: ≤ 0.001 and **** P: ≤ 0.0001. C) Blots showing protein levels of STAT1 and GAPDH (as reference protein) in 20 μg protein of cell lysates after 48 h stimulation with solvent (Ethanol) or Echinaforce®; Bars graph represents the density of each blot band for STAT-1 relative to the band density of GAPDH (reference protein). Band intensities were calculated using imageJ software. Statistical differences between solvent and Echinacea treated samples were assayed using a paired t-test where p value < 0.05 was considered statistically significant. (***) means p value < 0.01, (*): P ≤ 0.05, (**): P ≤ 0.01, (***): P ≤ 0.001 and (****): P ≤ 0.0001. D) Expression levels of IL8, CXCL10, IFNα2, IFNβ, IFNγ chemokines assayed by ELISA and MSD-U-Plex immunoassays in supernatants collected after Echinaforce® and solvent (Ethanol) stimulation. (***) means p value < 0.01, (*): P ≤ 0.05, (**): P ≤ 0.01, (***): P ≤ 0.001 and (****): P ≤ 0.0001, p-values after a paired t-test where p value < 0.05 was considered statistically significant
Fig. 4
Fig. 4
Systems level metascape analysis of transcriptome profiles of Echinaforce treated THP1 monocytes and blood PBMC samples of SARS-CoV2 patients. a Metascape enrichment analysis of statistically enriched ontology terms (GO/KEGG terms, canonical pathways, hall mark gene sets). b Metascape enrichment analysis of all statistically enriched TF-target interaction networks c GO enrichment analysis of all protein-protein interaction networks to assign biological function to each MCODE sub-protein-networks
Fig. 5
Fig. 5
Activation of JAK1 and MAPK kinases by Echinaforce®. a Kinome activity profiling on THP1 cell lysates, following 15 min treatment with Echinaforce® tincture (1%). Showing predicted upstream kinases. Bars are colored by specificity score with red meaning the highest score. The direction of the bars represents the normalized kinase statistics. A positive kinase statistic means a higher activity in Echinaforce® treated samples. b TEC signaling pathway as predicted by IPA software showing the up- and down-regulated genes (colored in red and green, respectively), after Echinaforce® treatment. Numbers under genes names represent (from up to down): the log fold changes, p-values and adjusted p-values after a paired t-test comparing gene expression in cells stimulated with Echinaforce® and solvent (control). c) IPA-enriched P38 MAPK and JNK pathways upstream regulators. Genes colored in orange are predicted to be activated, while genes colored in blue are predicted to be inhibited. Numbers under gene names represent (from up to down): the log fold changes, p-values and adjusted p-values after a paired t-test comparing gene expression in cells stimulated with Echinaforce® and solvent (control). d Effect of JAK1 inhibition on transcript expression of interferon pathway related genes. THP1 cells were either treated during 48 h with the JAK1 inhibitor Filgotinib alone or in combination with Echinaforce® (n = 7). Mean expression LogFC change relative to solvent control is represented together with 95% confidence interval. *: P ≤ 0.05, ** P: ≤ 0.01, *** P: ≤ 0.001
Fig. 6
Fig. 6
Echinaforce® treatment leads to global hypermethylation of CpG-poor gene bodies. a Heatmap showing the methylation values of differentially methylated probes upon treatment of THP1 cells for 48 h with Echinaforce® tincture (1%). Solvent (EtOH) controls are colored in blue and Echinaforce®-treated cells in orange. b Genomic enrichment of DMPs in different genomic regions. c CpG probes located in genes of the interferon signaling pathway which were differentially methylated (FDR < 0.1). * P ≤ 0.05, ** P ≤ 0.01, *** P ≤ 0.001, **** P ≤ 0.0001. d Starburst plot showing the genes both differentially expressed and differentially methylated. Each CpG-probe was mapped to its corresponding gene and the -log10(FDR) from the gene expression and DNA methylation analysis is displayed. The –log10(FDR) values of genes or CpG-probes with a negative LogFC or delta beta was multiplied by − 1 leading to positive values when logFC or delta beta was positive and negative values when logFC or delta beta was negative. CpG-probe – gene pairs which were differentially expressed (FDR < 0.05) and differentially methylated (FDR < 0.1) were colored in blue. The CpG-probe – gene pairs of which the absolute delta beta was higher than 0.05 and the absolute logFC higher than 0.4 were colored in red. e The IPA canonical pathways which were both significantly enriched in the gene expression and DNA methylation analysis
Fig. 7
Fig. 7
Echinaforce® treatment leads to global hypermethylation of intergenic repeat elements. a Genomic enrichment of DMPs in different repeat elements. b Global DNA methylation changes in different repeat elements. c HERV qPCR gene expression. THP1 cells were with Echinaforce® at 12 and 48 h (n = 3). Mean LogFC change relative to solvent control is represented together with 95% confidence interval. *: P ≤ 0.05, ** P: ≤ 0.01, *** P: ≤ 0.001 and **** P: ≤ 0.0001

Similar articles

Cited by

References

    1. Barnes J, et al. Echinacea species (Echinacea angustifolia (DC.) Hell., Echinacea pallida (Nutt.) Nutt.,Echinacea purpurea (L.) Moench): a review of their chemistry, pharmacology and clinical properties. J Pharm Pharmacol. 2005;57(8):929–954. doi: 10.1211/0022357056127. - DOI - PubMed
    1. Barrett B. Medicinal properties of Echinacea: a critical review. Phytomedicine. 2003;10(1):66–86. doi: 10.1078/094471103321648692. - DOI - PubMed
    1. Manayi A, Vazirian M, Saeidnia S. Echinacea purpurea: pharmacology, phytochemistry and analysis methods. Pharmacogn Rev. 2015;9(17):63–72. doi: 10.4103/0973-7847.156353. - DOI - PMC - PubMed
    1. Karsch-Volk M, Barrett B, Linde K. Echinacea for preventing and treating the common cold. JAMA. 2015;313(6):618–619. doi: 10.1001/jama.2014.17145. - DOI - PMC - PubMed
    1. Binns SE, Livesey JF, Arnason JT, Baum BR. Phytochemical variation in echinacea from roots and flowerheads of wild and cultivated populations. J Agric Food Chem. 2002;50(13):3673–3687. doi: 10.1021/jf011439t. - DOI - PubMed