. 2021 May 12;7(20):eabf0677.
doi: 10.1126/sciadv.abf0677. Print 2021 May.

Mucosal immunity-mediated modulation of the gut microbiome by oral delivery of probiotics into Peyer's patches

Affiliations

Mucosal immunity-mediated modulation of the gut microbiome by oral delivery of probiotics into Peyer's patches

Sisi Lin et al. Sci Adv. .

Erratum in

Abstract

Methods capable of maintaining gut microbiota homeostasis to prevent bacterial translocation and infection under external threats are critical for multiple facets of human health but have been rarely reported. Here, we describe the elicitation of mucosal immunity to modulate the gut microbiota by oral delivery of living probiotics into Peyer's patches. Probiotics are individually camouflaged within a yeast membrane, on which the embedded β-glucan can facilitate the phagocytosis of microfold cells that locate in the intestinal epithelium. The delivery of probiotics into lymphoid follicles after oral ingestion promotes robust mucosal immune responses and notably upgrades the production of secretory immunoglobulin A. The provoked immunity positively regulates the gut microflora, which, in turn, retains gut homeostasis and provides defense against environmental attacks. In two murine models of gut barrier impairment, oral administration with camouflaged probiotics effectively prevents the breakdown of intestinal barrier and evidences limited bacterial translocation and systemic inflammation.


Figures

Fig. 1
Fig. 1. Schematic illustration of mucosal immunity–mediated modulation of the gut microbiome by oral delivery of probiotics into PPs.
(A) Preparation of EcN@YM by extruding probiotic EcN with extracted YMs through a polycarbonate porous membrane with an average pore size of 1 μm. (B) YMs enhance both the resistance of probiotics against gastric insults and the delivery of living bacteria into PPs through M cells, which promote robust mucosal immune responses that can positively regulate the microbiome and maintain gut homeostasis.
Fig. 2
Fig. 2. Preparation and characterization of EcN@YM.
(A) LSCM images of EcN@YM. The red channel shows EcN expressing mCherry, and the blue channel indicates YMs stained with calcofluor-white. Scale bars, 20 μm. (B) Typical TEM images of EcN and EcN@YM. Scale bars, 2 μm. (C) Zeta potentials of EcN, YMs, and EcN@YM, respectively. **P < 0.01. (D and E) Flow cytometric analysis of EcN and EcN@YM. YMs were labeled with fluorescein isothiocyanate (FITC). Error bars represent SD (n = 3). (F) Bacterial viabilities of EcN and EcN@YM, respectively. The viability was evaluated by measuring optical density at 450 nm (OD450) at 1-hour interval using CCK-8 assay. (G) Level of β-glucan on YMs under different treatments including glass bead broken only (YMs-BRO), glass bead broken and incubation with SGF for 1 hour (YMs-SGF–1 h) or 4 hours (YMs-SGF–4 h), and glass bead broken and treatment with SIF for 1 hour (YMs-SIF–1 h) or 4 hours (YMs-SIF–4 h). FSC-A, forward scatter area; SSC-A, side scatter area.
Fig. 3
Fig. 3. Stability of EcN@YM in gastrointestinal environments.
(A) Level of β-glucan on EcN@YM under different treatments including incubation with SGF for 1 hour (EcN@YM-SGF–1 h) or 4 hours (EcN@YM-SGF–4 h) and SIF for 1 hour (EcN@YM-SIF–1 h) or 4 hours (EcN@YM-SIF–4 h), respectively. (B to D) Survivals of EcN (orange circle) and EcN@YM (blue triangle) after treatment with (B) SGF, (C) cholic acid, or (D) SIF (n = 3). (E to H) Counts of bacteria in the (E) stomach, (F) small intestine, (G) cecum, and (H) colon at the indicated time points after gavage of 1 × 10⁸ CFUs of EcN or EcN@YM (n = 4). (I to L) Total amounts of bacteria in the gastrointestinal tract at (I) 1, (J) 2, (K) 3, and (L) 4 hours after gavage. Error bars represent SD, *P < 0.05.
Fig. 4
Fig. 4. Uptake of EcN@YM by M cells.
(A and B) Amount of EcN in the basolateral chamber translocated from the apical side of Transwell inserts after coculture with M cells for (A) 3 and (B) 6 hours, respectively. (C) Counts of EcN in PPs at 1.5 hours after lumen injection of PBS, EcN, and EcN@YM, respectively. Mice were anesthetized, and the gut loop containing PPs was injected with 50 μl of PBS and 1 × 10⁸ CFUs of EcN or EcN@YM. (D) Representative LSCM images of EcN expressing mCherry (red) in PPs collected at 1.5 hours after lumen injection. (E to G) Counts of EcN in PPs at (E) 4 hours, (F) 7 days, and (G) 3 weeks after treatment. Mice were daily gavaged with 5 × 10⁷ CFUs of EcN or EcN@YM. Error bars represent SD (n = 3 to 5); *P < 0.05 and **P < 0.01.
Fig. 5
Fig. 5. Mucosal immune responses elicited by EcN@YM.
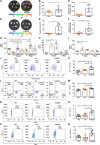
(A to F) Representative IVIS images, radiant fluorescence intensity, and bacterial counts of MLNs at (A to C) 4 hours and (D to F) 7 days after gavage of 5 × 10⁷ CFUs of EcN or EcN@YM. (G) Level of sIgA in the intestinal fluid after treatment with PBS, EcN, EcN@YM, and YMs, respectively. (H and I) Expression levels of (H) IL-6 and (I) TNF-α in plasma after treatment with PBS, EcN, and EcN@YM, respectively. (J to Q) Flow cytometric analysis and the percentages of (J and K) CD3+ T cells, (L and M) CD4+ T cells, (N and O) CD11c+ DCs, and (P and Q) IgA+ B cells in lymphocytes sampled from PPs after daily gavage of 0.2 ml of PBS and 5 × 10⁷ CFUs of EcN or EcN@YM for 7 days. T cells, DCs, and B cells were labeled with antibodies of anti–CD3-PerCP-Cy5.5/anti–CD4-FITC/anti–CD8–allophycocyanin (APC), anti–CD11c-FITC/anti–CD86-APC/anti–CD80–phycoerythrin (PE), and anti–CD45R/B220-PE-Cy7/anti–CD138-APC/anti–IgA-PE, respectively. Error bars represent SD (n = 3 to 5); *P < 0.05 and **P < 0.01.
Fig. 6
Fig. 6. Maintenance of the gut microbiome under external stimuli.
(A and B) Results of (A) principal coordinates analysis (PCoA) and (B) taxonomic analysis at the phylum level of the gut microbiota from the infected mice. Alpha diversity, which reflects the species richness of individual samples and the species diversity, was presented with ACE; beta diversity, which is used to compare the species diversity in community composition and structure between different groups, was analyzed with PCoA or nonmetric multidimensional scaling (NMDS). Mice were daily pretreated with PBS and 5 × 10⁷ CFUs of EcN or EcN@YM for 7 days and subsequently infected with 5 × 10⁷ CFUs of Salmonella. (C and D) Relative abundances of (C) Proteobacteria and (D) Bacteroidetes in the gut microflora. (E) Ratio of the relative abundance of Proteobacteria to Bacteroidetes. (F to H) Values of (F) ACE index, (G) NMDS, and (H) bacterial taxonomic analysis at the class level in mice after IM operation. Mice were daily pretreated with PBS and 5 × 10⁷ CFUs of EcN or EcN@YM for 7 days before the operation. Error bars represent SD (n = 4); *P < 0.05 and **P < 0.01.
Fig. 7
Fig. 7. Effect of EcN@YM on the prevention of intestinal barrier impairment in Salmonella infection.
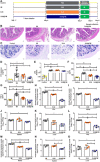
(A) Design of the animal study. After adaption raise for 7 days, mice were daily gavaged with 0.2 ml of PBS and 5 × 10⁷ CFUs of EcN or EcN@YM for 7 days and then administrated with 20 mg of streptomycin. Mice were orally dosed with 5 × 10⁷ CFUs of Salmonella, and samples were collected 3 days after infection. (B) Representative hematoxylin and eosin staining images of the cecum tissue. Scale bars, 50 μm. (C) Typical Alcian Blue (AB)/Periodic Acid-Schiff (PAS) staining images of goblet cells in the colon tissue. Scale bars, 50 μm. (D) Pathological scores based on the sums of epithelial integrity (pink), submucosa edema (gray), infiltration of inflammatory cells (orange), and goblet cell depletion (blue). (E) Intestinal permeability assessed by measuring FITC-dextran in plasma. (F to H) Levels of (F) LPS, (G) IL-6, and (H) TNF-α in plasma. (I to L) Counts of Salmonella in (I) PPs, (J) MLNs, (K) spleen, and (L) liver, respectively. Tissue samples were homogenized, spread onto LB agar plates, and incubated overnight at 37°C for bacterial counting. Error bars represent SD (n = 3 to 6); *P < 0.05 and **P < 0.01.
Fig. 8
Fig. 8. Effect of EcN@YM on the prevention of intestinal barrier impairment under IM.
(A) Design of the animal study. After adaption raise for 7 days, mice were daily dosed with 0.2 ml of PBS and 5 × 10⁷ CFUs of EcN or EcN@YM for 7 days and then subjected to IM operation. Samples were collected 24 hours after operation. (B) H&E staining images of the colon tissue. Scale bars, 50 μm. (C) AB/PAS staining images of goblet cells in the colon tissue. Scale bars, 50 μm. (D) Intestinal permeability assessed by measuring the level of FITC-dextran in plasma. (E to G) Levels of (E) LPS, (F) IL-6, and (G) TNF-α in plasma. (H to K) Counts of aerobic bacteria in (H) PPs, (I) MLNs, (J) spleen, and (K) liver, respectively. (L to O) Amounts of anaerobic bacteria in (L) PPs, (M) MLNs, (N) spleen, and (O) liver, respectively. Sampled tissues were homogenized, spread onto blood agar plates, and cultured overnight at 37°C under anaerobic conditions for bacterial counting. Error bars represent SD (n = 3 to 6); *P < 0.05 and **P < 0.01.

Similar articles

Cited by

References

    1. Gentile C. L., Weir T. L., The gut microbiota at the intersection of diet and human health. Science 362, 776–780 (2018). - PubMed
    1. Rinninella E., Raoul P., Cintoni M., Franceschi F., Miggiano G. A. D., Gasbarrini A., Mele M. C., What is the healthy gut microbiota composition? A changing ecosystem across age, environment, diet, and diseases. Microorganisms 7, 14 (2019). - PMC - PubMed
    1. Gu Y., Wang X., Li J., Zhang Y., Zhong H., Liu R., Zhang D., Feng Q., Xie X., Hong J., Ren H., Liu W., Ma J., Su Q., Zhang H., Yang J., Wang X., Zhao X., Gu W., Bi Y., Peng Y., Xu X., Xia H., Li F., Xu X., Yang H., Xu G., Madsen L., Kristiansen K., Ning G., Wang W., Analyses of gut microbiota and plasma bile acids enable stratification of patients for antidiabetic treatment. Nat. Commun. 8, 1785 (2017). - PMC - PubMed
    1. Roy S., Trinchieri G., Microbiota: A key orchestrator of cancer therapy. Nat. Rev. Cancer 17, 271–285 (2017). - PubMed
    1. Fujisaka S., Ussar S., Clish C., Devkota S., Dreyfuss J. M., Sakaguchi M., Soto M., Konishi M., Softic S., Altindis E., Li N., Gerber G., Bry L., Kahn C. R., Antibiotic effects on gut microbiota and metabolism are host dependent. J. Clin. Invest. 126, 4430–4443 (2016). - PMC - PubMed

Publication types