. 2021 Nov;11(11):2868-2883.
doi: 10.1158/2159-8290.CD-20-1793. Epub 2021 May 12.

Selective Requirement of MYB for Oncogenic Hyperactivation of a Translocated Enhancer in Leukemia

Affiliations

Selective Requirement of MYB for Oncogenic Hyperactivation of a Translocated Enhancer in Leukemia

Leonie Smeenk et al. Cancer Discov. 2021 Nov.

Abstract

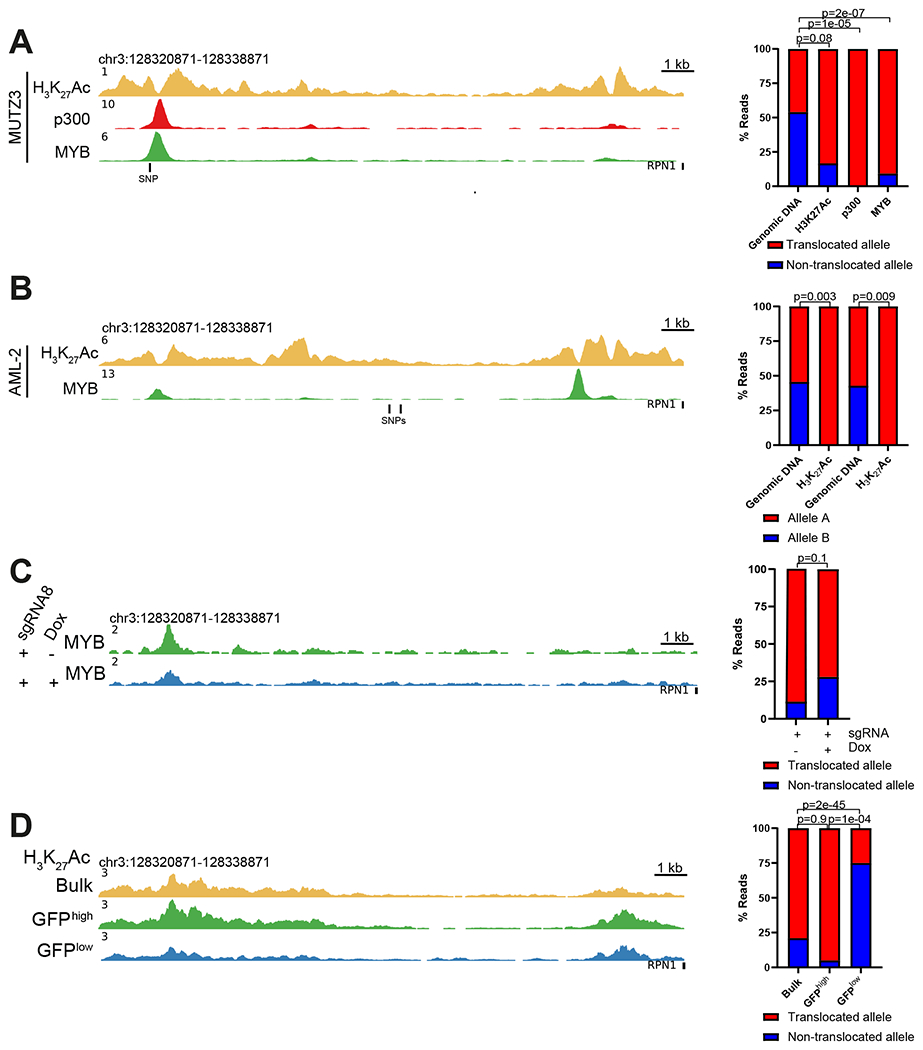
In acute myeloid leukemia (AML) with inv(3)(q21;q26) or t(3;3)(q21;q26), a translocated GATA2 enhancer drives oncogenic expression of EVI1. We generated an EVI1-GFP AML model and applied an unbiased CRISPR/Cas9 enhancer scan to uncover sequence motifs essential for EVI1 transcription. Using this approach, we pinpointed a single regulatory element in the translocated GATA2 enhancer that is critically required for aberrant EVI1 expression. This element contained a DNA-binding motif for the transcription factor MYB, which specifically occupied this site at the translocated allele and was dispensable for GATA2 expression. MYB knockout as well as peptidomimetic blockade of CBP/p300-dependent MYB functions resulted in downregulation of EVI1 but not of GATA2. Targeting MYB or mutating its DNA-binding motif within the GATA2 enhancer resulted in myeloid differentiation and cell death, suggesting that interference with MYB-driven EVI1 transcription provides a potential entry point for therapy of inv(3)/t(3;3) AMLs. SIGNIFICANCE: We show a novel paradigm in which chromosomal aberrations reveal critical regulatory elements that are nonfunctional at their endogenous locus. This knowledge provides a rationale to develop new compounds to selectively interfere with oncogenic enhancer activity.This article is highlighted in the In This Issue feature, p. 2659.


Conflict of interest statement

Conflict of interest disclosure

A patent application related to MYBMIM has been submitted by A.K. to the U.S. Patent and Trademark Office entitled “Agents and methods for treating CREB binding protein-dependent cancers” (application PCT/US2017/059579). A.K. received personal fees from Novartis and from Rgenta during the conduct of the study.

Figures

Figure 1.
Figure 1.
Expression of EVI1 in inv(3)/t(3;3) AML is reversible. A. Flow cytometric analysis of CD34- and CD15-stained inv(3;3) primary AML cells (AML-1) (left) and intracellular EVI1 staining in the gated fractions (right). B. Flow cytometric analysis of MUTZ3 cells stained with CD34 and CD15 (left) and intracellular EVI1 staining in the gated fractions (right). C. Bar plot showing relative expression of EVI1 in Transcripts Per Million (TPM) in sorted fractions of MUTZ3 cells. Error bars represent standard deviation of two biological replicates.
Figure 2.
Figure 2.
Generation of an EVI1-GFP inv(3) AML model. A. Schematic representation of EVI1-GFP knock-in with a T2A self-cleavage site in the MUTZ3 cells at the endogenous translocated EVI1 locus. B. Flow cytometric analysis of intracellular EVI1 after shRNA-mediated knockdown of EVI1 using two different shRNAs. The effects on EVI1 protein were measured 48 hours after transduction. Scrambled shRNAs were used as control. C. Flow cytometric analysis of GFP in the same experiment indicated in (B). D. Representative flow cytometric plot showing the effect of the −110kb GATA2 enhancer deletion in MUTZ3-EVI1-GFP cells (Δ enhancer). Cas9 was induced with Dox 24h before nucleofection of two sgRNAs. The effect on EVI1 was measured by GFP levels using flow cytometric analyses. Cells were sorted 48h after nucleofection of subsequent sgRNAs into three fractions: GFPlow, GFPmid and GFPhigh. E. Genotyping PCR showing a wild type (WT) band (1500 bp) or a band for the enhancer deleted(Δ) (900 bp), either in bulk (before sorting) or in sorted fractions. Control (Ctrl) represents PCR after nucleofection of the sgRNAs without Dox induction. F. Bar plot showing relative GFP expression of bulk and sorted fractions analyzed by qPCR. The expression levels of PBGD, a housekeeping gene, were used as control for normalization. Relative expression is calculated as fold over Ctrl (nucleofection of the sgRNAs without Dox). Error bars represent standard deviation of two biological replicates. G. Bar plot showing relative EVI1 expression of MUTZ3-EVI1-GFP bulk and sorted fractions analyzed by qPCR. For details see Figure 2F legend. H. Bar plot showing the number of colonies grown in methylcellulose from each sorted fraction. Colonies were counted 1.5 weeks after plating. Error bars represent standard deviation of three plates.
Figure 3.
Figure 3.
Unbiased CRISPR/Cas9 enhancer scan reveals one 1 kb region to be essential for EVI1 activation. A. ChIP-seq to determine H3K27Ac pattern and p300 binding as well as open chromatin analysis using ATAC-seq in MUTZ3 and MOLM1 cells. The locations of the >3200 sgRNAs targeting the enhancer are indicated as vertical blue lines. A schematic overview of the enhancer scanning strategy is depicted below. B. Scatter plot of enrichment of sgRNAs in sorted GFPlow fractions at day 5 and day 7 upon Dox induction. The average of three independent experiments for each dot is depicted. For every sgRNA detected in the GFPlow fractions the log2fold change (LFC) of the +Dox relative to –Dox was calculated. Five sgRNAs targeting EVI1 were added to the sgRNA library as positive controls and are indicated in blue. The sgRNAs selected for further validation are indicated in green. The fitted linear regression and corresponding R-squared and p-value are indicated. C. The LFC enrichment at day 7 of all sgRNAs and of sgRNAs with >2, >3 or >5 fold enrichment of sgRNAs in the GFPlow fractions at the 18 kb region of the GATA2 super-enhancer in MUTZ3 cells is depicted. The H3K27Ac pattern, p300 binding, open chromatin (ATAC) and location of all sgRNAs are indicated to visualize which sgRNAs were enriched in the GFPlow fraction. The −110 kb distal GATA2 enhancer is indicated. D. Scatter plot showing enrichment of sgRNAs in sorted GFPlow fractions at day 7 compared to %GFPneg cells at day 7 for individually validated sgRNAs (based on two independent biological experiments). The sgRNAs used for validation are indicated by dots. The fitted linear regression and corresponding R-squared and p-value are indicated. E. Zoom-in of the −110 kb GATA2 enhancer (chr3:128322411-128323124) showing H3K27Ac pattern, p300 binding and open chromatin (ATAC), LFC enrichment of sgRNAs at day 7 and the %GFPneg cells at day 7 of the individually validated sgRNAs. Mutations in motifs for known transcription factors identified in the individually validated sgRNAs are indicated.
Figure 4.
Figure 4.
A MYB binding motif is essential for EVI1 rather than for GATA2 transcription. A. Nucleotide sequence of the region targeted by sgRNAs 3,8,11 and 16, as well as other nearby sgRNAs, with the corresponding MYB DNA binding motif highlighted in purple. Colors of sgRNAs represent differences in percentage of recovery in the GFPneg fraction. sgRNAs indicated in red are the most highly enriched in the GFPneg fraction. B. Flow cytometric analysis of MUTZ3-EVI1-GFP cells upon sgRNA treatment. GFP signal shifts are shown upon transduction with lentivirus containing sgRNAs 3, 8, 11 or an EVI1-specific sgRNA. Cells were analyzed by flow cytometry 7 days after induction of Cas9. C. Western blot using EVI1- and GATA2-specific antibodies upon transduction with lentivirus containing sgRNAs 3, 8, 11 or an EVI1 specific sgRNA (EVI1.4) analyzed 7 days after induction of Cas9. Actin was used as loading control. D. Bar plot showing relative expression of EVI1 and GATA2 in transcripts per million (TPM) in MUTZ3-EVI-GFP cells treated with sgRNAs 3, 8 or 11, −Dox or +Dox. The cells treated with sgRNAs 3, 8, or 11 were considered replicates and standard deviation is shown. E. CD34/CD15 flow cytometric analyses of MUTZ3 EVI1-GFP cells transduced with sgRNA8 (+Dox), sorted for GFPlow or GFPhigh and analyzed two weeks after sorting. F. EVI1 and GATA2 western blot upon treatment with sgRNA 8, sorted into GFPlow or GFPhigh fractions, 7 days after induction of Cas9. Actin was used as loading control. G. Editing frequency in the GFPlow fraction of sgRNA8-treated cells. Modified reads exhibited variations with respect to the reference human sequence. The percentages of reads that align to each allele were determined based on a heterozygous SNP in the sequenced region. H. Visualization of the distribution of mutations identified around the sgRNA8 target site in the GFPlow sorted fraction. The sgRNA8 target site is indicated (GGGGGCAAGTAACGGATGC) as well as the MYB binding motif (black rectangle). I. Western blot using anti-MYB antibody in MUTZ3 cell lysates following pulldowns using WT, mutated M1, M2 or M3 100bp DNA fragments.
Figure 5.
Figure 5.
Differential MYB binding and H3K27 acetylation at the hijacked GATA2 enhancer. A. H3K27Ac, p300 and MYB ChIP-seq profiles of the 18 kb super-enhancer region in MUTZ3 cells (left). Bar plot showing allelic bias towards the translocated allele for H3K27Ac, p300 and MYB occupancy by ChIP-seq analysis based on a SNP (rs553101013) (right). Previous sequencing showed that G represents the translocated allele and A the wild type allele (12). P-values were calculated using a χ2 test. B. H3K27Ac and MYB ChIP-seq profiles of the 18 kb super-enhancer in an AML patient with inv(3) (AML-2) (left). Bar plot showing discrimination between H3K27Ac at the two GATA2 enhancer alleles based on two SNPs (rs2253125 and rs2253144) (right). P-values were calculated using a χ2 test. C. MYB ChIP-seq profile of the 18 kb super-enhancer in sgRNA8-treated MUTZ3-EVI1-GFP cells plus or minus Dox treatment (left). Bar plot showing allelic distribution of MYB binding in sgRNA8 treated MUTZ3-EVI1-GFP cells plus or minus Dox treatment (right). P-values were calculated using a χ2 test. D. H3K27Ac profile of the 18 kb super-enhancer in sgRNA8-treated MUTZ3-EVI1-GFP cells, determined by Cut&Run in bulk, in GFPhigh and in GFPlow sorted fractions (left). Bar plot showing allelic bias for H3K27Ac in the bulk, GFPhigh and GFPlow fractions (right). P-values were calculated using a χ2 test.
Figure 6.
Figure 6.
MYB interference downregulates EVI1 but not GATA2. A. Western blot for MYB, EVI1 and GATA2 in MUTZ3-EVI1-GFP upon sgRNA-mediated MYB knockout (MYB.30) at indicated days after induction of Cas9. Actin was used as loading control. B. Western blot for MYB, EVI1 and GATA2 in untreated cells (−) or cells treated for two days with 20 μM of TG3 or MYBMIM (MM). Actin was used as loading control. C. Colony forming units (CFU) of MUTZ3 cells cultured without peptide or treated with 20 μM TG3 or MYBMIM for two days and subsequently plated in methylcellulose. Error bars show standard deviation across three plates. P-values were calculated using a one-way ANOVA test. D. Flow cytometric analysis of MUTZ3 cells stained with CD34 and CD15. Cells studied by flow cytometry were either untreated or treated with 20 μM TG3 or MYBMIM for two days and subsequently grown for nine days in methylcellulose. E. Colony forming units (CFU) of MUTZ3 cells with pMY-FLAG-Evi1-IRES-GFP (Evi1) or empty vector (EV) cultured without peptide or treated with 20 μM MYBMIM for two days and subsequently plated in methylcellulose. Error bars show standard deviation across three plates. P-values were calculated using a one-way ANOVA test. F. Flow cytometric analysis of MUTZ3 cells with Evi1 or EV, stained with CD34 and CD15. Cells studied by flow cytometry were either untreated or treated with 20 μM MYBMIM for two days and subsequently grown for eight days in methylcellulose. G. p300 and MYB ChIP-seq profiles of the 18 kb region in MUTZ3 cells treated with either 20 μM TG3 or MYBMIM for 48 h. H. Cell-viability test of inv(3)/t(3;3) AML primary cells determined by CellTiter-Glo three days after culturing the cells in a 96-well plate with 20 μM TG3 or MYBMIM. Error bars show standard deviation across four biological replicates. P-values were calculated using a one-way ANOVA test. I. Western blot for MYB, EVI1 and GATA2 in untreated AML cells or in AML cells treated with 20 μM TG3 or MYBMIM for 48h. Actin was used as loading control. J. Western blot for MYB, EVI1 and GATA2 in cultured CD34+ cells untreated or treated with 20 μM TG3 or MYBMIM for 48h. Actin was used as loading control.
Figure 7.
Figure 7.
Mechanism by which MYB drives oncogene activation in inv(3)/t(3;3) AML. A CRISPR/Cas9 scan of the GATA2 translocated enhancer pinpointed a single regulatory element containing a MYB-binding motif critical for EVI1 expression (top). MYB preferentially occupies the translocated enhancer driving EVI1 expression. Inference with MYB downregulates EVI1 but not GATA2 levels (bottom).

References

    1. Garraway LA, Lander ES. Lessons from the cancer genome. Cell 2013;153(1):17–37 doi 10.1016/j.cell.2013.03.002. - DOI - PubMed
    1. Vogelstein B, Papadopoulos N, Velculescu VE, Zhou S, Diaz LA Jr., Kinzler KW. Cancer genome landscapes. Science 2013;339(6127):1546–58 doi 10.1126/science.1235122. - DOI - PMC - PubMed
    1. Maurano MT, Humbert R, Rynes E, Thurman RE, Haugen E, Wang H, et al. Systematic localization of common disease-associated variation in regulatory DNA. Science 2012;337(6099):1190–5 doi 10.1126/science.1222794. - DOI - PMC - PubMed
    1. Khurana E, Fu Y, Chakravarty D, Demichelis F, Rubin MA, Gerstein M. Role of non-coding sequence variants in cancer. Nat Rev Genet 2016;17(2):93–108 doi 10.1038/nrg.2015.17. - DOI - PubMed
    1. Zhu H, Uuskula-Reimand L, Isaev K, Wadi L, Alizada A, Shuai S, et al. Candidate Cancer Driver Mutations in Distal Regulatory Elements and Long-Range Chromatin Interaction Networks. Mol Cell 2020;77(6):1307–21 e10 doi 10.1016/j.molcel.2019.12.027. - DOI - PubMed

Publication types

Substances