. 2021 Aug 27;67(4):241-250.
doi: 10.1262/jrd.2020-108. Epub 2021 May 12.

Serotonergic signals enhanced hamster sperm hyperactivation

Affiliations

Serotonergic signals enhanced hamster sperm hyperactivation

Chiyori Sakamoto et al. J Reprod Dev. .

Abstract

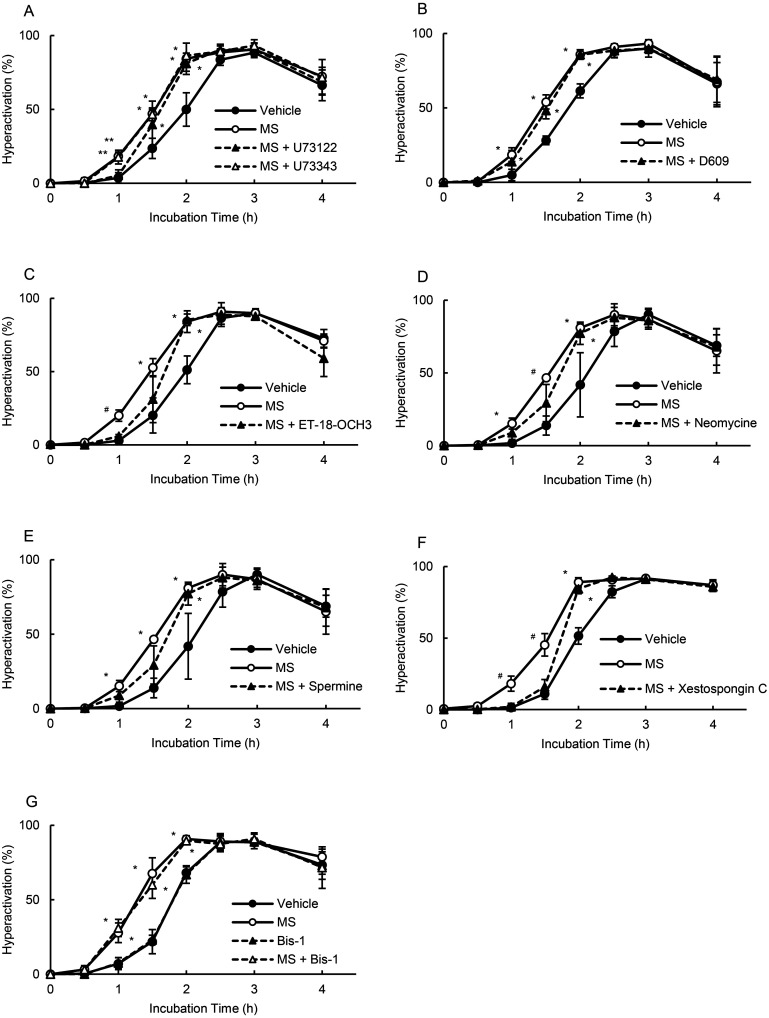
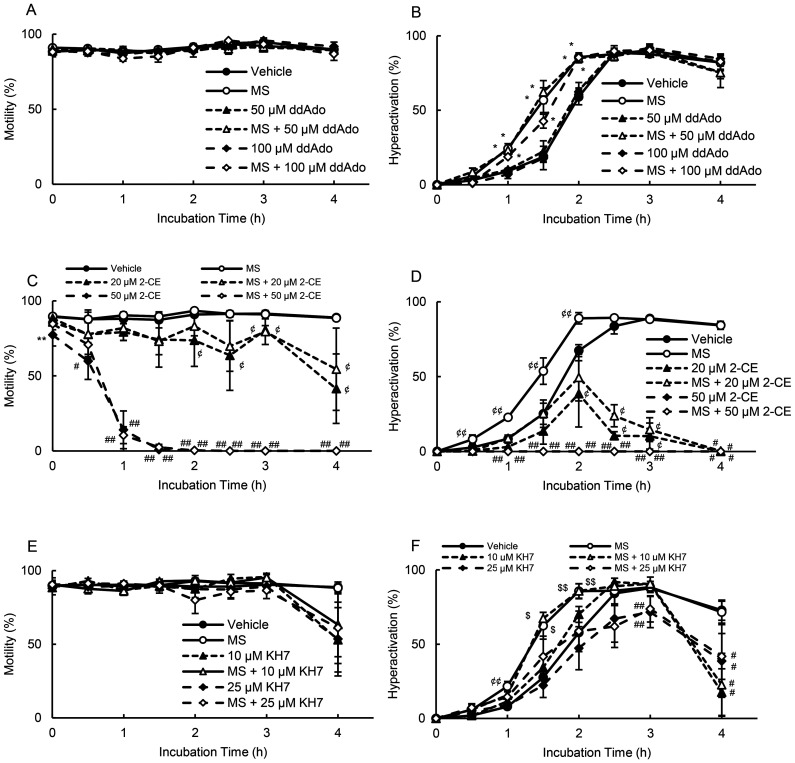
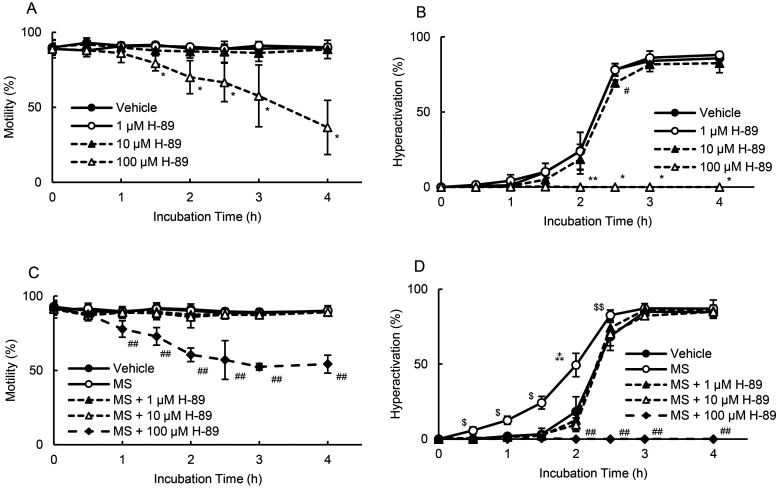
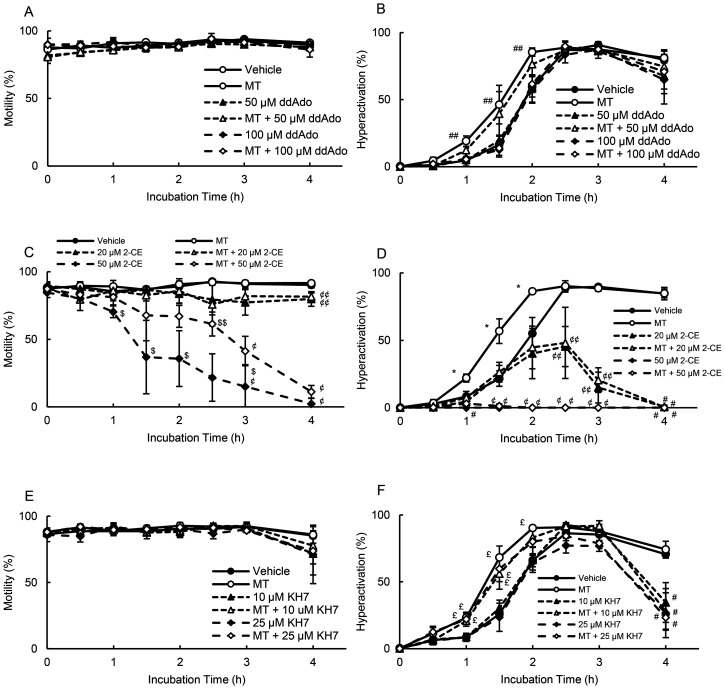
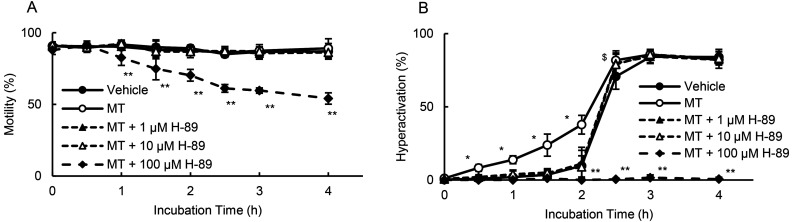
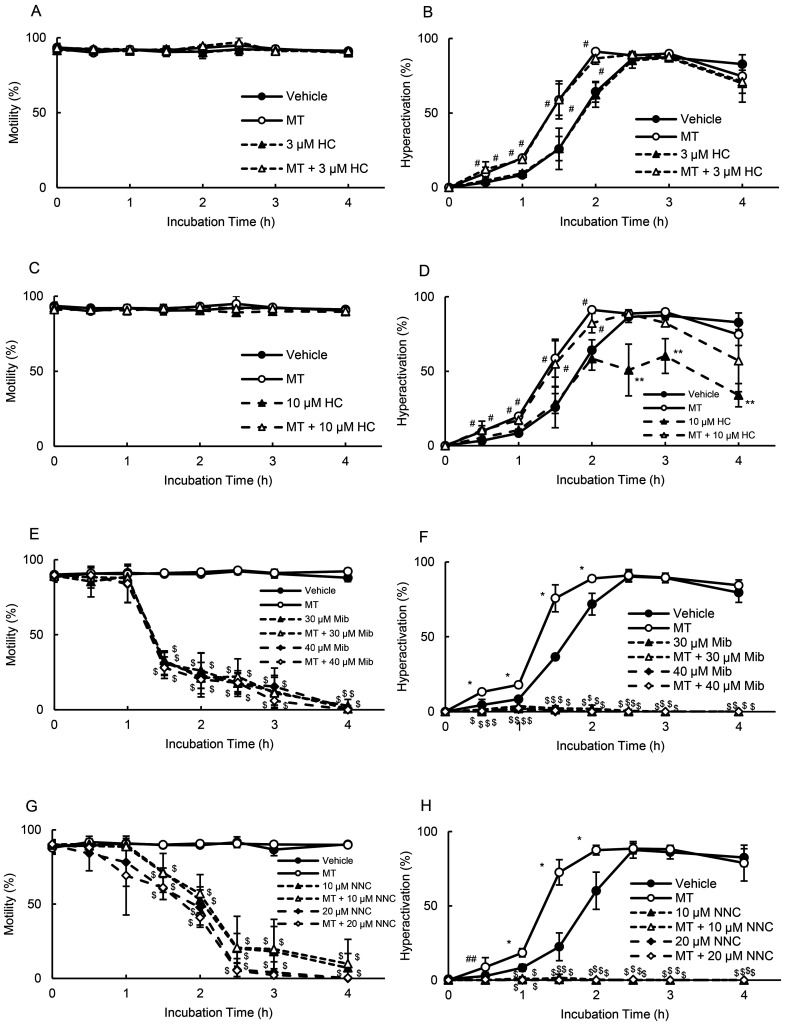
In the present study, we investigated the regulatory mechanisms underlying sperm hyperactivation enhanced by 5-hydroxytryptamine (5-HT) in hamsters. First, we examined the types of 5-HT receptors that regulate hyperactivation. Hyperactivation was significantly enhanced by 5-HT2A and 5-HT4 receptor agonists. Moreover, the results of the motility assay revealed that 5-HT2A, 5-HT3, and 5-HT4 receptor agonists significantly decreased the velocity and/or amplitude of sperm. Under 5-HT2 receptor stimulation, hyperactivation was associated with phospholipase C (PLC), inositol 1,4,5-trisphosphate (IP3) receptor, soluble adenylate cyclase (sAC), and protein kinase A (PKA). In contrast, under 5-HT4 receptor stimulation, hyperactivation was associated with transmembrane adenylate cyclase (tmAC), sAC, PKA, and CatSper channels. Accordingly, under the condition that sperm are hyperactivated, 5-HT likely stimulates PLC/IP3 receptor signals via the 5-HT2A receptor and tmAC/PKA/CatSper channel signals via the 5-HT4 receptor. After sAC and PKA are activated by these stimulations, sperm hyperactivation is enhanced.

Keywords: 5-HT2 receptor; 5-HT4 receptor; 5-Hydroxytryptamine (5-HT); Hyperactivation; Sperm.


Conflict of interest statement

The authors declare that there are no conflicts of interest that could be perceived as prejudicing the impartiality of the research reported.

Figures

Fig. 1.
Fig. 1.
Suppression of MS-enhanced hyperactivation by PLC, IP3R, and PKC inhibitors. Percentages of hyperactivation were detected after sperm were cultured for 4 h with 100 fM MS and inhibitors, including 1 μM U73122 and 1 μM U73343 (A), 10 μM D609 (B), 15 μM ET-18-OCH3 (C), 65 μM neomycin (D), 1 mM spermine (E), 1 μM xestospongin C (F), and 10 nM Bis-1 (G). Data represent the mean ± standard deviation (SD). (A) (Vehicle) medium with 0.1% (v/v) pure water and 0.1% (v/v) ethanol as vehicle; (MS) medium with 100 fM MS and vehicle; (MS + U73122) medium with 100 fM MS, 1 μM U73122, and vehicle; (MS + U73343) medium with 100 fM MS, 1 μM U73343, and vehicle. (B) (Vehicle) same as above; (MS) medium with 100 fM MS and vehicle; (MS + D609) medium with 100 fM MS, 10 μM D609, and vehicle. (C) (Vehicle) same as above; (MS) medium with 100 fM MS and vehicle; (MS + ET-18-OCH3) medium with 100 fM MS, 15 μM ET-18-OCH3, and vehicle. (D) (Vehicle) same as above; (MS) medium with 100 fM MS and vehicle; (MS + Neomycin) medium with 100 fM MS, 65 μM neomycin, and vehicle. (E) (Vehicle) same as above; (MS) medium with 100 fM MS and vehicle; (MS + Spermine) medium with 100 fM MS, 1 mM spermine, and vehicle. (F) (Vehicle) medium with 0.1% (v/v) pure water and 0.1% (v/v) dimethyl sulfoxide as vehicle; (MS) medium with 100 fM MS and vehicle; (MS + Xestospongin C) medium with 100 fM MS, 1 μM xestospongin C, and vehicle. (G) (Vehicle) same as above; (MS) medium with 100 fM MS and vehicle; (MS + Bis-1) medium with 100 fM MS, 10 nM Bis-1, and vehicle. * indicates significant differences compared with “Vehicle” (P < 0.05). ** indicates significant differences compared with “Vehicle,” “MS + U73122” (P < 0.05). # indicates significant differences compared with “Vehicle” and “MS + inhibitors” (P < 0.05). MS, α-methylserotonin maleate; Bis-1, bisindolylmaleimide 1; PLC, phospholipase C; PKC, protein kinase C; IP3, inositol 1,4,5-trisphosphate.
Fig. 2.
Fig. 2.
Suppression of MS-enhanced hyperactivation by adenylate cyclase inhibitors. Percentages of motility (A, C, and E) and hyperactivation (B, D, and F) were detected after sperm were cultured for 4 h with 100 fM MS and inhibitors, including 50 and 100 μM ddAdo (A and B), 20 and 50 μM 2-CE (C and D), and 10 and 25 μM KH7 (E and F). Data represent the mean ± standard deviation (SD). (A and B) (Vehicle) medium with 0.2% (v/v) pure water as vehicle; (MS) medium with 100 fM MS and vehicle; (50 μM ddAdo) medium with 50 μM ddAdo and vehicle; (MS + 50 μM ddAdo) medium with 100 fM MS, 50 μM ddAdo, and vehicle; (100 μM ddAdo) medium with 100 μM ddAdo and vehicle; (MS + 100 μM ddAdo) medium with 100 fM MS, 100 μM ddAdo, and vehicle. (C and D) (Vehicle) medium with 0.1% (v/v) pure water and 0.1% (v/v) ethanol as vehicle; (MS) medium with 100 fM MS and vehicle; (20 μM 2-CE) medium with 20 μM 2-CE and vehicle; (MS + 20 μM 2-CE) medium with 100 fM MS, 20 μM 2-CE, and vehicle; (50 μM 2-CE) medium with 50 μM 2-CE and vehicle; (MS + 50 μM 2-CE) medium with 100 fM MS, 250 μM 2-CE, and vehicle. (E and F) (Vehicle) medium with 0.1% (v/v) pure water and 0.1% (v/v) dimethyl sulfoxide as vehicle; (MS) medium with 100 fM MS and vehicle; (10 μM KH7) medium with 10 μM KH7 and vehicle; (MS + 10 μM KH7) medium with 100 fM MS, 10 μM KH7, and vehicle; (25 μM KH7) medium with 25 μM KH7 and vehicle; (MS + 25 μM KH7) medium with 100 fM MS, 25 μM KH7, and vehicle. * indicates significant differences compared with “Vehicle” and “Inhibitors” (P < 0.05). ** indicates significant differences compared with “Vehicle,” “MS,” “Low concentration of inhibitor,” and “MS + inhibitors” (P < 0.05). # indicates significant differences compared with “Vehicle” and “MS” (P < 0.05). ## indicates significant differences compared with “Vehicle,” “MS,” “Low concentration of inhibitor,” and “MS + low concentration of inhibitor” (P < 0.05). ¢ indicates significant differences compared with “Vehicle,” “MS,” “High concentration of inhibitor,” and “MS + High concentration of inhibitor” (P < 0.05). ¢¢ indicates significant differences compared with “Vehicle,” “Inhibitors,” and “MS + Inhibitor” (P < 0.05). $ indicates significant differences compared with “Vehicle,” “Inhibitors,” and “MS + High concentration of inhibitor” (P < 0.05). $$ indicates significant differences compared with “Vehicle,” “High concentration of inhibitor,” and “MS + High concentration of inhibitor” (P < 0.05). MS, α-methylserotonin maleate; 2-CE, 2-hydroxyestradiol; ddAdo, 2’,3’-dideoxyadenosine.
Fig. 3.
Fig. 3.
Suppression of motility and hyperactivation by H-89 (PKA inhibitor). Percentages of motility (A and C) and hyperactivation (B and D) were determined after sperm were cultured with various concentrations of H-89 for 4 h in the absence and the presence of 100 fM MS. Data represent the mean ± standard deviation (SD). (A and B) (Vehicle) medium with 0.1% (v/v) dimethyl sulfoxide as vehicle; (1 µM H-89) medium with 1 µM H-89 and vehicle; (10 µM H-89) medium with 10 µM H-89 and vehicle; (100 µM H-89) medium with 100 µM H-89 and vehicle. (C and D) (Vehicle) medium with 0.1% (v/v) pure water and 0.1% (v/v) dimethyl sulfoxide as vehicle; (MS) medium with 100 fM MS and vehicle; (MS + 1 µM H-89) medium with 100 fM MS, 1 µM H-89, and vehicle; (MS + 10 µM H-89) medium with 100 fM MS, 10 µM H-89, and vehicle; (MS + 100 µM H-89) medium with 100 fM MS, 100 µM H-89, and vehicle. * indicates significant differences compared with “Vehicle,” “1 µM H-89,” and “10 µM H-89” (P < 0.05). ** indicates significant differences compared with “Vehicle” and “1 µM H-89” (P < 0.05). # indicates significant differences compared with “Vehicle” (P < 0.05). ## indicates significant differences compared with “Vehicle,” “MS,” “MS + 1 µM H-89,” and “MS + 10 µM H-89” (P < 0.05). $ indicates significant differences compared with “Vehicle” (P < 0.05). $$ indicates significant differences compared with “Vehicle” and “MS + 10 µM H-89” (P < 0.05). ⁂ indicates significant differences compared with “Vehicle,” “MS + 1 µM H-89,” and “MS + 10 µM H-89” (P < 0.05). MS, α-methylserotonin maleate.
Fig. 4.
Fig. 4.
Suppression of MT-enhanced hyperactivation by adenylate cyclase inhibitors. Percentages of motility (A, C, and E) and hyperactivation (B, D, and F) were determined after sperm were cultured for 4 h with 10 pM MT and inhibitors, including 50 and 100 μM ddAdo (A and B), 20 and 50 μM 2-CE (C and D), and 10 and 25 μM KH7 (E and F). Data represent the mean ± standard deviation (SD). (A and B) (Vehicle) medium with 0.1% (v/v) pure water and 0.1% (v/v) ethanol as vehicle; (MT) medium with 10 pM MT and vehicle; (50 μM ddAdo) medium with 50 μM ddAdo and vehicle; (MT + 50 μM ddAdo) medium with 10 pM MT, 50 μM ddAdo, and vehicle; (100 μM ddAdo) medium with 100 μM ddAdo and vehicle; (MT + 100 μM ddAdo) medium with 10 pM MT, 100 μM ddAdo, and vehicle. (C and D) (Vehicle) medium with 0.2% (v/v) ethanol as vehicle; (MT) medium with 10 pM MT and vehicle; (20 μM 2-CE) medium with 20 μM 2-CE and vehicle; (MT + 20 μM 2-CE) medium with 10 pM MT, 20 μM 2-CE, and vehicle; (50 μM 2-CE) medium with 50 μM 2-CE and vehicle; (MT + 50 μM 2-CE) medium with 10 pM MT, 50 μM 2-CE, and vehicle. (E and F) (Vehicle) medium with 0.1% (v/v) ethanol and 0.1% (v/v) dimethyl sulfoxide as vehicle; (MT) medium with 10 pM MT and vehicle; (10 μM KH7) medium with 10 μM KH7 and vehicle; (MT + 10 μM KH7) medium with 10 pM MT, 10 μM KH7, and vehicle; (25 μM KH7) medium with 25 μM KH7 and vehicle; (MT + 25 μM KH7) medium with 10 pM MT, 25 μM KH7, and vehicle. * indicates significant differences compared with “Vehicle,” “Inhibitors,” and “MT + Inhibitors” (P < 0.05). # indicates significant differences compared with “Vehicle” and “MT” (P < 0.05). ## indicates significant differences compared with “Vehicle,” “Inhibitors,” and “MT + High concentration of inhibitor” (P < 0.05). $ indicates significant differences compared with “Vehicle,” “MT,” “Low concentration of inhibitor,” and “MT + Inhibitors” (P < 0.05). $$ indicates significant differences compared with “Vehicle,” “MT,” and “High concentration of inhibitor” (P < 0.05). ¢ indicates significant differences compared with “Vehicle,” “MT,” “Low concentration of inhibitor,” and “MT + Low concentration of inhibitor” (P < 0.05). ¢¢ indicates significant differences compared with “Vehicle,” “MT,” “High concentration of inhibitor,” and “MT + High concentration of inhibitor” (P < 0.05). £ indicates significant differences compared with “Vehicle” and “Inhibitors” (P < 0.05). MT, 5-methoxytryptamine; 2-CE, 2-hydroxyestradiol; ddAdo, 2’,3’-dideoxyadenosine.
Fig. 5.
Fig. 5.
Suppression of MT-enhanced hyperactivation by PKA inhibitors. Percentages of motility (A) and hyperactivation (B) were determined after sperm were cultured for 4 h with 10 pM MT and various concentrations of H-89. Data represent the mean ± standard deviation (SD). (A and B) (Vehicle) medium with 0.1% (v/v) ethanol and 0.1% (v/v) dimethyl sulfoxide as vehicle; (MT) medium with 10 pM MT and vehicle; (MT + 1 µM H-89) medium with 10 pM MT, 1 µM H-89, and vehicle; (MT + 10 µM H-89) medium with 10 pM MT, 10 µM H-89, and vehicle; (MT + 100 µM H-89) medium with 10 pM MT, 100 µM H-89, and vehicle. * indicates significant differences compared with “Vehicle,” “Inhibitors,” and “MT + Inhibitors” (P < 0.05). ** indicates significant differences compared with “Vehicle,” “MT,” “MT + 1 µM H-89,” and “MT + 10 µM H-89” (P < 0.05). $ indicates significant differences compared with “Vehicle,” “MT + 1 µM H-89,” and “MT + 10 µM H-89” (P < 0.05). MT, 5-methoxytryptamine; PKA, protein kinase A.
Fig. 6.
Fig. 6.
Suppression of MT-enhanced hyperactivation by CatSper inhibitors. Percentages of motility (A, C, E, and G) and hyperactivation (B, D, F, and H) were determined after sperm were cultured for 4 h with 10 pM MT and inhibitors such as 3 μM HC (A and B), 10 μM HC (C and D), 30 and 40 μM Mib (E and F), and 10 and 20 μM NNC (G and H). Data represent the mean ± standard deviation (SD). (A and B) (Vehicle) medium with 0.1% (v/v) ethanol and 0.1% (v/v) dimethyl sulfoxide as vehicle; (MT) medium with 10 pM MT and vehicle; (3 µM HC) medium with 3 µM HC and vehicle; (MT + 3 µM HC) medium with 10 pM MT, 3 µM HC, and vehicle. (C and D) (Vehicle) same as above; (MT) medium with 10 pM MT and vehicle; (10 µM HC) medium with 10 µM HC and vehicle; (MT + 10 µM HC) medium with 10 pM MT, 10 µM HC, and vehicle. (E and F) (Vehicle) same as above; (MT) medium with 10 pM MT and vehicle; (30 µM Mib) medium with 30 µM Mib and vehicle; (MT + 30 µM Mib) medium with 10 pM MT, 30 µM Mib, and vehicle; (40 µM Mib) medium with 40 µM Mib and vehicle; (MT + 40 µM Mib) medium with 10 pM MT, 40 µM Mib, and vehicle. (G and H) (Vehicle) same as above; (MT) medium with 10 pM MT and vehicle; (10 µM NNC) medium with 10 µM NNC and vehicle; (MT + 10 µM NNC) medium with 10 pM MT, 10 µM NNC, and vehicle; (20 µM NNC) medium with 20 µM NNC and vehicle; (MT + 20 µM NNC) medium with 10 pM MT, 20 µM NNC, and vehicle. * indicates significant differences compared with “Vehicle,” “inhibitors,” and “MT + inhibitors” (P < 0.05). ** indicates significant differences compared with “Vehicle,” “MT,” and “MT + inhibitors” (P < 0.05). # indicates significant differences compared with “Vehicle” and “inhibitors” (P < 0.05). ## indicates significant differences compared with “inhibitors” and “MT + inhibitors” (P < 0.05). $ indicates significant differences compared with “Vehicle” and “MT” (P < 0.05). MT, 5-methoxytryptamine; HC, 2,4-dithenoyl-1,2,5-oxadiazone n2-oxide; Mib, mibefradil.

References

    1. Mohri H, Inaba K, Ishijima S, Baba SA. Tubulin-dynein system in flagellar and ciliary movement. Proc Jpn Acad B 2012; 88: 397–415. - PMC - PubMed
    1. Yanagimachi R. Mammalian fertilization. In: Knobil E, Neill JD (ed.), The Physiology of Reproduction Vol. 2, 2nd ed. New York: Raven Press; 1994: 189–317.
    1. Noguchi T, Fujinoki M, Kitazawa M, Inaba N. Regulation of hyperactivation of hamster spermatozoa by progesterone. Reprod Med Biol 2008; 7: 63–74. - PMC - PubMed
    1. Fujinoki M. Melatonin-enhanced hyperactivation of hamster sperm. Reproduction 2008; 136: 533–541. - PubMed
    1. Langlais J, Roberts KD. A molecular membrane model of sperm capacitation and the acrosome reaction of mammalian spermatozoa. Gamete Res 1985; 12: 183–224.

MeSH terms