. 2021 May 12;12(1):2754.
doi: 10.1038/s41467-021-22314-w.

Evidence of anthropogenic impacts on global drought frequency, duration, and intensity

Affiliations

Evidence of anthropogenic impacts on global drought frequency, duration, and intensity

Felicia Chiang et al. Nat Commun. .

Abstract

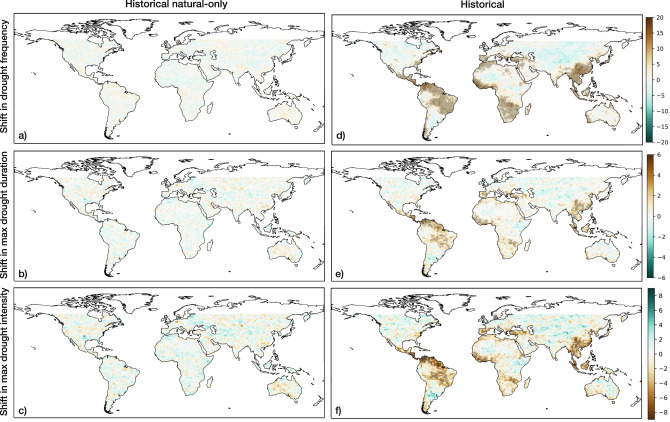
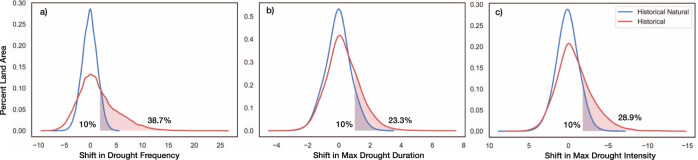
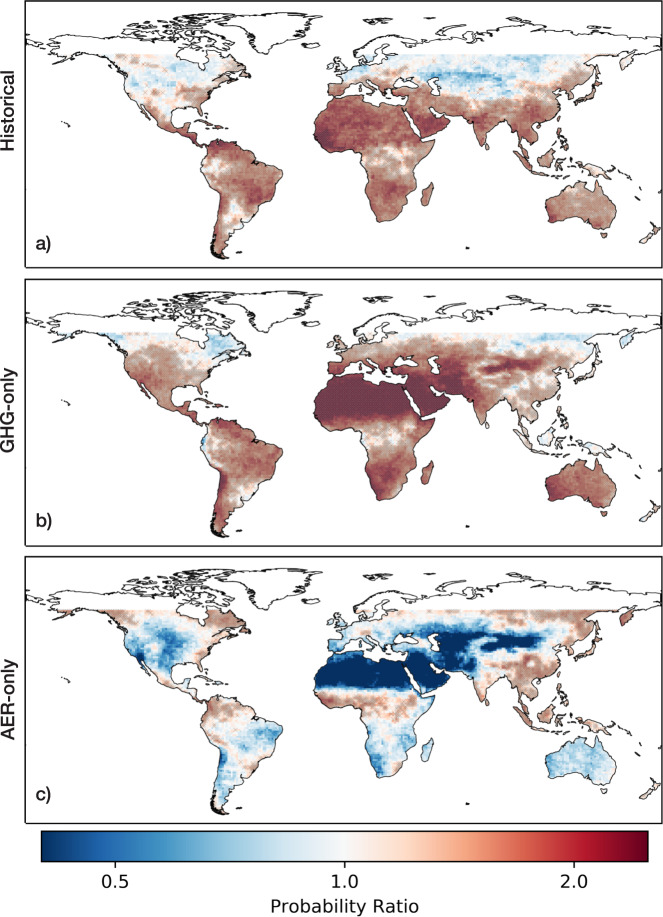
Most climate change detection and attribution studies have focused on mean or extreme temperature or precipitation, neglecting to explore long-term changes in drought characteristics. Here we provide evidence that anthropogenic forcing has impacted interrelated meteorological drought characteristics. Using SPI and SPEI indices generated from an ensemble of 9 CMIP6 models (using 3 realizations per model), we show that the presence of anthropogenic forcing has increased the drought frequency, maximum drought duration, and maximum drought intensity experienced in large parts of the Americas, Africa, and Asia. Using individual greenhouse gas and anthropogenic aerosol forcings, we also highlight that regional balances between the two major forcings have contributed to the drying patterns detected in our results. Overall, we provide a comprehensive characterization of the influence of anthropogenic forcing on drought characteristics, providing important perspectives on the role of forcings in driving changes in drought events.


Conflict of interest statement

The authors declare no competing interests.

Figures

Fig. 1
Fig. 1. Global shifts in 6-month SPI drought features from historical and historical natural-only simulations with a defined drought threshold of SPI < −1.5.
Stippling over each pixel indicates a statistically significant increase in the associated drought characteristic (see Methods). a Difference in drought frequency between 1956–2005 and 1851–1900 from the CMIP6 historical natural-only multi-model ensemble median. b Difference in maximum drought duration under historical natural-only conditions. c Difference in maximum drought intensity under historical natural-only conditions. d Difference in drought frequency under historical conditions. e Difference in historical maximum drought duration. f Difference in historical maximum drought intensity.
Fig. 2
Fig. 2. Global land distributions of 6-month SPI drought feature shifts from historical and historical natural simulations.
Each probability density function represents the distribution of shifts between 1956–2005 and 1851–1900 in a drought frequency, b maximum drought duration, c maximum drought intensity from all land pixels between 60°N and 60°S.
Fig. 3
Fig. 3. Probability Ratios (PR) of 6-month SPI drought events under historical, greenhouse gas (GHG-only), and aerosol (AER-only) forcings.
The PR of each pixel is calculated by designating 6-month SPI dips less than −1.5 as drought events, using SPI data generated from a historical, b GHG-only, and c AER-only forced CMIP6 models. Values above 1 indicate higher risks of drought events in forced conditions, while values below 1 indicate lower risks of drought events in natural-only conditions. Stippling over the grid cells indicates that the median of the model ensemble is statistically significantly greater than 1.
Fig. 4
Fig. 4. Bivariate distributions of drought event duration and median intensity.
Each distribution is based on 6-month SPI < −1.5 droughts identified from a) Central America/Mexico, b) Mediterranean, and c) Central Asia regional data from all CMIP6 models. Univariate distributions of each characteristic are displayed on the outer axes of each subplot.
Fig. 5
Fig. 5. Global shifts in SPEI drought features from historical and historical natural-only simulations.
Stippling over each pixel indicates a statistically significant increase in the associated drought feature (see Methods). a Difference in drought frequency between 1956–2005 and 1851–1900 from the CMIP6 historical natural-only multi-model ensemble median. b Difference in maximum drought duration under historical natural-only conditions. c Difference in maximum drought intensity under historical natural-only conditions. d Difference in drought frequency under historical conditions. e Difference in historical maximum drought duration. f Difference in historical maximum drought intensity.
Fig. 6
Fig. 6. Global land distributions of SPEI-based drought feature shifts from historical and historical natural simulations.
Each probability density function represents the distribution of shifts between 1956–2005 and 1851–1900 in a drought frequency, b maximum drought duration, c maximum drought intensity from all land pixels between 60°N and 60°S.
Fig. 7
Fig. 7. SPEI-based Probability Ratio (PR) plots for historical, greenhouse gas (GHG-only), and aerosol (AER-only) conditions.
The PR of each pixel is calculated by designating 6-month SPEI dips less than -1.5 as drought events, using a historical, b GHG-only, and c AER-only datasets. Values above 1 indicate higher risks of drought events in forced conditions, while values below 1 indicate lower risks of drought events in natural-only conditions. Stippling over the grid cells indicates that the median of the model ensemble is statistically significantly greater than 1.

References

    1. Wilhite DA, Svoboda MD, Hayes MJ. Understanding the complex impacts of drought: a key to enhancing drought mitigation and preparedness. Water Resour. Manag. 2007;21:763–774. doi: 10.1007/s11269-006-9076-5. - DOI
    1. Vicente-Serrano SM, et al. Response of vegetation to drought time-scales across global land biomes. PNAS. 2013;110:52–57. doi: 10.1073/pnas.1207068110. - DOI - PMC - PubMed
    1. Seneviratne, S. I. et al. Managing the Risks of Extreme Events and Disasters to Advance Climate Change Adaptation (eds Field, C. B., Barros, V., Stocker, T. F. & Dahe, Q.) (Cambridge Univ. Press, 2012).
    1. Sternberg T. Regional drought has a global impact. Nature. 2011;472:169–169. doi: 10.1038/472169d. - DOI - PubMed
    1. Dai A. Drought under global warming: a review. WIREs Clim. Chang. 2011;2:45–65. doi: 10.1002/wcc.81. - DOI

Publication types