. 2021 May 12;12(1):2743.
doi: 10.1038/s41467-021-22733-9.

INI1/SMARCB1 Rpt1 domain mimics TAR RNA in binding to integrase to facilitate HIV-1 replication

Affiliations

INI1/SMARCB1 Rpt1 domain mimics TAR RNA in binding to integrase to facilitate HIV-1 replication

Updesh Dixit et al. Nat Commun. .

Abstract

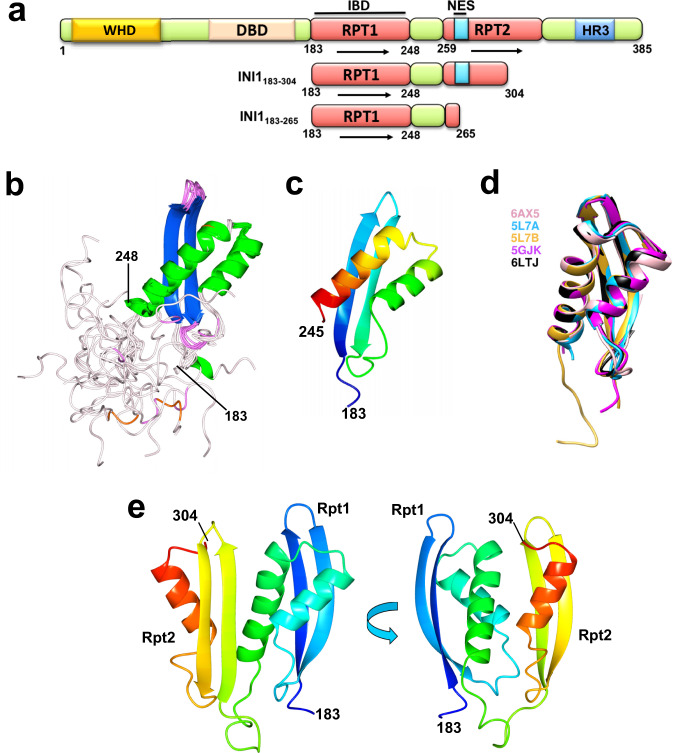
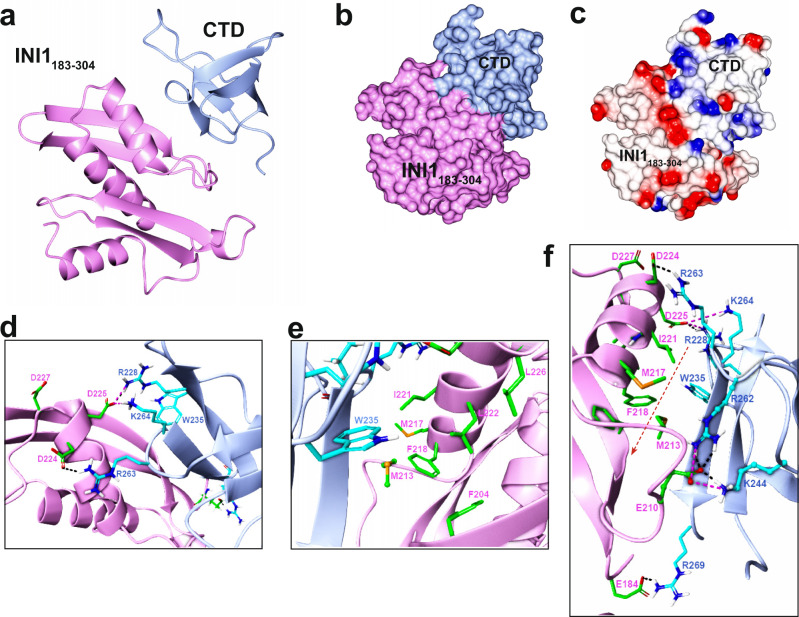
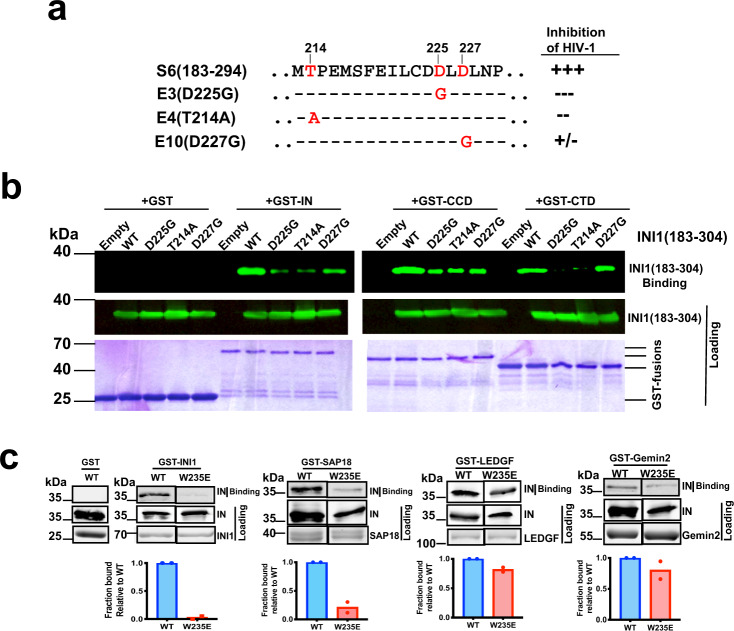
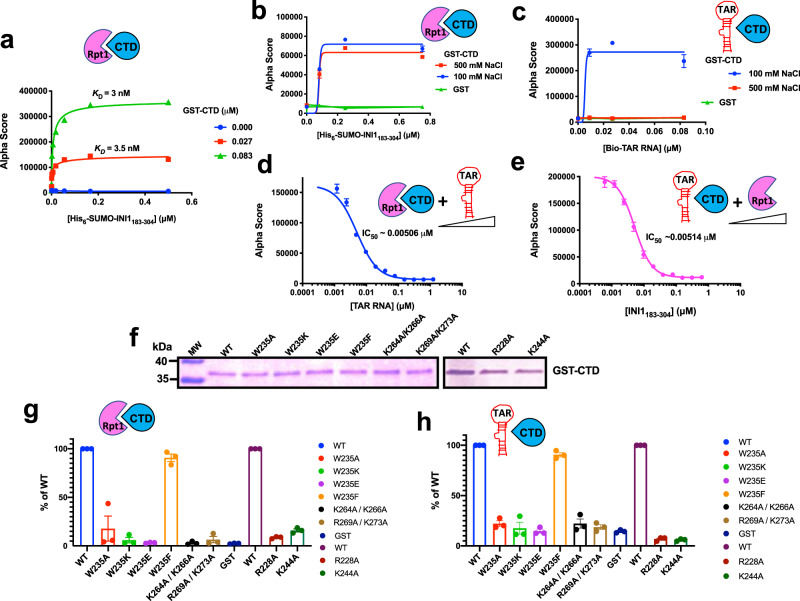
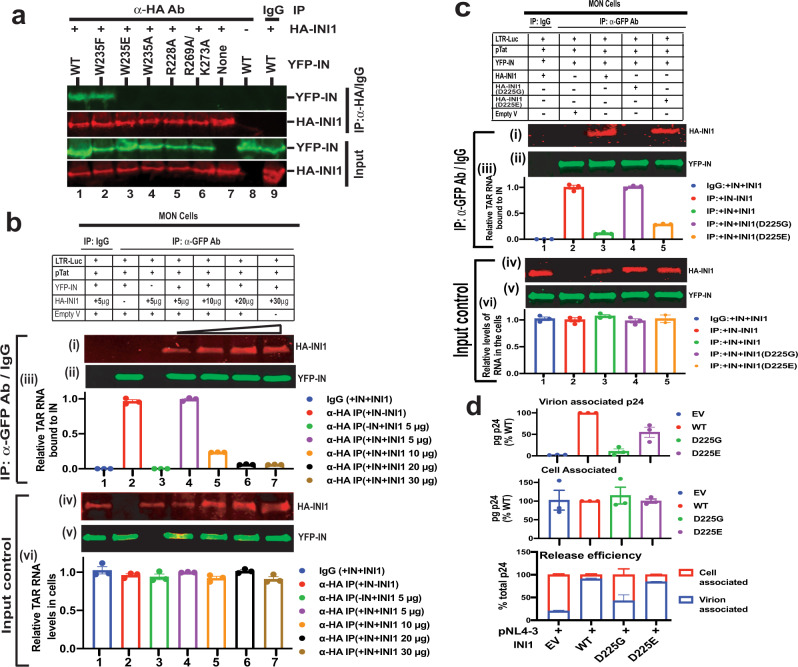
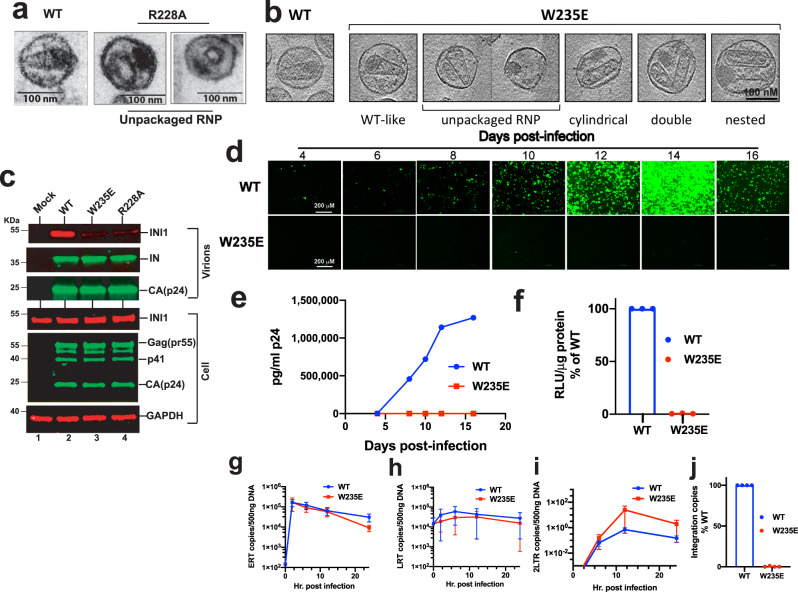
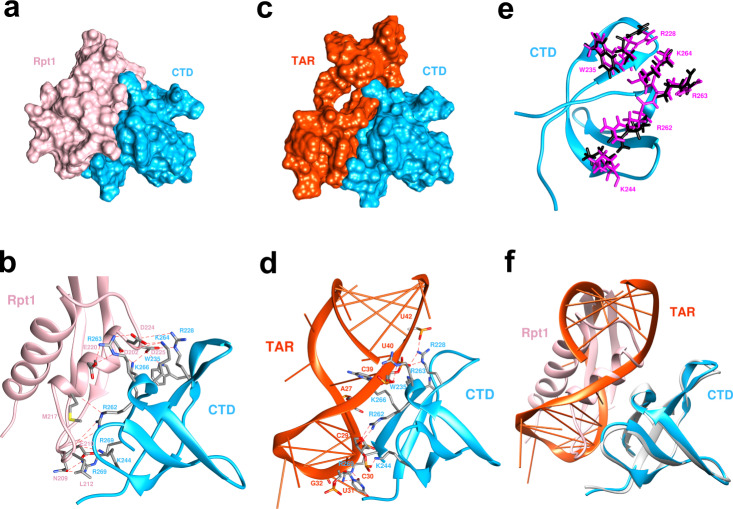
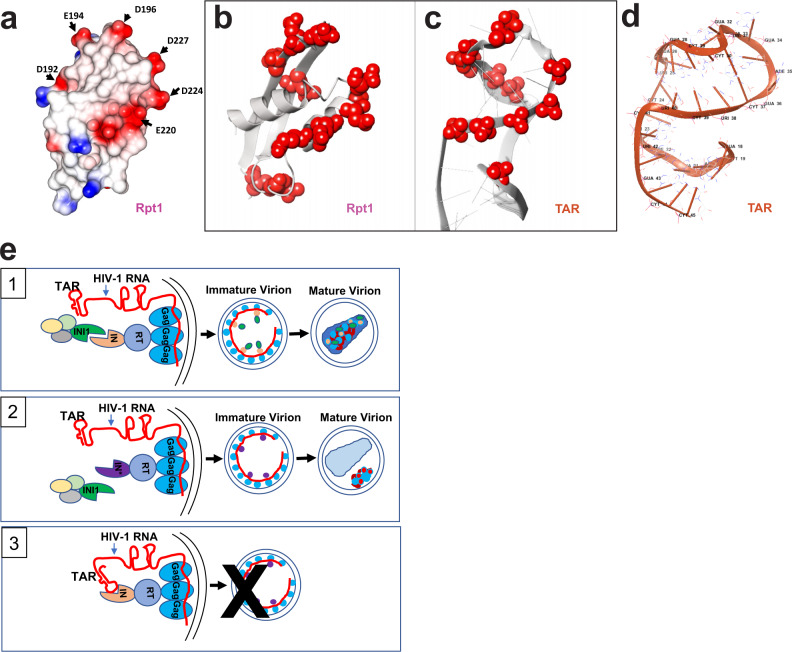
INI1/SMARCB1 binds to HIV-1 integrase (IN) through its Rpt1 domain and exhibits multifaceted role in HIV-1 replication. Determining the NMR structure of INI1-Rpt1 and modeling its interaction with the IN-C-terminal domain (IN-CTD) reveal that INI1-Rpt1/IN-CTD interface residues overlap with those required for IN/RNA interaction. Mutational analyses validate our model and indicate that the same IN residues are involved in both INI1 and RNA binding. INI1-Rpt1 and TAR RNA compete with each other for IN binding with similar IC50 values. INI1-interaction-defective IN mutant viruses are impaired for incorporation of INI1 into virions and for particle morphogenesis. Computational modeling of IN-CTD/TAR complex indicates that the TAR interface phosphates overlap with negatively charged surface residues of INI1-Rpt1 in three-dimensional space, suggesting that INI1-Rpt1 domain structurally mimics TAR. This possible mimicry between INI1-Rpt1 and TAR explains the mechanism by which INI1/SMARCB1 influences HIV-1 late events and suggests additional strategies to inhibit HIV-1 replication.


Conflict of interest statement

The authors declare no competing interests.

Figures

Fig. 1
Fig. 1. NMR structure of Rpt1 + linker domains of INI1 and molecular modeling of IN binding Rpt1 + linker + Rpt2 fragment.
a Schematic representation of various domains of INI1 and the inhibitory fragment S6 (WHD (in yellow) = Winged Helix DNA binding domain, DBD (in cream) = DNA binding domain; RPT (in red) = Repeat; NES (in turquoise) = Nuclear export signal; HR3 (in blue) = homology region 3; arrows represent repeats). b Superposition of the residues 183-265 of the 20 lowest-energy NMR structures of the INI1 Rpt1+linker fragment. Note the disordered nature of the linker region (aa 250-265, shown in pale pink). The helices are in green and beta-sheet in blue. c A ribbon diagram (in rainbow colors) of a lowest energy representative structure of Rpt1 (aa183–245). d Superimposition of C-alpha atoms of five different structures (6AX5 in pink, 57LA in turquoise, 5L7B in yellow, 5GJK in magenta, 6LTJ in black) showing alignment of the Rpt1 region (aa 183–248); e Ribbon diagram (in rainbow color) of a representative structure of INI1183-304 modeled using Robetta based on the NMR structure 6AX5. PDB file of this model is included in the Supplementary Data 1.
Fig. 2
Fig. 2. Molecular docking of IN-CTD with INI1183-304.
a Ribbon diagram of bound complex of INI1183-304/CTD model obtained from HADDOCK. b Surface structure of INI1183-304/CTD modeled complex. c Electrostatic surface; negatively charged (red), positively charged (blue) and hydrophobic (white). de Exploded views of the interface residues, displaying the ionic interactions (d), and hydrophobic non polar interactions (e). f Representation of the regions between INI1183-304/CTD showing a hydrophobic tunnel enclosed by ionic bonds at the two ends. In all panels, INI1183-304 and its residues are shown in pink, and IN-CTD and its residues are shown in blue. Orange dotted line with arrow represents the hydrophobic tunnel. PDB file of this docked model is included in Supplementary Data 1.
Fig. 3
Fig. 3. In vitro binding studies to validate the interacting interface residues predicted in the CTD/INI1183-304 complex.
a Sequence of a portion of S6/Rpt1 fragment of INI1 and the IN-interaction-defective substitution mutations (E3, E4, and E10) identified in a random genetic, reverse yeast two-hybrid screen and their effect on S6-mediated inhibition of HIV-1 particle production. b GST-pull down assay to demonstrate the binding of INI1183-304 and its mutants with IN, CCD and CTD. Representative images from one out of three experiment is shown. Top panel represents bound proteins and the bottom two panels represent the loading control. Top two panels represent the Western blot using α-BAF47 antibodies to detect 6His-SUMO-INI1183-304. Bottom panel represents the Coomassie-stained gel of GST-fusion proteins. c GST-pull down assay to determine the interaction of His6-IN(WT), His6-IN(W235E) mutant with GST-INI1, GST-SAP18, GST-LEDGF, and GST-Gemin2. Representative images from one out of three experiment is shown. Top panel represents the bound proteins and the two panels below the top represent the loading controls. Non-adjacent lanes from the same gel are spliced together for the figure and uncropped gels are provided in the source data. Graphs at the bottom represent quantitation of the bound proteins expressed as fraction bound after normalizing to the loading control. The graphs represent the mean of two independent experiments, WT is Wild type IN (shown in blue) and W235E is shown in red.
Fig. 4
Fig. 4. Quantitative Alpha protein-protein interaction assay to determine the interaction of IN, CTD, and the mutants with INI1 and INI1183-304.
a Interaction of GST-CTD with His6-SUMO-INI1183-304. A titration curve was generated with increasing concentrations of His6-SUMO-INI1183-304 with two different fixed concentration of GST-CTD and the interactions were detected as Alpha Score. The KD values were determined by nonlinear regression analysis using specific binding with Hill slope analysis in GraphPad Prism. Data from one representative experiment is depicted. b, c Effect of salt on the interactions of GST-CTD either with His6-SUMO-INI1183-304 or biotinylated(Bio)-TAR RNA (n = 3 independent experiments). The interaction was tested using fixed concentrations of GST-CTD (0.75 μM) and increasing concentrations of His6-SUMO-INI1183-304 (or Bio-TAR RNA) in two different NaCl conditions (100 and 500 mM); d, e Inhibition of GST-CTD interaction with His6-SUMO-INI1183-304 or Bio-TAR RNA (n = 6 independent experiments). Interactions were set up between GST-CTD (0.186 μM) with His6-SUMO-INI1183-304 (0.094 μM), or GST-CTD (0.03 μM) with Bio-TAR RNA (0.1 μM) and increasing concentration of the third component (indicated in the X-axis) was added to the reaction. The IC50 values were determined by fitting the data to a four-parameter dose-response curve using GraphPad prism. fh Interaction of GST-CTD and its substitution mutants with INI1183-304 and TAR RNA (n = 3 independent experiments). Representative Coomassie gel (from one out of three independent experiments) showing equal loading of the wild type and mutant proteins for the binding assays (f) and uncropped gels are provided in the source data. Interaction of GST-CTD and mutants with INI1183-304 (g), and with biotinylated-TAR RNA (h). The graphs represent the % of the interaction of mutants as compared to that of wild type (WT) IN set at 100%. For both panels (g) and (h), WT and mutants are represented in different colors as indicated in the key provided next to the bar graphs. In all panels, except in a, graphs represent Mean ± SEM. In all panels the pink cartoon Rpt1 represents INI1183-304, blue cartoon CTD, IN-CTD, and red stem-loop, TAR RNA.
Fig. 5
Fig. 5. INI1 competes with TAR RNA for binding to IN in vivo and facilitates particle production.
a Co-immunoprecipitation of INI1 with IN and mutants in vivo. MON cells were transfected with YFP-IN/IN mutants and HA-INI1, and then subjected to co-immunoprecipitation using α-HA antibodies. Representative images from one out of three independent experiments is shown. The top two panels illustrate results of co-immunoprecipitation using α-HA antibodies. The lower two panels represent the input control. Lanes 7-9 represent controls, use of isotype IgG antibody (lane 9) or lack of INI1 or IN (lanes 7-8). b RNA-co-IP analysis to determine the competition of INI1 and TAR RNA for binding to IN. The gel images are from one out of three representative experiments. The top three panels (i)–(iii) represent the RNA and proteins present in the immune complexes and the bottom three panels (iv)–(vi) represent proteins and RNA in the input controls. Panels (iii) and (vi), graphic representation of relative amounts of TAR RNA bound compared to control, as determined by qRT-PCR (n = 3 independent experiments), normalized to control (lane 2). Immunoprecipitation was carried out using isotype IgG antibody (lane 1) or α-GFP antibodies to pull down YFP-IN (lanes 2-7). Lane 3 represents negative control without YFP-IN. Lanes # 4-7 represent RNA-co-IP in the presence of increasing HA-INI1. c IN-interaction-defective INI1 mutant do not compete with TAR in vivo. The gel images are from one out of three representative experiments. Panels (i)–(vi) are as in b. Lanes represent results of RNA-co-IP of YFP-IN with TAR RNA in the presence of WT INI1 (lane 3), INI1(D225G) (lane 4), and INI1(D225E) (lane 5). d INI1 binding to IN is necessary for particle production. The top panel represents virus-associated and the middle panel represents the cell-associated p24, expressed as % of wild type. The bottom panel represents release efficiency as a fraction of viral- and cell-associated p24 of each mutant, as compared to wild type, expressed in %. EV = Empty vector; WT = wild type. The bars represent the average of three independent experiments (Mean ± SEM). The bars are color-coded as indicated in the key provided next to the graph. Uncropped gels/blots for all the images in this figure are provided in the source data.
Fig. 6
Fig. 6. Particle morphology and replication of INI1-interaction defective IN mutants.
a TEM analysis of wild type (WT) and R228A mutant HIV-1NL4-3 particles. Note the empty capsids with unpackaged RNP in R228A mutant. b Cryo electron tomography (CryoET) studies to demonstrate the defect in particle morphology of the virions harboring W235E mutations. Leftmost panel indicates CryoET structure of wild type (WT) particle. The rest of the panels indicate various particle morphologies observed in mutant virions. c IN binding is necessary for INI1 incorporation into HIV-1 virions. The gel images are from one out of three independent experiments. Immunoblot analysis of concentrated WT, W235E, or R228A HIV-1NL4-3 virions produced in 293 T cells. Top three panels represent immunoblot analysis of concentrated virions and the bottom three panels correspond to producer cell lysates. Western analysis was carried out using α-IN (to detect IN), α-p24 [to detect Capsid (CA, p24) and Gag (pr55)], α-BAF47 (to detect INI1) or α-GAPDH (as loading control) antibodies. Uncropped blots of this Western analysis are provided in the source data. dj Analysis of replication of W235E mutant. d Fluorescence microscopy images of CEM-GFP cells infected with HIV-1NL4-3 (25 ng p24 each) of WT or W235E mutant in a multiday infection. e Graphic illustration of virus particle release in the culture supernatant of the experiment in d, measured by p24 ELISA (Representative of two independent experiments). f Infectivity of HIV-1-Luc reporter virus harboring either a wild type (WT) or a W235E mutant integrase. The graph represents luciferase activity of infected cells, 24 hours post-infection (n = 3 independent experiments, Mean ± SEM). gi Graphic representation of effect of W235E IN mutations on early RT products (g), late RT products (h), and two LTR circles (i), as measured by qRT-PCR, at indicated times, post-infection. The data represent average of three independent experiments (n = 3 independent experiments, Mean ± SEM). j Graphic representation of effect of W235E mutant on integration as measured by Alu-Gag PCR at 24 h post-infection. Data are compared to WT and represents average of three independent experiments (n = 3 independent experiments, Mean ± SEM). Uncropped gels and raw data are provided in the source data.
Fig. 7
Fig. 7. Molecular docking studies to compare Rpt1 INI1183-304 and TAR binding to IN CTD.
a and c Surface representation of bound modeled complexes of CTD/Rpt1 and CTD/TAR. b and d Ribbon diagram showing interface residues of  CTD/INI1-Rpt1 and CTD/TAR complexes. INI1-Rpt1 cartoon and residue labels are shown in pink, CTD cartoon and residue labels are shown in blue, and TAR cartoon and nucleotide labels are shown in reddish-orange. Note that interacting phosphate groups, bases, and sugars are shown. e Orientations of the key residues on CTD after docking shown in magenta (interacting with INI1-Rpt1) or black (interacting with TAR). f Superimposition of the CTD/Rpt1 and CTD/TAR complexes shows the identical orientation of CTD and nice overlap of Rpt1 and TAR RNA regions. In all panels, IN-CTD is represented in bright blue, INI1-Rpt1 in pink, TAR RNA in orange colors respectively. PDB files of models in this figure are included in Supplementary Data 1.
Fig. 8
Fig. 8. TAR RNA mimicry of Rpt1 domain and model for role of INI1 during particle production.
a Surface electrostatic computation of INI1183-245 NMR structure indicating negatively (red) and positively (blue) charged and hydrophobic (white) residues. b and c Cartoon illustrating the similarity of INI1-Rpt1 to TAR RNA. Ribbon diagram of NMR structure of INI1 Rpt1 (left) where the side chains of all 11 negatively charged surface residues are depicted as red spheres, and that of TAR RNA where phosphate groups of the interacting nucleotides are depicted as red spheres. d Ribbon diagram of NMR structure of TAR RNA (PDB ID: 1ANR). e A model to understand the role of RNA mimicry of INI1 Rpt1 domain during HIV-1 assembly. Panel 1: In a producer cell where both INI1 and genomic RNA are present, INI1 acts as a place-holder and binds to IN portion of GagPol to prevent RNA binding to it, which otherwise may cause steric hindrance. Both RNA and INI1 are incorporated into the virions resulting in correct particle morphogenesis. Panel 2: RNA-interaction-defective and INI1-interaction-defective mutants of IN are impaired for binding to both RNA and INI1 and hence there is no steric hindrance for assembling GagPol. However, during particle maturation, lack of binding to RNA and/or INI1 could lead to morphologically defective particles, as shown in the empty conical capsid and unpackaged materials on the side of the capsid in the virion. Panel 3: Lack of INI1 leads to binding of RNA to IN portion of GagPol, which results in defective assembly and particle production. Gag (bright blue), RT (Reverse transcriptase; in blue), IN (wheat color), IN mutant (purple), INI1 (green), and HIV-1 RNA with TAR (red) are represented with the same colors both in the cells and in the virion particles, as indicated. Yellow, light green, and gray ovals represent possible INI1-binding proteins.

Similar articles

Cited by

References

    1. Savas S, Skardasi G. The SWI/SNF complex subunit genes: their functions, variations, and links to risk and survival outcomes in human cancers. Crit. Rev. Oncol./Hematol. 2018;123:114–131. doi: 10.1016/j.critrevonc.2018.01.009. - DOI - PubMed
    1. Kadoch C, Crabtree GR. Mammalian SWI/SNF chromatin remodeling complexes and cancer: mechanistic insights gained from human genomics. Sci. Adv. 2015;1:e1500447. doi: 10.1126/sciadv.1500447. - DOI - PMC - PubMed
    1. Kalpana GV, Marmon S, Wang W, Crabtree GR, Goff SP. Binding and stimulation of HIV-1 integrase by a human homolog of yeast transcription factor SNF5 [see comments] Science. 1994;266:2002–2006. doi: 10.1126/science.7801128. - DOI - PubMed
    1. Cano J, Kalpana GV. Inhibition of early stages of HIV-1 assembly by INI1/hSNF5 transdominant negative mutant S6. J. Virol. 2011;85:2254–2265. doi: 10.1128/JVI.00006-10. - DOI - PMC - PubMed
    1. Das S, Cano J, Kalpana GV. Multimerization and DNA binding properties of INI1/hSNF5 and its functional significance. J. Biol. Chem. 2009;284:19903–19914. doi: 10.1074/jbc.M808141200. - DOI - PMC - PubMed

Publication types

MeSH terms

LinkOut - more resources