. 2021 May 12;12(1):2751.
doi: 10.1038/s41467-021-23007-0.

Landscape of allele-specific transcription factor binding in the human genome

Affiliations

Landscape of allele-specific transcription factor binding in the human genome

Sergey Abramov et al. Nat Commun. .

Abstract

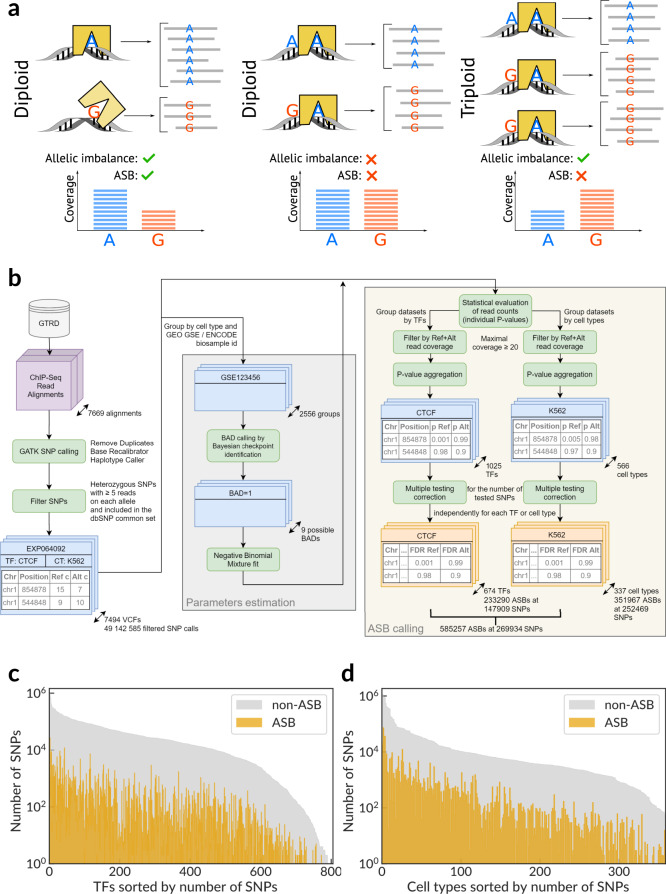
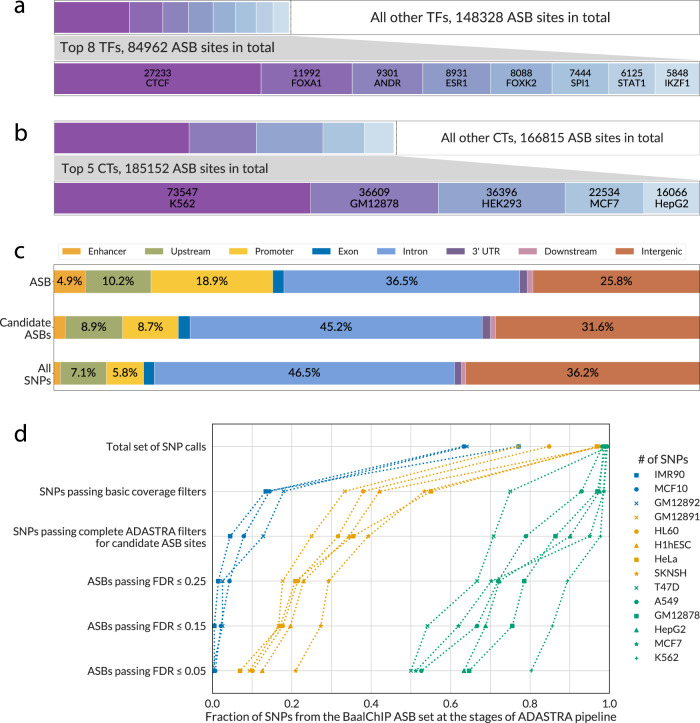
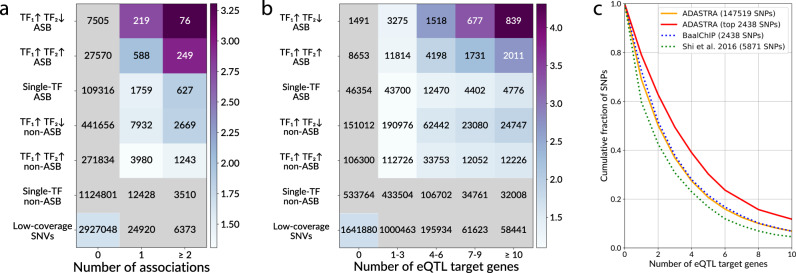
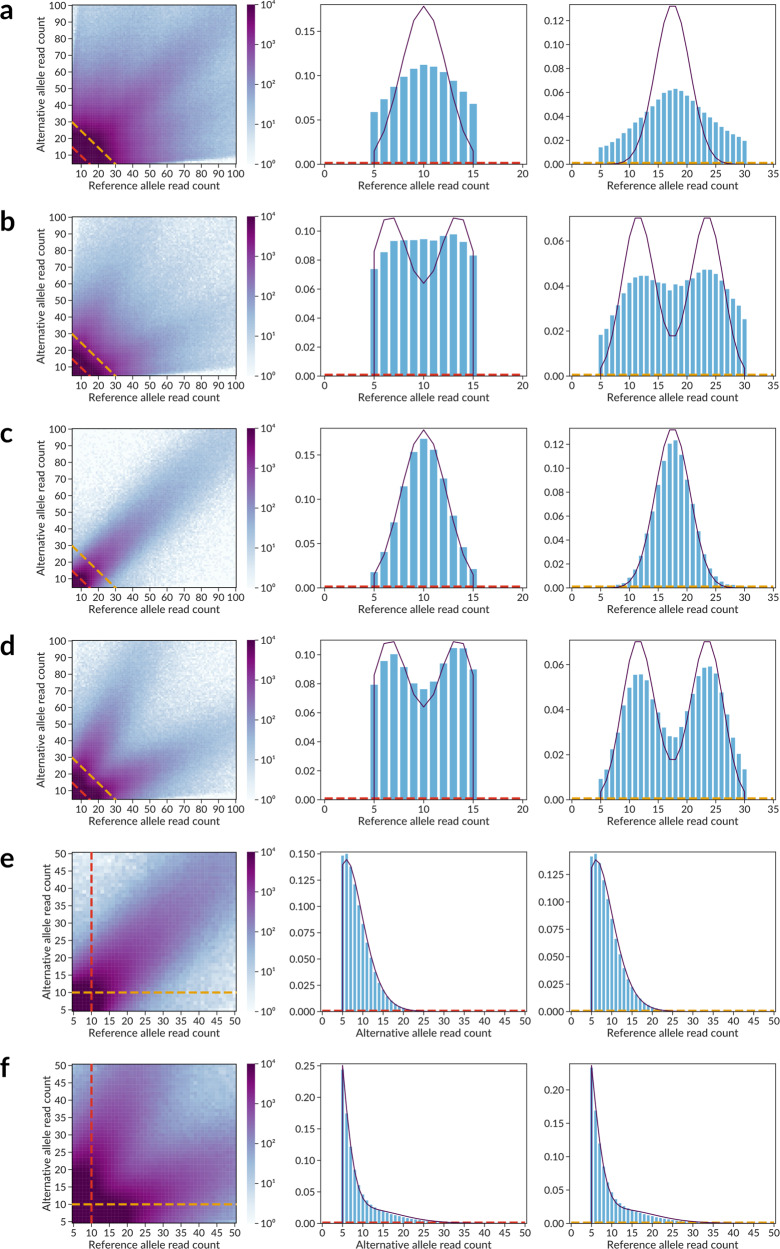
Sequence variants in gene regulatory regions alter gene expression and contribute to phenotypes of individual cells and the whole organism, including disease susceptibility and progression. Single-nucleotide variants in enhancers or promoters may affect gene transcription by altering transcription factor binding sites. Differential transcription factor binding in heterozygous genomic loci provides a natural source of information on such regulatory variants. We present a novel approach to call the allele-specific transcription factor binding events at single-nucleotide variants in ChIP-Seq data, taking into account the joint contribution of aneuploidy and local copy number variation, that is estimated directly from variant calls. We have conducted a meta-analysis of more than 7 thousand ChIP-Seq experiments and assembled the database of allele-specific binding events listing more than half a million entries at nearly 270 thousand single-nucleotide polymorphisms for several hundred human transcription factors and cell types. These polymorphisms are enriched for associations with phenotypes of medical relevance and often overlap eQTLs, making candidates for causality by linking variants with molecular mechanisms. Specifically, there is a special class of switching sites, where different transcription factors preferably bind alternative alleles, thus revealing allele-specific rewiring of molecular circuitry.


Conflict of interest statement

The authors declare no competing interests.

Figures

Fig. 1
Fig. 1. A scheme of allele-specific binding events, an overview of the ADASTRA pipeline, and its application to ChIP-Seq data.
a ChIP-Seq data allow detecting ASB events by estimating the imbalance of reads carrying alternative alleles. ASBs must be distinguished from sites where the allelic imbalance is caused by aneuploidy and copy-number variants. b The scheme of the ADASTRA pipeline: variant calling in read alignments from GTRD, estimation of statistical model parameters and background allelic dosage, filtering, and statistical evaluation of candidate ASBs. ADASTRA generates two complementary data sets: transcription factor ASBs (pairs of an SNP and a TF) and cell type ASBs (pairs of an SNP and a cell type). SNPs are annotated according to dbSNP IDs. c, d Number of SNPs (dbSNP IDs, Y-axis) with significant ASB events for various transcription factors and for various cell types. TFs or cell types (X-axis) are sorted by the number of SNPs. SNP single-nucleotide polymorphism, BAD background allelic dosage, ASB allele-specific binding, GTRD gene transcription regulation database, ADASTRA Allelic Dosage-corrected Allele-specific human Transcription factor binding sites.
Fig. 2
Fig. 2. Bayesian changepoint identification allows reconstructing reliable genome-wide maps of background allelic dosage from single-nucleotide variant calls.
a BAD calling with Bayesian changepoint identification applied to variant calls detected at chr2 and chr6 in K562 ENCODE data (ENCBS725WFV). X-axis: chromosome position, bp. Y-axis: the allelic imbalance of individual SNVs. Horizontal green lines (ground level of the plots) indicate results of the initial stage of the algorithm: the detection of SNV-free regions including deletions, telomeric, and centromeric segments. Horizontal light-blue lines: predicted BAD. Orange dashes: “ground truth” BAD according to the COSMIC data (when available). b Y-axis: SNV-level Kendall τb rank correlation between the predicted BAD and the “ground truth” BAD (COSMIC data). Each of 516 points denotes a particular group of related data sets of the same series (ENCODE biosample or GEO GSE ID) and the same cell type. X-axis: the number of SNV calls in a particular group of related data sets. Only SNVs falling into regions of known BAD (present in the COSMIC data) are considered, recurrent SNVs in several data sets are considered only once. c, d Receiver operating characteristic and precision-recall curves for predicted BAD maps used as binary classifiers of individual SNVs according to BAD vs the “ground truth” COSMIC data. To plot each curve, the score S = L(BAD = x) − maxyx L(BAD = y), where L denotes log-likelihood, was used as the prediction score for thresholding. Colored circles denote the values obtained with the final BAD maps where particular BAD values were assigned to each segment according to the maximum posterior. Regions with BAD of 1, 3/2, 2, and 3 contain more than 97% of all candidate ASB variants. SNP single-nucleotide polymorphism, SNV single-nucleotide variant, AD allelic dosage, BAD background allelic dosage, TPR true positive rate, FPR false positive rate.
Fig. 3
Fig. 3. An overview of the ADASTRA ASBs and their genomic localization.
a, b The distribution of ASBs across TFs and cell types is not uniform. The top 8 TFs and top 5 cell types provide only nearly one third (TFs) or one half (cell types) of significant events. The bottom bars in each pair show the zoomed-in data for the top 8 TFs and top 5 cell types sorted by descending number of ASBs. c The complete bars correspond to the full set of SNPs (unique dbSNP IDs) with significant ASBs. The ASBs are more often found in promoters and enhancers as compared to either SNVs with candidate ASBs or all detected SNVs. The percentage of ASB-carrying SNPs falling into particular types of genomic regions is shown on bar labels. Top bar: significant ASBs (passing 5% FDR, 269,934 sites in total); middle bar: SNPs with candidate ASBs (passing the coverage thresholds and tested for significance, 2,024,836 sites in total); bottom bar: all SNPs detected in the variant calling (4,976,303 sites in total). d The fraction of BaalChIP-reported SNPs (X-axis) with allele-specific binding passing the filters at various stages of the ADASTRA pipeline (Y-axis). We considered data from 14 cell lines matching between BaalChIP ASB set and ADASTRA (with the ADASTRA ASBs reaggregated considering only 316 data sets shared between BaalChIP and ADASTRA out of a total of 548 BaalChIP ChIP-Seq data sets). The following checkpoints of the ADASTRA pipeline were considered: 1 Total set of SNP calls: SNPs found by GATK; 2 SNPs passing basic coverage filter: SNPs with ≥5 reads supporting each of alternative alleles; 3 SNPs passing complete ADASTRA filters for candidate ASB sites: heterozygous dbSNP common SNPs with total coverage of at least 20 reads in at least one experiment located in a chromosome eligible for BAD estimation, i.e., with ≥100 SNP calls at stage 2; 4 ASBs passing a fixed FDR: cell type level aggregated ASBs passing a given FDR threshold (Benjamini–Hochberg-corrected P value allowing for BAD). ASB P values were estimated by logit aggregation of the one-tail Negative Binomial P values across the experiments (see “Methods”) and then the FDRs were estimated with Benjamini–Hochberg procedure. CT cell type, TF transcription factor, SNP single-nucleotide polymorphism, ASB allele-specific binding, FDR false discovery rate.
Fig. 4
Fig. 4. Motif annotation of SNPs agrees with TF-ASB calls.
a Scatterplot of the motif fold change (the predicted change in TF-binding affinity) vs the ASB significance for TFs that have PWMs in HOCOMOCO v11 core collection. The plot shows only the ASBs that overlap the TF motif occurrence (TF motif PWM hit with P value ≤ 0.0005). X-axis: signed ASB significance, the absolute value is max(−log10 FDR Ref-ASB, −log10 FDR Alt-ASB). The sign is set to negative if Ref-ASB is more significant than Alt-ASB (positive otherwise). Y-axis: motif fold change (FC) estimated as the log2-ratio of motif PWM hit P values between the reference and the alternative alleles (the positive value corresponds to a higher affinity to alternative allele). The SNPs are marked as concordant (discordant) and colored in blue (red) if they exhibit significant ASBs (FDR ≤ 0.05), have motif |FC| ≥ 2, and the preferred allele of the ASB corresponds to (is opposite to) that of the TF motif. ASB P values were estimated by logit aggregation of the one-tail Negative Binomial P values across the experiments (see “Methods”) and then the FDRs were estimated with Benjamini–Hochberg procedure. b The total number of discordant and concordant SNPs and the fraction of concordant SNPs among them (Y-axis) depending on the ASB significance cutoff, −log10 FDR (X-axis). c Barplot illustrating the proportion of SNVs with concordant and discordant ASBs for top 10 TFs with the largest total numbers of eligible SNVs. d The staveplot illustrating motif analysis of significant CEBPB ASBs. Each bead represents an SNV that is ASB and overlaps the predicted CEBPB binding site (P value ≤ 0.0005) and has motif |fold change| ≥ 2. The X-coordinate shows the SNV position in the motif (underlined by the motif logo), the individual dashed strings denote four possible minor alleles at each position, the bead color is defined by the major allele. The strand orientation of ASBs is aligned to the predicted motif hits. Y-axis shows the ASB effect size. SNP single-nucleotide polymorphism, ASB allele-specific binding, PWM position weight matrix.
Fig. 5
Fig. 5. ASBs are enriched with pathologic phenotype associations and eQTLs.
a, b Enrichment of ASBs among phenotype-associated and eQTL SNVs. Y-axis denotes several exclusive groups of SNPs: TF1↑TF2↓, SNVs carrying both Ref- and Alt-ASBs of different TFs, i.e., where at least two TFs prefer to bind alternating alleles; TF1↑TF2↑, SNVs carrying ASBs for at least two TFs preferring to bind the same allele; single TF, SNVs with ASB of a single TF; low-covered SNVs that did not pass a total coverage threshold ≥ 20. Non-ASBs are SNVs with the TF-ASB FDR > 0.05. X-axis: a the number of unique (dbSNP ID, trait, database) triples for a given SNV considering four databases of SNP-phenotype associations (EBI, ClinVar, PheWAS, and BROAD autoimmune diseases fine-mapping catalog); b the number of eQTL target genes according to GTEx eQTL data. The coloring denotes the odds ratios of the one-tailed Fisher’s exact test for the enrichment of SNVs with associations for each group of ASBs (against all other SNVs in the table). The gray cells correspond to nonsignificant enrichments with P > 0.05 after Bonferroni correction for the total number of cells. The values in the cells denote the numbers of SNVs. c The fraction of ASB SNPs from particular ASB collections (Y-axis) coinciding with GTEx eQTLs passing a certain threshold for the number of target genes (X-axis). Fourteen cell types overlapping between ADASTRA (solid orange line) and BaalChIP (dotted blue line) data have been considered: A549, GM12878, GM12891, GM12892, H1hESC, HL60, HeLa, HepG2, IMR90, K562, MCF10, MCF7, SKNSH, T47D. Data for HeLa and GM12878 cells were extracted from the Shi et al. collection (dotted green line). A subset of 2438 top-significant ADASTRA ASBs (the subset size equal to that of the BaalChIP set) is additionally shown to illustrate that these ASBs relatively more often coincide with potent eQTLs. SNP single-nucleotide polymorphism, SNV single-nucleotide variant, ASB allele-specific binding, eQTL expression quantitative trait loci.
Fig. 6
Fig. 6. Distribution of read counts at SNVs significantly depends on background allelic dosage.
Each panel contains three plots: (1, left) a heatmap of allelic read counts colored by log10[number of SNVs that have the specified number of ChIP-Seq reads] supporting the reference (X-axis) and alternative (Y-axis) alleles; (2, middle, 3, right) barplots of observed read counts at one of the alleles and the approximating distribution plot. Two barplots correspond to the two slices of the heatmap data, either by fixing the sum of reads at two alleles (ad, diagonal slices along the dashed lines in the bottom left corner, approximated by the binomial mixture) or by fixing the read counts at one of the alleles (e, f, vertical and horizontal slices, approximated by the negative binomial mixture). a Complete set of ADASTRA candidate ASB SNVs, no separation by BAD, the observed distribution can be interpreted as overdispersed binomial. b K562 candidate SNVs, the distribution is similar to an overdispersed mixture of binomial distributions with p=1/3 and p=2/3 as K562 are mostly triploid. c SNVs in diploid regions according to BAD = 1, binomial distribution with p=1/2. d SNVs in BAD-separated triploid regions (BAD = 2), binomial mixture with p=1/3 and p=2/3. e BAD-separated diploids (BAD = 1), negative binomial distribution with p=1/1 (fit). f BAD-separated triploids (BAD = 2), negative binomial mixture with p=1/3 and p=2/3 (fit). In all the cases the distributions are truncated, corresponding to the allelic read counts cutoff of 5. SNV single-nucleotide variant, ASB allele-specific binding, BAD background allelic dosage.

References

    1. Ponomarenko JV, et al. rSNP_Guide: an integrated database-tools system for studying SNPs and site-directed mutations in transcription factor binding sites. Hum. Mutat. 2002;20:239–248. doi: 10.1002/humu.10116. - DOI - PubMed
    1. Cavalli M, et al. Allele-specific transcription factor binding to common and rare variants associated with disease and gene expression. Hum. Genet. 2016;135:485–497. doi: 10.1007/s00439-016-1654-x. - DOI - PMC - PubMed
    1. PCAWG Drivers and Functional Interpretation Working Group et al. Analyses of non-coding somatic drivers in 2,658 cancer whole genomes. Nature578, 102–111 (2020). - PubMed
    1. Deplancke B, Alpern D, Gardeux V. The genetics of transcription factor DNA binding variation. Cell. 2016;166:538–554. doi: 10.1016/j.cell.2016.07.012. - DOI - PubMed
    1. Penzar DD, et al. What do neighbors tell about you: the local context of cis-regulatory modules complicates prediction of regulatory variants. Front. Genet. 2019;10:1078. doi: 10.3389/fgene.2019.01078. - DOI - PMC - PubMed

Publication types