. 2021 May 12;12(1):2764.
doi: 10.1038/s41467-021-22850-5.

Bidirectional propagation of low frequency oscillations over the human hippocampal surface

Affiliations

Bidirectional propagation of low frequency oscillations over the human hippocampal surface

Jonathan K Kleen et al. Nat Commun. .

Abstract

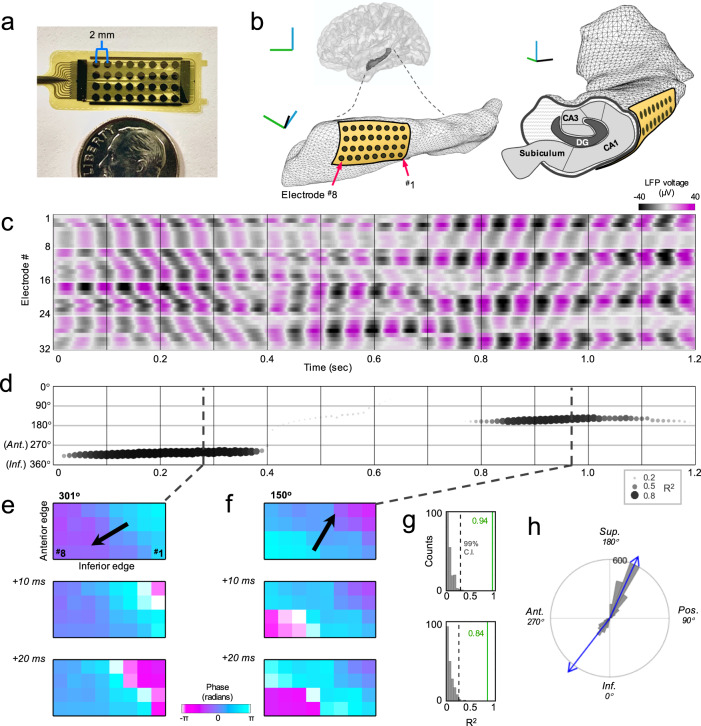
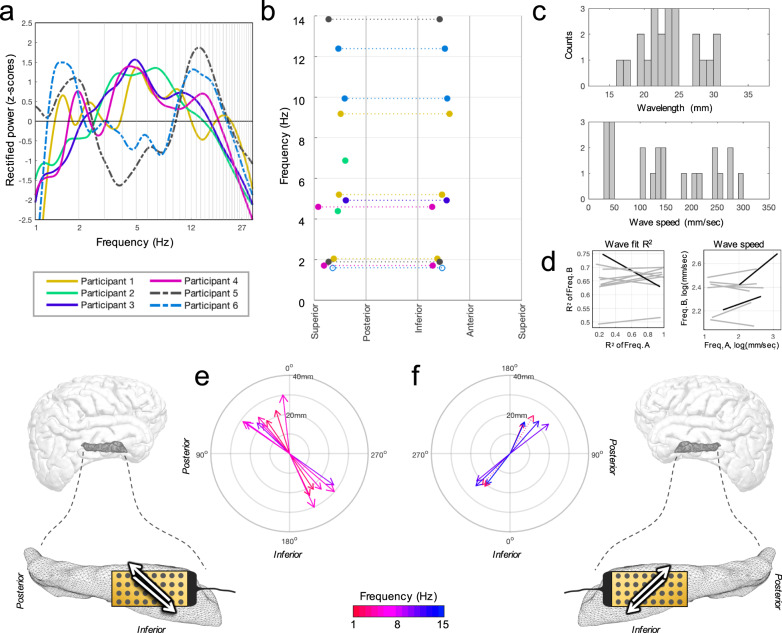
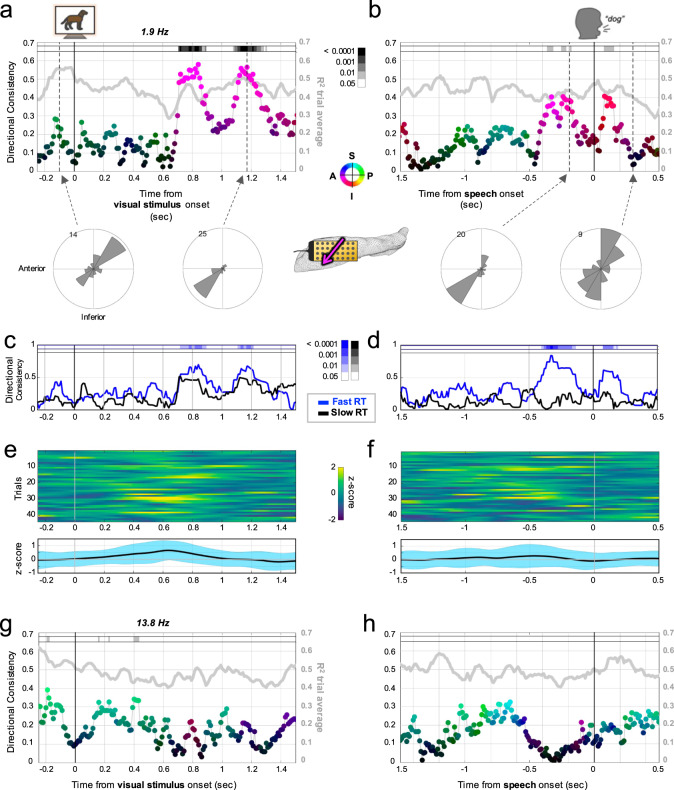
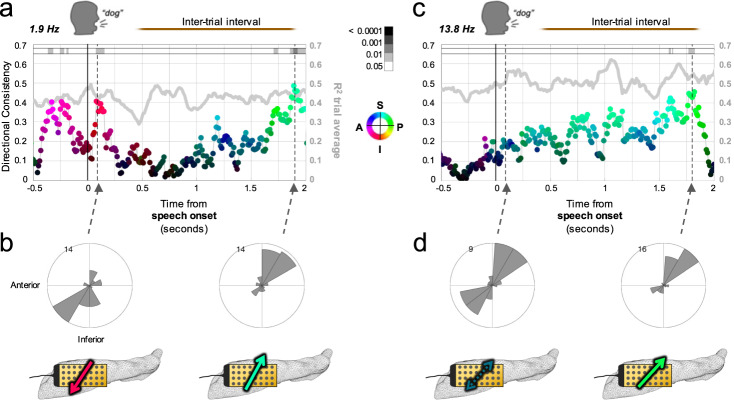
The hippocampus is diversely interconnected with other brain systems along its axis. Cycles of theta-frequency activity are believed to propagate from the septal to temporal pole, yet it is unclear how this one-way route supports the flexible cognitive capacities of this structure. We leveraged novel thin-film microgrid arrays conformed to the human hippocampal surface to track neural activity two-dimensionally in vivo. All oscillation frequencies identified between 1-15 Hz propagated across the tissue. Moreover, they dynamically shifted between two roughly opposite directions oblique to the long axis. This predominant propagation axis was mirrored across participants, hemispheres, and consciousness states. Directionality was modulated in a participant who performed a behavioral task, and it could be predicted by wave amplitude topography over the hippocampal surface. Our results show that propagation directions may thus represent distinct meso-scale network computations, operating along versatile spatiotemporal processing routes across the hippocampal body.


Conflict of interest statement

The authors declare no competing interests.

Figures

Fig. 1
Fig. 1. Bidirectional traveling oscillations over the hippocampal surface.
a Microgrid and connector (left) with dime for scale. b Lateral view of left hippocampus within 3D glass brain, and enlarged view (rotated) with approximate size and positioning of microgrid placement (blue line: superior, green: anterior, black: lateral). Coronal cross-section schematic of subfields at right. c Filtered LFP around example peak frequency (13.8 ± 1.5 Hz, awake Participant 5) in color scheme (microvolts), white lines separate grid rows. Cycle lags evident across consecutive electrodes suggest spatiotemporal wave travel. d Direction of TW in (c) calculated every 10 ms (size and shading: regression R2). In this segment, the oscillation initially travels antero-inferiorly, then directionality declines briefly (low R2) followed by a robust reemergence in a postero-superior route. e Instantaneous phase shown in grid orientation for consecutive timepoints (top panel: dotted line in (d)), phase gradient illustrating antero-inferior directionality. f Same as (e), for example, timepoints with postero-superior directionality. g Top and bottom panels show regression model R2 values (green) for upper panels in (e and f), respectively, shuffled distributions in gray (dotted line: 99% confidence interval). h Circular distribution of directions for this frequency for all baseline period timepoints (10° bins, blue arrows: modes; Inf: inferior, Pos: posterior, Sup: superior, Ant: anterior).
Fig. 2
Fig. 2. Propagating hippocampal oscillations among all participants.
a Rectified power spectra as channel means for each participant. Awake participants (left-sided; dotted lines) appeared to have stronger power in delta and alpha ranges while theta appeared stronger in anesthetized patients (right-sided). b Direction versus frequency among all participants with consolidated anatomic orientation. Dotted lines connect each bidirectional frequency (open circles: n.s., Hodges-Ajne test). c Distributions of wavelengths (top) and speeds (bottom) for all modal directions averaged across baseline periods. d Least squares lines (gray) are shown for Spearman correlations of wave fit (R2, left panel) and speed (right panel) for any two frequencies in the same participant (9 possible combinations; see Supplementary Table 3). Significant combinations (black; >99% CI) were uncommon. e TW predominant directions (arrows) for all uni- and bidirectional instances among right-sided participants (color: center frequency, length: wavelength). Supero-posterior and infero-anterior directions predominated, depicted as white arrows in the adjacent schematic (connector orientation in black). f Similar for left-sided participants, appearing anatomically mirrored between the hemispheres (compare to (e)).
Fig. 3
Fig. 3. Alignment of propagation direction across trials during a visual naming task.
a Directionality consistency values (DC; dots) across trials for the 1.9 Hz peak frequency in Participant 5 (n = 43 trials) with timepoints locked to the visual stimulus at time zero, colored as average direction of travel (circular mean, saturation proportional to maximum DC, direction according to color wheel: I: inferior, P: posterior, S: superior, A: anterior) over the hippocampal surface (pixels in lane at top: FDR-corrected Rayleigh test p-value, pFDR; see scale bar). The propagation strength across trials was estimated by mean R2 (gray superimposed line: separate y-axis at right) which was roughly similar when trials were aligned in direction or not (high or low DC). Directional distributions are shown below for two example timepoints (dotted lines). Roughly 700 ms after the stimulus waves abruptly begin to align antero-inferiorly across trials (strongest pFDR = 3.2−5, Rayleigh). b DC now locked to speech onset (time zero). Alignment of propagation across trials similar to (a) is evident again shortly before speech (strongest pFDR = 0.0243, Rayleigh) and resolves back to baseline levels after speech onset. c Trials in (a and b) were grouped by reaction time (fast or slow, median split). Fast reaction time trials increased in DC significantly after the stimulus (strongest pFDR = 0.0049, Rayleigh; see scale bars) and (d) around speech onset (strongest pFDR = 5.6−6, Rayleigh), whereas slow reaction time trials did not (empty pFDR lanes). e Trial rasters of analytic amplitude for the 1.9 Hz frequency described in (a), averaged across trials in bottom panel (mean: black trace; blue envelope: standard deviation) with a subtle increase peaking at ~600 ms, returning to baseline as DC in (a) begins to increase. f Similar to (e) now locked to speech onset (time zero) with amplitude staying roughly at baseline during DC changes in (b) (mean: black trace; blue envelope: standard deviation). g, h Illustrate the 13.8 Hz peak frequency (similar to (a) and (b)) in the same participant with limited DC value trends (strongest pFDR = 0.0119, Rayleigh) that dissipate by ~500 ms into trials.
Fig. 4
Fig. 4. Alignment of propagation direction during inter-trial intervals.
a Directionality consistency (DC; dots) values for the 1.9 Hz peak frequency in Participant 5 (n = 43 trials) locked to speech onset similar to Fig. 3b (same scale bars and direction color wheel), but extending 2 s into the inter-trial interval (gray line: mean R2 across trials with separate y-axis at right; shaded region: DC 95% CI for shuffled timepoints). After speech onset, the alignment across trials toward the temporal pole recedes and then reemerges, but aligned more toward the septal pole as the subsequent trial approaches. b Directional distributions for two example timepoints (dotted lines in (a), pFDR = 0.0243 and 0.0087, respectively, Rayleigh), illustrating the direction reversal. Bottom, anatomic schematics (left hippocampal microgrid, arrow color same as (a)) conveying average direction of wave travel over hippocampal surface at those timepoints. c Same as a for the 13.8 Hz frequency, with a low DC around speech onset (though usual quadrants predominate) followed by a steady increase in alignment more toward the septal pole as the subsequent trial approaches. d Directional distributions and schematics for two example timepoints marked by the dotted arrows in (c) (pFDR = 0.4583 and 0.0189, respectively, Rayleigh).
Fig. 5
Fig. 5. Topographic pattern of oscillation strength predicts propagation direction.
a Example of angle split procedure for the distribution of bimodal TW timepoints (Participant 5, 13.8 Hz oscillation). Timepoints having wave directions within a 45° spread of either mode were grouped into separate conditions. b Across participants, the frequency (n = 11) of a predominant (peak) oscillation did not predict whether it tended to propagate toward the temporal or septal pole more often, assessed by the ratio of total timepoints in each direction condition (left panel; p = 0.44, Spearman correlation, A-I: antero-inferior direction, P-S: postero-superior direction). Analytic amplitude (A.A.) differences between the anterior and posterior halves of the grid for these same frequencies (colored lines; compiled across participants) were not different between the two directions (right panel; p = 0.57, two-sided paired t-test; mean ± standard deviation). c Average channel amplitudes (dot size: mean z-score) across all timepoints split by condition, for example, frequency in (a), suggestive of distinct surface activity topography for each propagation direction. Contour lines overlaid are interpolated estimates of phase gradient offsets (circular mean across all condition timepoints) along the surface relative to electrode #12 (yellow star). d Probability density envelopes (10,000 iteration shuffled distributions, 4% bins) for SVM model classification accuracy among all peak frequencies across participants (chance: 50%, hatch marks: 99% CI) and actual/observed values (colored dots; see legend in (b)).

Similar articles

Cited by

References

    1. Moser MB, Moser EI. Functional differentiation in the hippocampus. Hippocampus. 1998;8:608–619. doi: 10.1002/(SICI)1098-1063(1998)8:6<608::AID-HIPO3>3.0.CO;2-7. - DOI - PubMed
    1. Fanselow MS, Dong H-W. Are the dorsal and ventral hippocampus functionally distinct structures? Neuron. 2010;65:7–19. doi: 10.1016/j.neuron.2009.11.031. - DOI - PMC - PubMed
    1. Dong H-W, Swanson LW, Chen L, Fanselow MS, Toga AW. Genomic-anatomic evidence for distinct functional domains in hippocampal field CA1. Proc. Natl Acad. Sci. USA. 2009;106:11794–11799. doi: 10.1073/pnas.0812608106. - DOI - PMC - PubMed
    1. Vogel JW, et al. A molecular gradient along the longitudinal axis of the human hippocampus informs large-scale behavioral systems. Nat. Commun. 2020;11:960. doi: 10.1038/s41467-020-14518-3. - DOI - PMC - PubMed
    1. Strange BA, Witter MP, Lein ES, Moser EI. Functional organization of the hippocampal longitudinal axis. Nat. Rev. Neurosci. 2014;15:655–669. doi: 10.1038/nrn3785. - DOI - PubMed

Publication types