. 2021 May 12;12(1):2746.
doi: 10.1038/s41467-021-22965-9.

PD-1 suppresses TCR-CD8 cooperativity during T-cell antigen recognition

Affiliations

PD-1 suppresses TCR-CD8 cooperativity during T-cell antigen recognition

Kaitao Li et al. Nat Commun. .

Abstract

Despite the clinical success of blocking its interactions, how PD-1 inhibits T-cell activation is incompletely understood, as exemplified by its potency far exceeding what might be predicted from its affinity for PD-1 ligand-1 (PD-L1). This may be partially attributed to PD-1's targeting the proximal signaling of the T-cell receptor (TCR) and co-stimulatory receptor CD28 via activating Src homology region 2 domain-containing phosphatases (SHPs). Here, we report PD-1 signaling regulates the initial TCR antigen recognition manifested in a smaller spreading area, fewer molecular bonds formed, and shorter bond lifetime of T cell interaction with peptide-major histocompatibility complex (pMHC) in the presence than absence of PD-L1 in a manner dependent on SHPs and Leukocyte C-terminal Src kinase. Our results identify a PD-1 inhibitory mechanism that disrupts the cooperative TCR-pMHC-CD8 trimolecular interaction, which prevents CD8 from augmenting antigen recognition, explaining PD-1's potent inhibitory function and its value as a target for clinical intervention.


Conflict of interest statement

The authors declare no competing interests.

Figures
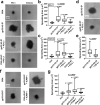
Fig. 1
Fig. 1. PD-1 inhibits T-cell spreading on surface co-presenting pMHC and PD-L1.
a Representative images by reflection interference contrast microscopy (RICM). PDCD1 −/− P14 transgenic CD8+ T cells re-expressing PD-1 (left column) or vehicle (right column) were added onto glass coverslip coated with BSA (1st row), gp33:H2-Db (2nd row), gp33:H2-Db and PD-L1 (3rd row), or OVA:H2-Kb and PD-L1 (4th row). Cell spreading was imaged by RICM 20 min after their addition. b Quantification of a showing reduced spreading of PD-1-expressing cells on surfaces co-presenting gp33:H2-Db and PD-L1 (n = 31, 31, 32, and 31 cells). c Quantification of a showing no change in spreading area of vehicle-expressing cells on surfaces co-presenting gp33:H2-Db and PD-L1 (n = 28, 37, 68, and 27 cells). d Representative RICM images showing the spreading of in vitro activated wild-type P14 transgenic CD8+ T cells expressing endogenous PD-1 20 min after adding onto glass coverslip coated with gp33:H2-Db (top) or gp33:H2-Db and PD-L1 (bottom). e Quantification of d showing reduced spreading of endogenous PD-1-expressing cells on surfaces co-presenting gp33:H2-Db and PD-L1 (n = 56 and 56 cells). f Representative RICM images showing the spreading of in vitro activated wild-type P14 transgenic CD8+ T cells 20 min after adding onto glass coverslip coated with BSA, gp33:H2-Db, gp33:H2-Db and ICAM-1, or OVA:H2-Kb and ICAM-1 (indicated). g Quantification of f showing larger spreading area on surfaces co-presenting gp33:H2-Db and ICAM-1 than on gp33:H2-Db or ICAM-1 surfaces alone (n = 62, 83, 61, and 56 cells). Data are presented by box-whisker plots with the center line labels median, the box contains the two middle quantiles, and the whiskers mark the min and the max. p values were calculated using Mann–Whitney test by comparing each group with BSA control or two groups as labeled.
Fig. 2
Fig. 2. 2D kinetic analysis of negative cooperativity.
a Schematic of the micropipette assay (top) and the molecules to be analyzed (middle). A T cell expressing TCR, CD8 and PD-1 (right) was tested against three RBCs bearing pMHC, PD-L1, or both (mix) in random order (left) to generate three adhesion frequencies (Pa’s), one for each RBC after 30-50 repeated touches with the T cell. The bottom row shows the workflow of using the three Pa’s to determine the bond numbers (<n> ’s) and the differential bond number (Δ <n>). b, d Representative Pa’s of individual in vitro activated P14 CD8+ T cells binding to RBCs coated with gp33:H2-Db, PD-L1, or both at 5-s (b) or 0.5-s (d) contact time. Data points measured by testing the same T cell against three RBCs bearing different ligands are connected by a dashed line. c, e Comparisons of predicted and measured <n>’s from b (c) and d (e), respectively. f Normalized change of bond number (Δ<n>/<n>pred). The reduction of bond formation observed at 5-s contact tests (n = 17 cells) was abolished when the contact time was shortened to 0.5 s (n = 8 cells). g Representative Pa’s of individual activated PDCD1−/− P14 CD8+ T cells to RBCs bearing gp33:H2-Db, PD-L1, or both at 5-s contacts. h Comparison of predicted and measured <n>’s from g. i Δ<n>/<n>pred showing the reduction of bond formation observed when PD-1 expressing cells were used was abolished when PDCD1−/− cells were used (n = 16 cells). Data are presented by box-whisker plots with the center line labels median, the box contains the two middle quantiles, and the whiskers mark the min and the max. p values were calculated using paired Student’s t test (c, e, h) or Mann–Whitney test (f, i).
Fig. 3
Fig. 3. Negative cooperativity depends on signaling of both PD-1 and TCR.
a, b Comparisons of normalized numbers of single-ligand bonds formed between PD-L1 (a, n = 42 and 14 cells) or pMHC (b, n = 27 and 14 cells) coated RBCs and in vitro activated T cells that were not treated (NT) or treated with 20 µM SHP1 and SHP2 inhibitor NSC87877 (SHP In). c Representative results comparing predicted and measured <n>’s determined from binding of NSC87822-treated T cells to RBCs bearing pMHC, PD-L1, or both. d Comparison of normalized bond reduction (Δ<n>/<n>pred) between the not treated and NSC87877-treated groups (n = 17 and 14 cells). eh Similar to ad except that the not treated group was replaced by the DMSO group and NSC87877 was replaced by the Lck inhibitor (2 µM). n = 14 and 15 cells in e. n = 14 and 16 cells in f. n = 14 and 16 cells in h. Data are presented by box-whisker plots with the center line labels median, the box contains the two middle quantiles, and the whiskers mark the min and the max. p values were calculated using paired t-test (c, g) or Mann–Whitney test (the rest).
Fig. 4
Fig. 4. Negative cooperativity can be explained by the PD-1 suppression of TCR-CD8 cooperativity.
a Comparison of normalized numbers of bonds formed between P14 CD8+ T cells and RBCs bearing gp33:H2-Db (n = 15 cells) or gp33:H2-Dbα3A2 (n = 21 cells) at 2-s contact time. b Representative experiment comparing predicted and measured <n>’s determined from binding of T cells to RBCs bearing gp33:H2-Dbα3A2, PD-L1, or both. c Comparison of normalized bond reductions (Δ<n>/<n>pred) between the gp33:H2-Db (n = 17 cells) and gp33:H2-Dbα3A2 (n = 12 cells) groups. d Schematics of the BFP setup (top) and the molecules to be analyzed (bottom). As an advanced version of the micropipette system, the BFP uses a glass bead to present pMHC, PD-L1, or both (left) to interact with the TCR, CD8, PD-1, or all of them (right). e Representative force-time trace recorded in a test cycle of a force-clamp assay. The level of clamped force and the duration of bond lifetime are indicated. f Plots of mean ± s.e.m. lifetime vs. mean force of single bonds of PD-L1, gp33:H2-Db, or gp33:H2-Dbα3A2 interaction with untreated P14 CD8+ T cells and of gp33:H2-Db interaction with Lck inhibitor-treated P14 CD8+ T cells. g Bond lifetime distributions of the molecular interactions in f at 3 pN showing as survival probability in semi-log plots. hm Comparisons between predicted and measured mean ± s.e.m. bond lifetimes (h, j, l; 3- and 6-pN bins) and their distributions (i, k, m; 3-pN bin). Untreated (hk) or Lck inhibitor-treated (l, m) CD8+ T cells expressing P14 TCR and PD-1 were analyzed by the force-clamp assay against BFP beads bearing PD-L1 plus gp33:H2-Db (h, i, l, m) or PD-L1 plus gp33:H2-Dbα3A2 (j, k) at 2-s contact time. The predictions were based on the percentages of single-bond events formed by each of the two ligands in each lifetime ensemble, as indicated for each pair of panels (hj and km), which were determined from the ligand densities coated on each group of beads and the TCR and PD-1 expressed on each batch of T cells. The bond lifetime distributions of two single-ligand bonds were also shown in i, k and m for comparison. The weighted sum of these single-specie bond lifetimes (distributions) were used to calculate the predicted lifetime (distribution). For the box-whisker plots in a and c, the center line labels median, the box contains the two middle quantiles, and the whiskers mark the min and the max. p values were calculated using Mann–Whitney test (a, c), paired t-test (b), or standard t-test (h, j, l). The sample sizes of bond lifetime events are summarized in Supplementary Table 1.
Fig. 5
Fig. 5. PD-1’s suppression of TCR-CD8 cooperativity requires CD8–Lck association.
Sorted P14 CD8CD4 (DN) thymocytes were transduced to express CD8 WT or SKSP mutant that abolishes Lck binding, followed by 2D kinetic analysis for negative cooperativity. a Representative CD4 vs CD8 plots of total P14 thymocytes showing the sorting strategy (left and middle) and purity (right) of DN thymocytes. b Representative histogram plot of retroviral-transduced P14 DN thymocytes expressing CD8 WT or SKSP mutant. c Comparison of normalized numbers of bonds formed between RBCs bearing gp33:H2-Db and P14 DN thymocytes transduced to express CD8WT or CD8SKSP (n = 17 and 15 cells) at 2-s contact time. d Comparison of normalized numbers of bonds formed between untransduced, CD8WT, or CD8SKSP P14 DN thymocytes and RBCs bearing gp33:H2-Db (n = 11, 11, and 11 cells) or gp33:H2-Dbα3A2 (n = 10, 10, and 12 cells) at 5-s contact time. e Comparison of normalized bond reductions (Δ<n>/<n>pred) between CD8WT and groups CD8SKSP (n = 16 and 17 cells). Data are presented by box-whisker plots (the center line labels median, the box contains the two middle quantiles, and the whiskers mark the min and the max) with the n values indicating the numbers of cells measured per condition. p values were calculated using Mann–Whitney test.
Fig. 6
Fig. 6. PD-1 suppressed antigen-triggered T cell Ca2+ signaling.
a, c Heat maps constructed using Ca2+ images from individual cells to show the signal dynamics. Activated PDCD1−/− P14 CD8+ T cells re-expressing PD-1 were loaded with the X-Rhod-1 calcium dye, placed on glass coverslips coated with gp33:H2-Db alone (a, n = 82 cells) or gp33:H2-Db plus PD-L1 (c, n = 47 cells), and imaged under a microscope with a 2-s frame interval for 20–30 min. Each row represents an individual cell aligned by their landing time to the glass surface and sorted from top to bottom with increasing Ca2+ signal strength. The pseudo-color represents normalized Ca2+ signal against base fluorescence. b, d Contour plots of images in a and c at indicated fold-increase. eg Quantification of ad showing percentages of cells (mean ± s.e.m.) with calcium peak above indicated levels of fold-increase (e), and box-whisker plots of the peak values (f) and area under curves (AUC) (g) of calcium time courses of individual cells with the center line labeling median, the box containing the two middle quantiles and the whiskers marking the min and the max. p values were calculated using standard t-test (e) or Mann–Whitney test (f, g).

References

    1. Okazaki T, Honjo T. PD-1 and PD-1 ligands: from discovery to clinical application. Int. Immunol. 2007;19:813–824. doi: 10.1093/intimm/dxm057. - DOI - PubMed
    1. Baumeister SH, Freeman GJ, Dranoff G, Sharpe AH. Coinhibitory pathways in immunotherapy for cancer. Annu. Rev. Immunol. 2016;34:539–573. doi: 10.1146/annurev-immunol-032414-112049. - DOI - PubMed
    1. Hashimoto M, et al. CD8 T cell exhaustion in chronic infection and cancer: opportunities for interventions. Annu. Rev. Med. 2018;69:301–318. doi: 10.1146/annurev-med-012017-043208. - DOI - PubMed
    1. Okazaki T, Maeda A, Nishimura H, Kurosaki T, Honjo T. PD-1 immunoreceptor inhibits B cell receptor-mediated signaling by recruiting src homology 2-domain-containing tyrosine phosphatase 2 to phosphotyrosine. Proc. Natl Acad. Sci. USA. 2001;98:13866–13871. doi: 10.1073/pnas.231486598. - DOI - PMC - PubMed
    1. Chemnitz JM, Parry RV, Nichols KE, June CH, Riley JL. SHP-1 and SHP-2 associate with immunoreceptor tyrosine-based switch motif of programmed death 1 upon primary human T cell stimulation, but only receptor ligation prevents T cell activation. J. Immunol. 2004;173:945–954. doi: 10.4049/jimmunol.173.2.945. - DOI - PubMed

Publication types

MeSH terms