. 2021 May 12;12(1):2759.
doi: 10.1038/s41467-021-22988-2.

Mechanical plasticity of collagen directs branch elongation in human mammary gland organoids

Affiliations

Mechanical plasticity of collagen directs branch elongation in human mammary gland organoids

B Buchmann et al. Nat Commun. .

Abstract

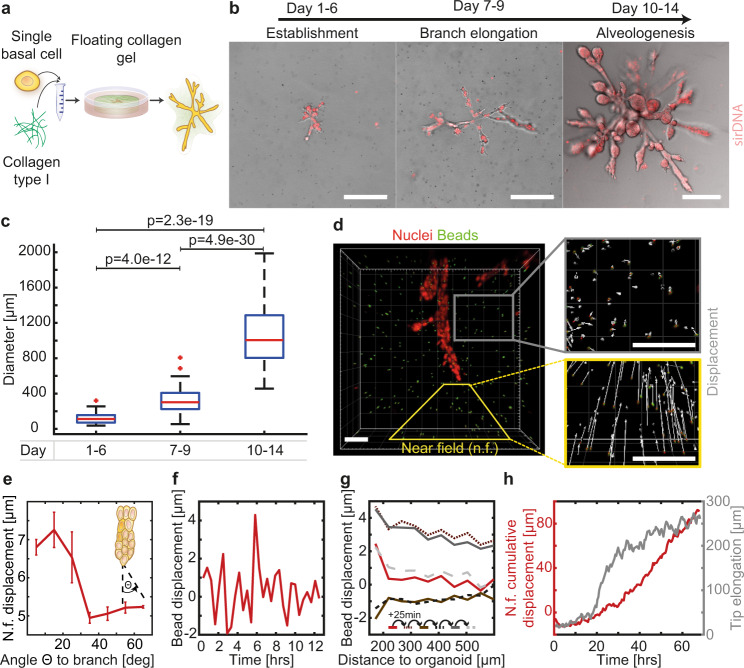
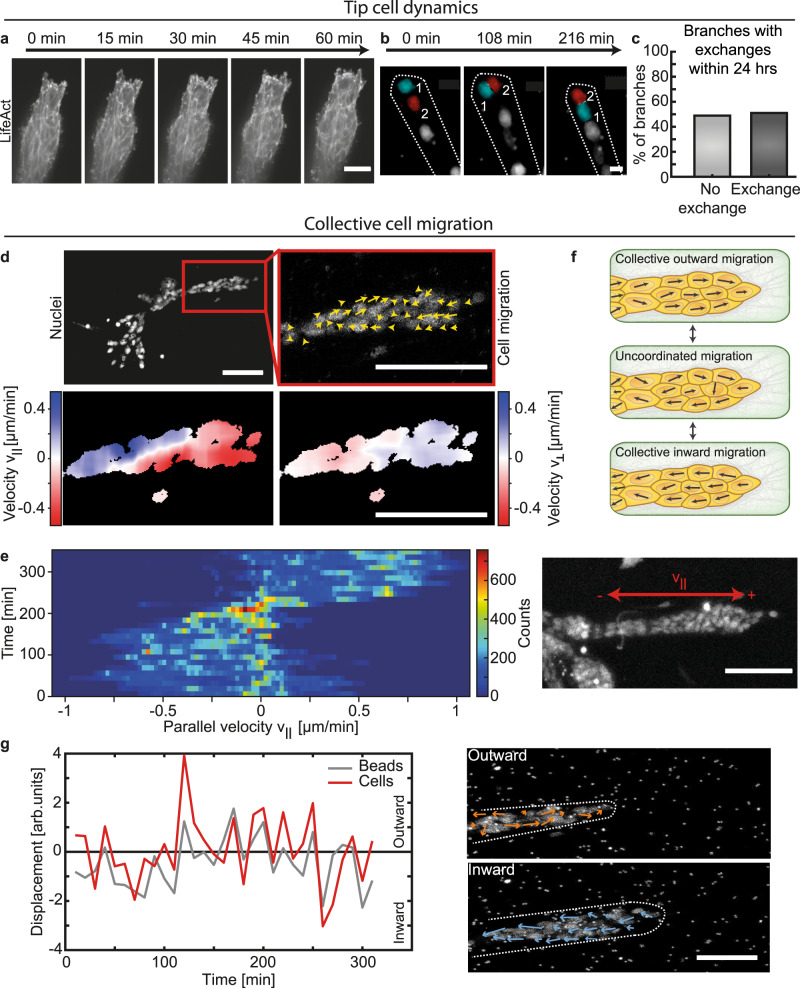
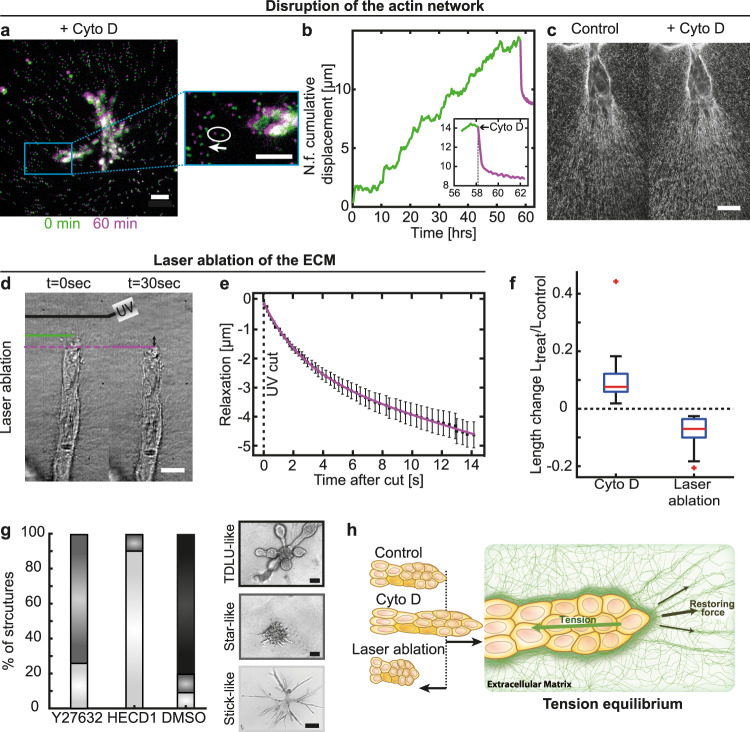
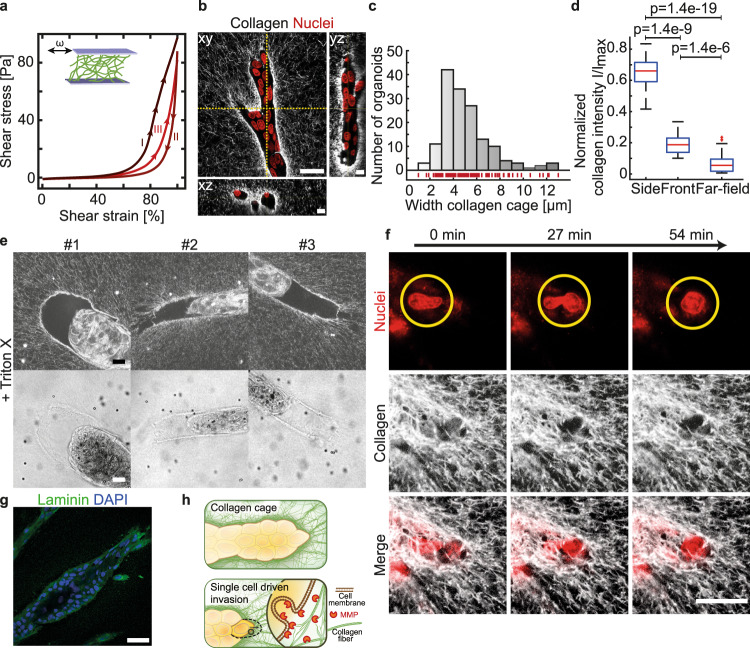
Epithelial branch elongation is a central developmental process during branching morphogenesis in diverse organs. This fundamental growth process into large arborized epithelial networks is accompanied by structural reorganization of the surrounding extracellular matrix (ECM), well beyond its mechanical linear response regime. Here, we report that epithelial ductal elongation within human mammary organoid branches relies on the non-linear and plastic mechanical response of the surrounding collagen. Specifically, we demonstrate that collective back-and-forth motion of cells within the branches generates tension that is strong enough to induce a plastic reorganization of the surrounding collagen network which results in the formation of mechanically stable collagen cages. Such matrix encasing in turn directs further tension generation, branch outgrowth and plastic deformation of the matrix. The identified mechanical tension equilibrium sets a framework to understand how mechanical cues can direct ductal branch elongation.


Conflict of interest statement

The authors declare no competing interests.

Figures

Fig. 1
Fig. 1. Human mammary gland organoids invade the ECM by non-continuous contractions.
a Schematic overview of 3D culture: single primary human basal mammary epithelial cells are cultured in floating collagen gels. b Characteristic organoid morphology at three developmental stages (Establishment n = 36 organoids, Branch elongation n = 75 organoids, Alveologenesis n = 111 organoids). Nuclei are visualized using sirDNA. c The organoid diameter of the long axis during the different stages reveals an increase in diameter during the elongation phase (Establishment n = 36 organoids, Branch elongation n = 75 organoids, Alveologenesis n = 111 organoids). Box plots indicate median (red line), 25th, 75th percentile (blue box) and 5th and 95th percentile (whiskers) as well as outliers (single points). d Live-cell imaging reveals an anisotropic deformation field with strong deformations in front of the branches and no deformation at the sides of the branches (n = 24 organoids). The near field (n.f.) is defined as area between the branch tip and the ECM 300 µm away from it. e The deformation is decreasing with increasing angle θ to the branch (n = 14 organoids). Error bars, mean ± s.d. f The bead displacement is non-continuous over time with contractions towards the branches and relaxations into the opposite direction (n = 14 organoids). g ECM contractions and relaxations slowly diminish with increasing distance to the organoid. Between each line 25 min passed, highlighting the alternations between contractions of the ECM towards the branches and relaxations away from them (n = 23 organoids). h The cumulative bead displacement in front of branches is increasing over time (red, n = 5 organoids), while the branch elongation is discontinuous in time (gray, n = 7 organoids). Scale bars, 200 µm (b), 70 µm (d). Organoids were derived from three biologically independent donors (Supplementary Table S1). P values are from a two-tailed Mann–Whitney test and provided in Supplementary Table S5. Source data are provided as a Source Data file.
Fig. 2
Fig. 2. Collective cell migration facilitates ECM deformations.
a LifeAct-GFP staining reveals dynamic remodeling of the actin network in the leading cells. Invadopodia of leader cells show dynamic interaction with the ECM throughout the invasion process. b During branch elongation leading cells (red cell, 2) exchange places with cell behind them (cyan cell, 1). c Within 24 h tip cell exchange was observed in about half of the branches analyzed (n = 47 organoids). d Internal collective cell migration (n = 16 organoids). Top panel: Nuclei channel representing the organoid morphology (left). Total velocity measurement of the cells inside the organoid reveals highly dynamic cells (right). Low panel: Velocity in parallel v (left) and orthogonal v direction (right) shows clusters of cells collectively moving in the same direction. e Cell velocity distribution within one branch of an organoid at day 12 over time. Only the velocity parallel to the branch is plotted. Signs are defined as depicted in the according nuclei channel. f Schematic overview of observed collective cell migration phases. g Bead and cell motion are both discontinuous in time and show periods of correlated phases, during which their direction is pointing in the same direction (n = 11 organoids). During highly correlated phases, outward pointing cell migration correlates with relaxations of the beads in front of the branch away from it. During inward pointing cell migration beads get pulled towards the organoid. Confocal shows a representative organoid at day 8. Scale bars, 100 µm (a, d, e, g), 10 µm (b). Organoids were derived from three biologically independent donors (Supplementary Table S1). Source data are provided as a Source Data file.
Fig. 3
Fig. 3. ECM deformations are enabled through a tension equilibrium.
a Upon treatment with Cytochalasin D organoid branches relax. Beads retract in the opposite direction of the initial deformation field (white arrow, n = 31 organoids). b Representative behavior of cumulative displacement in front of the branch during branch elongation (green) and relaxation upon treatment with Cytochalasin D (1 µg/ml, purple). c Fiber alignment in front of the branch is conserved after treatment with Cytochalasin D. d UV-cuts of the ECM in front of growing branches and following contraction of the branches towards the organoid body (n = 121 organoids). e Tracking the tip of a branch after a cut reveals a fast contraction towards the organoid body. Error bars, mean ± s.d. f After disruption of the actin network via Cytochalasin D the restoring forces of the ECM dominate, leading to branch elongation (n = 31 organoids). Contrary, after laser ablation, the dominating tension of the branch leads to branch shrinkage (n = 21 organoids). Box plots indicate median (red line), 25th, 75th percentile (blue box) and 5th and 95th percentile (whiskers) as well as outliers (single points). g Drug screening reveals loss of potential to grow TDLU-like structures upon Y-27632 (n = 31 organoids) and HECD1 (n = 10 organoids) treatment. h Tensile forces of the branches and the restoring forces of the aligned ECM lead to a tension equilibrium stabilizing the branches. Scale bars, 50 µm (a, inset a), 20 µm (c), 15 µm (d). Organoids were derived from three biologically independent donors (Supplementary Table S1). Source data are provided as a Source Data file.
Fig. 4
Fig. 4. Collagen is plastically remodeled by the invading epithelium resulting in a stable collagen cage.
a Cyclic shear rheology of collagen shows plastic remodeling. b Collagen accumulation around growing organoids visualized by fluorescent collagen. A high-resolution reconstruction can be seen in Supplementary Video 9. c Distribution of the collagen cage width (n = 153 organoids). d Collagen intensity in dependency of position (Side n = 25 organoids, Front n = 25 organoids, Far field n = 25 organoids). Box plots indicate median (red line), 25th, 75th percentile (blue box) and 5th and 95th percentile (whiskers) as well as outliers (single points). e Organoids treated with Triton X. Upper panel: The collagen cage retains its structure even after the collapse of the branch. Lower panel: The cage is visible in the bright field image. f During ECM invasion leader cells squeeze through pores at the invasive front. g Immunostaining of laminin at day 11 of organoid growth showed localized expression at the cell-ECM interface. h Schematic representation of the collagen cage and the invasion of the tip. Scale bars, 30 µm (b xy), 10 µm (b xz and yz, e), 20 µm (f), 50 µm (g). Organoids were derived from three biologically independent donors (Supplementary Table S1). P values are from a two-tailed Mann–Whitney test and provided in Supplementary Table S5. Source data are provided as a Source Data file.

Similar articles

Cited by

References

    1. Shah MM. Branching morphogenesis and kidney disease. Development. 2004;131:1449–1462. doi: 10.1242/dev.01089. - DOI - PubMed
    1. Whitsett JA, Kalin TV, Xu Y, Kalinichenko VV. Building and regenerating the lung cell by cell. Physiological Rev. 2019;99:513–554. doi: 10.1152/physrev.00001.2018. - DOI - PMC - PubMed
    1. Villasenor A, Chong DC, Henkemeyer M, Cleaver O. Epithelial dynamics of pancreatic branching morphogenesis. Development. 2010;137:4295–4305. doi: 10.1242/dev.052993. - DOI - PMC - PubMed
    1. Sternlicht MD. Key stages in mammary gland development: the cues that regulate ductal branching morphogenesis. Breast Cancer Res. 2005;8:201. doi: 10.1186/bcr1368. - DOI - PMC - PubMed
    1. Ochoa-Espinosa A, Affolter M. Branching morphogenesis: from cells to organs and back. Cold Spring Harb. Perspect. Biol. 2012;4:a008243–a008243. doi: 10.1101/cshperspect.a008243. - DOI - PMC - PubMed

Publication types