. 2021 May 12;12(1):2744.
doi: 10.1038/s41467-021-22960-0.

Functional and diffusion MRI reveal the neurophysiological basis of neonates' noxious-stimulus evoked brain activity

Affiliations

Functional and diffusion MRI reveal the neurophysiological basis of neonates' noxious-stimulus evoked brain activity

Luke Baxter et al. Nat Commun. .

Abstract

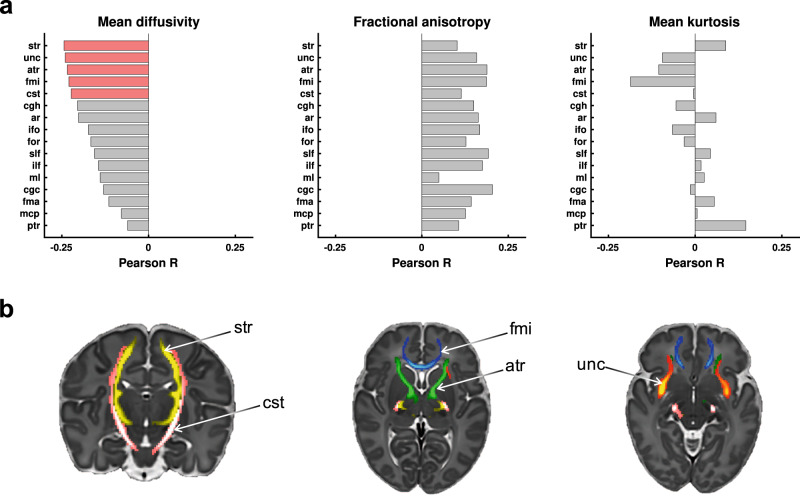
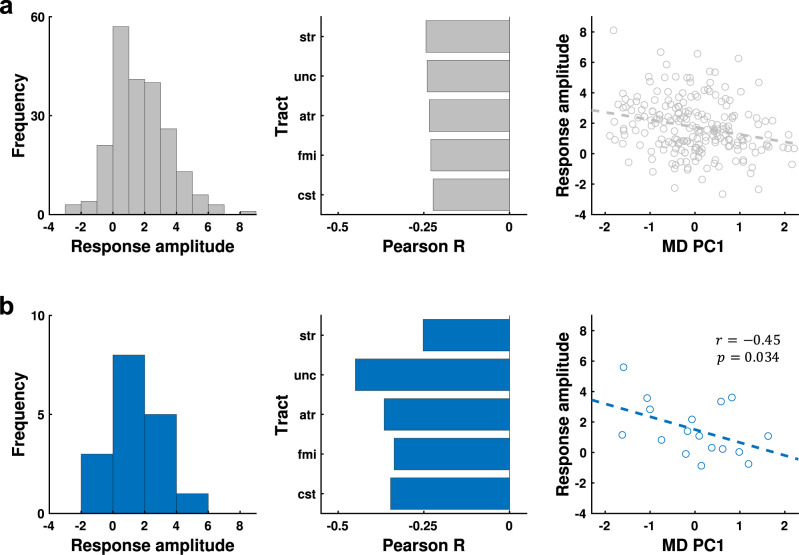
Understanding the neurophysiology underlying neonatal responses to noxious stimulation is central to improving early life pain management. In this neonatal multimodal MRI study, we use resting-state and diffusion MRI to investigate inter-individual variability in noxious-stimulus evoked brain activity. We observe that cerebral haemodynamic responses to experimental noxious stimulation can be predicted from separately acquired resting-state brain activity (n = 18). Applying this prediction model to independent Developing Human Connectome Project data (n = 215), we identify negative associations between predicted noxious-stimulus evoked responses and white matter mean diffusivity. These associations are subsequently confirmed in the original noxious stimulation paradigm dataset, validating the prediction model. Here, we observe that noxious-stimulus evoked brain activity in healthy neonates is coupled to resting-state activity and white matter microstructure, that neural features can be used to predict responses to noxious stimulation, and that the dHCP dataset could be utilised for future exploratory research of early life pain system neurophysiology.


Conflict of interest statement

The authors declare no competing interests.

Figures

Fig. 1
Fig. 1. Noxious-evoked response amplitudes.
A noxious-evoked response BOLD activity map is presented for each neonate (n = 18) and ordered according to the overall response amplitude. The maps are general linear model regression parameter maps (regression parameters are scaled according to colour bar). The anatomical reference (left) provides structural detail for orientation. All maps are displayed at this slice position to maximally emphasise the range of individual variability in response amplitudes. Unthresholded maps are used for visualisation to demonstrate the range of evoked response amplitudes from negative to negligible to positive amplitudes, without introducing the issues inherent to the application of arbitrary thresholds. The scalar value presented below each map is a summary measure that represents the overall noxious-evoked response amplitude relative to the group average. Source data are provided as a Source Data file.
Fig. 2
Fig. 2. Noxious-evoked responses are pain-relevant signals.
a The thresholded group average noxious-evoked map displays t-statistics in statistically significant clusters (t-statistics are scaled according to colour bar). Activity is localised to regions classically considered part of the adult nociceptive pain system, including the pre- and post-central gyri (pre/po), paracentral and superior parietal lobules (pcl and spl), opercular and insular cortices (oc and ic), and thalamus (thal). A, P, L, R = anterior, posterior, left, right. bi For each infant, expression of functional templates (x-axis) is assessed as whole-brain Pearson correlations between the template and neonates’ noxious-evoked response maps (y-axis). Group average template expression was assessed using two-tailed t-tests (n = 18). Grey and red dots represent the group mean correlation coefficient, with grey bars displaying 95% confidence intervals (CI). The templates used included one map derived from the current neonatal dataset (Noxious-evoked), seven Neurosynth maps (Visual to Arousal), and two pain subtype signature maps (NPS and Social). The thresholded noxious-evoked map (displayed in part a) is a positive control. Visual is the Neurosynth negative control, and Social Rejection Pain is the pain signature negative control. The Neurologic Pain Signature (NPS) and Neurosynth Pain and Nociceptive templates were significantly expressed in this group of neonates, while none of the negative controls or other Neurosynth templates were significantly expressed. ii-iii Using two-tailed Pearson correlation tests to assess inter-subject variability in noxious-evoked responses, associations exist between the overall noxious-evoked response amplitudes (regression parameters) and both NPS and Neurosynth Pain correspondences (correlation coefficients): NPS Pearson r = 0.77 (p = 0.0002), Neurosynth Pain Pearson r = 0.89 (p = 0.0001). The dashed grey line is the least squares fit. The stronger the neonatal BOLD response amplitude to the noxious stimulus, the closer the correspondence with both adult pain signatures. T-test and correlation test results for all templates are summarised in Table 1, and correlation plots for all Neurosynth and pain signature templates are displayed in Supplementary Fig. 9. Source data are provided as a Source Data file.
Fig. 3
Fig. 3. Nine resting-state networks replicated across two independent datasets.
Each resting-state network map is a thresholded group-level probabilistic functional mode (PFM) map identified in the locally collected noxious stimulation paradigm dataset (n = 18 subjects’ resting-state data) (top row, Local) and the age-matched dHCP dataset (n = 242 subjects’ resting-state data) (bottom row, dHCP). These PFM posterior probability maps are thresholded to highlight qualitative correspondence (means of posterior distributions are scaled according to colour bar). The scalar value shown between matched maps is the spatial Pearson correlation coefficient between unthresholded maps highlighting quantitative correspondence. VNm medial visual network, VNop occipital pole visual network, ANr right auditory network, ANl left auditory network, SMN somatomotor network, DMN default mode network, DAN dorsal attention network, ECN executive control network. Source data are provided as a Source Data file.
Fig. 4
Fig. 4. Predicting noxious-evoked response amplitudes from non-noxious data.
For all plots, each blue dot represents an out-of-sample cross-validated prediction for a single neonate (n = 18), and the dashed grey line is the y = x line along which perfect predictions would lie. The x-axis is the observed noxious-evoked response amplitude (after cross-validated confound regression), and the y-axis is the predicted noxious-evoked response amplitude. Predictions were generated based on three sets of predictors: (left) the resting-state network amplitudes; (middle) resting-state imaging confounds, which included head motion, CSF amplitude, and white matter amplitude; and (right) clinical variables, which included age (gestational, postmenstrual, and postnatal), birth weight, total brain volume, and sex. Source data are provided as a Source Data file.
Fig. 5
Fig. 5. Exploration of structure-function associations in the dHCP dataset.
The structural feature per white matter tract is the voxelwise mean diffusion parameter: mean diffusivity, fractional anisotropy, and mean kurtosis. The functional feature is the predicted noxious-evoked response amplitude, generated using the resting-state prediction model. a The three plots display the Pearson correlation coefficients (x-axis) between response amplitudes and diffusion parameters for all 16 white matter tracts (y-axis). The white matter tracts are ordered according to the mean diffusivity correlation coefficients for which statistically significant results were found (red). Statistical significance is FWER-corrected for multiple testing across all 48 Pearson correlation tests. b Maps displaying the five bilateral white matter tracts statistically significantly related to predicted noxious-evoked response amplitudes. ar acoustic radiation, atr anterior thalamic radiation, cgc cingulate gyrus part of the cingulum, cgh parahippocampal part of the cingulum, cst corticospinal tract, fma forceps major, fmi forceps minor, for fornix, ifo inferior fronto-occipital fasciculus, ilf inferior longitudinal fasciculus, mcp middle cerebellar peduncle, ml medial lemniscus, ptr posterior thalamic radiation, slf superior longitudinal fasciculus, str superior thalamic radiation, unc uncinate fasciculus. Source data are provided as a Source Data file.
Fig. 6
Fig. 6. Confirmation of negative associations between noxious-evoked response amplitudes and white matter mean diffusivities in the noxious stimulation paradigm dataset.
a Results using predicted responses in dHCP dataset (n = 215). b Results using observed responses in noxious stimulation paradigm dataset (n = 17). a, b Left: histograms display the frequency distributions of the noxious-evoked response amplitudes. Middle: bar plots displaying the Pearson correlation coefficients between noxious-evoked response amplitudes and MD for the five white matter tracts identified in the exploratory arm analysis (Fig. 5). Right: scatter plots displaying the negative correlation between noxious-evoked response amplitudes (y-axis) and MD PC 1 (x-axis). Due to the negative correlation observed in the exploratory test in the dHCP dataset (a), the confirmatory Pearson correlation test in the noxious stimulation paradigm dataset (b) was one-sided with hypothesised negative correlation. These cross-dataset consistencies confirm the exploratory arm findings and establish initial validation for the underlying resting-state prediction model. atr anterior thalamic radiation, cst corticospinal tract, fmi forceps minor, str superior thalamic radiation, unc uncinate fasciculus, MD PC1 mean diffusivity principal component 1, r Pearson correlation coefficient, p p-value associated with r. Source data are provided as a Source Data file.

Similar articles

Cited by

References

    1. Carbajal R, et al. Epidemiology and treatment of painful procedures in neonates in intensive care units. JAMA. 2008;300:60–70. doi: 10.1001/jama.300.1.60. - DOI - PubMed
    1. Lee, G. & Stevens, B. in Oxford Textbook of Paediatric Pain 353–369 (Oxford University Press, 2013).
    1. Hartley C, et al. The relationship between nociceptive brain activity, spinal reflex withdrawal and behaviour in newborn infants. Sci. Rep. 2015;5:12519. doi: 10.1038/srep12519. - DOI - PMC - PubMed
    1. Johnston CC, et al. Factors explaining lack of response to heel stick in preterm newborns. J. Obstet. Gynecol. Neonatal Nurs. 1999;28:587–594. doi: 10.1111/j.1552-6909.1999.tb02167.x. - DOI - PubMed
    1. Ranger M, Johnston CC, Anand KJS. Current controversies regarding pain assessment in neonates. Semin. Perinatol. 2007;31:283–288. doi: 10.1053/j.semperi.2007.07.003. - DOI - PubMed

Publication types

LinkOut - more resources