. 2021 May 12;12(1):2730.
doi: 10.1038/s41467-021-23025-y.

Non-invasive, opsin-free mid-infrared modulation activates cortical neurons and accelerates associative learning

Affiliations

Non-invasive, opsin-free mid-infrared modulation activates cortical neurons and accelerates associative learning

Jianxiong Zhang et al. Nat Commun. .

Abstract

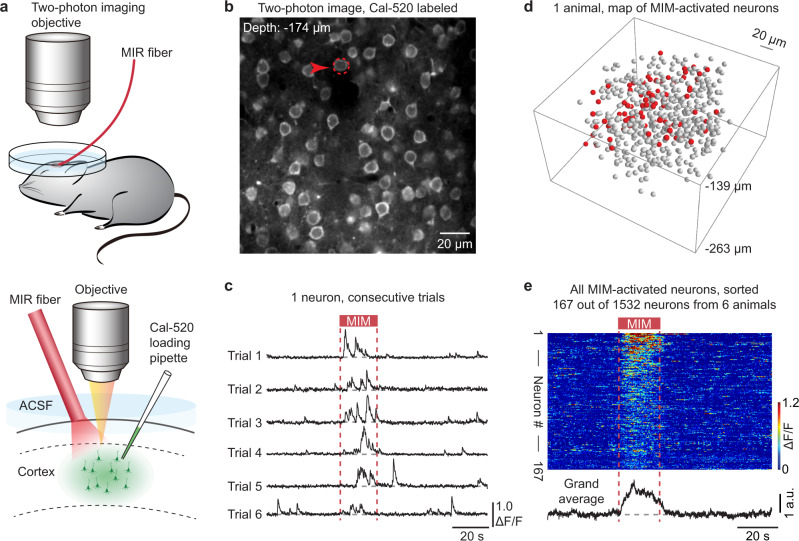
Neurostimulant drugs or magnetic/electrical stimulation techniques can overcome attention deficits, but these drugs or techniques are weakly beneficial in boosting the learning capabilities of healthy subjects. Here, we report a stimulation technique, mid-infrared modulation (MIM), that delivers mid-infrared light energy through the opened skull or even non-invasively through a thinned intact skull and can activate brain neurons in vivo without introducing any exogeneous gene. Using c-Fos immunohistochemistry, in vivo single-cell electrophysiology and two-photon Ca2+ imaging in mice, we demonstrate that MIM significantly induces firing activities of neurons in the targeted cortical area. Moreover, mice that receive MIM targeting to the auditory cortex during an auditory associative learning task exhibit a faster learning speed (~50% faster) than control mice. Together, this non-invasive, opsin-free MIM technique is demonstrated with potential for modulating neuronal activity.


Conflict of interest statement

The authors declare no competing interests.

Figures

Fig. 1
Fig. 1. MIM application to the mouse cortex induces neuronal activities.
a General scheme for targeted MIR delivery to mouse brain in vivo. b Left image: a confocal image of a postmortem slice near the MIR target spot. Right image: magnified view of the left image (gray dashed box). White dashed lines: outlining the cortical layers and the central zone of c-Fos+ expression, a commonly used marker of neuronal activation. c Control experiment with co-labeling of c-Fos and NeuN. White arrows: cells positive with both c-Fos and NeuN. d Histograms of the lateral (left) and transverse (right) distributions of c-Fos+ cells; data points are pooled from 7 mice. See Methods for definition of cell counts. e C-Fos+ cell count in slice samples taken from different groups of mice (n = 4) performed with different MIR irradiation time and conditions (through opened skull or thinned intact skull). P = 0.012 (Opened 5 s versus 10 s), P = 0.039 (Opened 10 s versus 20 s), P = 8.0054e−05 (Opened 20 s versus 60 s), P = 0.0121 (Opened 20 s versus Thinned 20 s), two-sided Wilcoxon rank-sum test, n.s. P > 0.05, *P < 0.05, **P < 0.01, ***P < 0.001, applies for all panels in this figure. f Schematic showing the MIR-VIS control experimental design. g Fluorescence images of slices taken at the MIR target spot (left) or the VIS target spot (right), both images taken from the same animal. h Boxplots showing the c-Fos+ cell count in the MIR- or VIS-exposed regions taken from the same 4 mice (8 slices taken for the MIR group, 13 slices taken for the VIS group, P = 1.0157e−04, two-sided Wilcoxon rank-sum test). i Local cortical tissue temperature elevation (n = 7 mice) at the site closest to the fiber tip, measured by a miniature thermocouple probe under MIR or VIS irradiation. Dashed line indicates 2 °C, below which light stimulation has previously been shown to not change or even suppress neuronal activities (P = 5.8275e−04, two-sided Wilcoxon rank-sum test). j Schematic for single-cell loose-patch recording simultaneously with MIM application in vivo. k Left image: the patch electrode and target cell under live two-photon imaging navigation in vivo. Right traces: three consecutive trials of loose-patch recording from one example neuron. l Upper raster plot: pooled single-trial spiking data from all 13 recorded neurons. Lower histogram: summary of spike count. m Boxplots summarizing 13 recorded neurons, showing spike count before (“Pre”), during (MIM) and after (“Post”) MIM application. P = 2.4414e−04 (Pre versus MIM), P = 0.0054 (MIM versus Post), two-sided Wilcoxon signed-rank test. The box-and-whisker plots indicate the median (central mark), 25th and 75th percentiles (bounds of box: Q1 and Q3), interquartile range (IQR: Q3–Q1), and the whiskers extending to the minima and maxima without considering outliers.
Fig. 2
Fig. 2. Spatiotemporal mapping of MIM-activated cortical neurons in vivo.
a Upper: cartoon showing the general scheme for the in vivo two-photon imaging experiments. Lower: cartoon showing the configuration of the MIR fiber tip, the two-photon imaging objective, and the Ca2+ dye loading micropipette. ACSF: artificial cerebrospinal fluid. b An example in vivo two-photon image (averaged 100 frames). The red arrow and the dashed circle indicate the neuron for which Ca2+ activity traces are shown in the next panel. c Ca2+ activity traces of an example neuron (marked in b) in six consecutive trials. The two red dashed lines indicate the start and the end of the MIM application. d A reconstructed 3D map showing the positions of all MIM-activated neurons (red balls) and unaffected neurons (gray balls) in the imaged volume, consisting of eight focal planes from one example mouse. e Upper: a pseudo-colored plot summarizing the trial-integrated Ca2+ activity trace for each neuron identified as MIM-activated. Neurons were sorted by their relative increment of activity level (from pre-MIM to MIM). Lower: a grand average of the Ca2+ activity traces for all 167 MIM-activated neurons.
Fig. 3
Fig. 3. MIM in the auditory cortex accelerates learning during a sound-licking associative training task.
a Schematic illustrating the general scheme for the experiments using MIM in a sound-water associative training task. b Detail of the experimental protocol for MIM application throughout the training sessions. c Left trace, an example behavior recording consisting of four consecutive trial events, in which the third event was a “miss” and the other three events were “success”. Right trace, enlarged view of one successful licking response event to illustrate how the response latency is determined. d Boxplots showing the latency of licking response for each group in each training session. “Control”: mice with no treatments (n = 13 mice), “MIM-opened”: mice with MIM applied through a small craniotomy (n = 14 mice), “MIM-thinned”: mice with MIM applied through thinned intact skull (n = 8 mice). e Boxplots showing data for each training session and each group, representing the success rate for sound-evoked licking response. f Fitted learning curve for each group, showing the data averaged across the animals in each group respectively. g Boxplots showing the learning speed inferred from the fitted learning curve. Each data point represents one animal whose learning curve was individually fitted. Values marked on group comparison links: Bayes factor BF10 (Bayes factor hypothesis testing, see “Methods” for details). BF10 = 0.242 (evidence of absence), BF10 = 3.634 (evidence of presence), BF10 = 11.489 (strong evidence of presence). The box-and-whisker plots indicate the median (central mark), 25th and 75th percentiles (bounds of box: Q1 and Q3), interquartile range (IQR: Q3-Q1), and the whiskers extending to the minima and maxima without considering outliers.

Similar articles

Cited by

References

    1. Sahakian B, Morein-Zamir S. Professor’s little helper. Nature. 2007;450:1157–1159. doi: 10.1038/4501157a. - DOI - PubMed
    1. Kortekaas-Rijlaarsdam AF, Luman M, Sonuga-Barke E, Oosterlaan J. Does methylphenidate improve academic performance? A systematic review and meta-analysis. Eur. Child Adolesc. Psychiatry. 2019;28:155–164. doi: 10.1007/s00787-018-1106-3. - DOI - PubMed
    1. Lange KW, Reichl S, Lange KM, Tucha L, Tucha O. The history of attention deficit hyperactivity disorder. Atten. Def. Hyp. Disord. 2010;2:241–255. doi: 10.1007/s12402-010-0045-8. - DOI - PMC - PubMed
    1. Lefaucheur JP, et al. Evidence-based guidelines on the therapeutic use of repetitive transcranial magnetic stimulation (rTMS) Clin. Neurophysiol. 2014;125:2150–2206. doi: 10.1016/j.clinph.2014.05.021. - DOI - PubMed
    1. Xuan W, Vatansever F, Huang L, Hamblin MR. Transcranial low-level laser therapy enhances learning, memory, and neuroprogenitor cells after traumatic brain injury in mice. J. Biomed. Opt. 2014;19:108003. doi: 10.1117/1.JBO.19.10.108003. - DOI - PMC - PubMed

Publication types

LinkOut - more resources