. 2021 May 12;11(1):9749.
doi: 10.1038/s41598-021-88870-9.

Dietary cis-9, trans-11-conjugated linoleic acid reduces amyloid β-protein accumulation and upregulates anti-inflammatory cytokines in an Alzheimer's disease mouse model

Affiliations

Dietary cis-9, trans-11-conjugated linoleic acid reduces amyloid β-protein accumulation and upregulates anti-inflammatory cytokines in an Alzheimer's disease mouse model

Yu Fujita et al. Sci Rep. .

Abstract

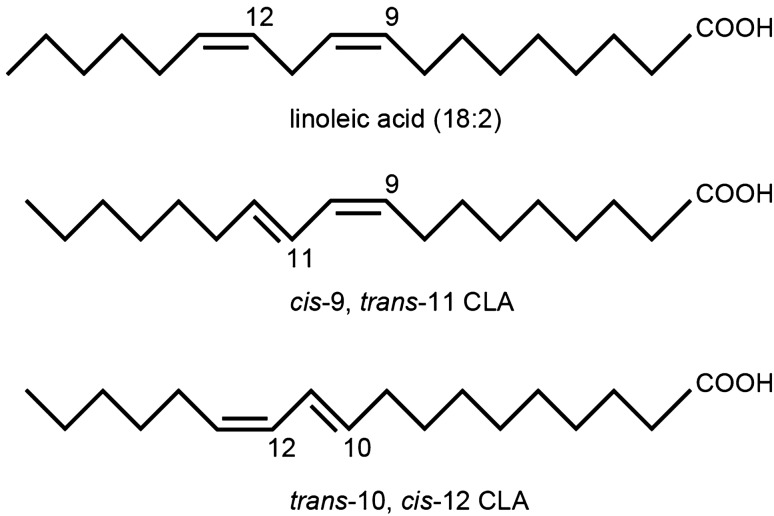
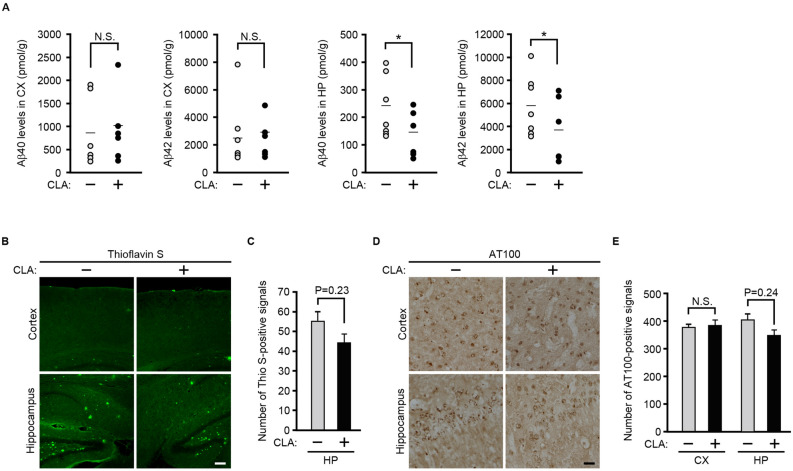
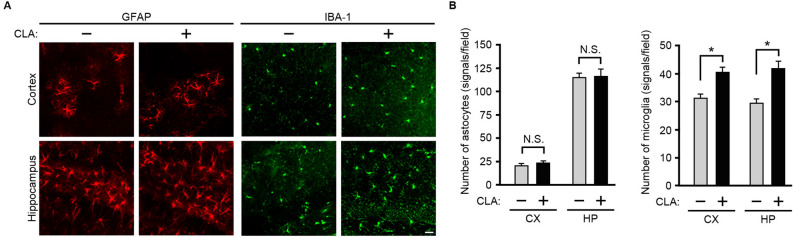
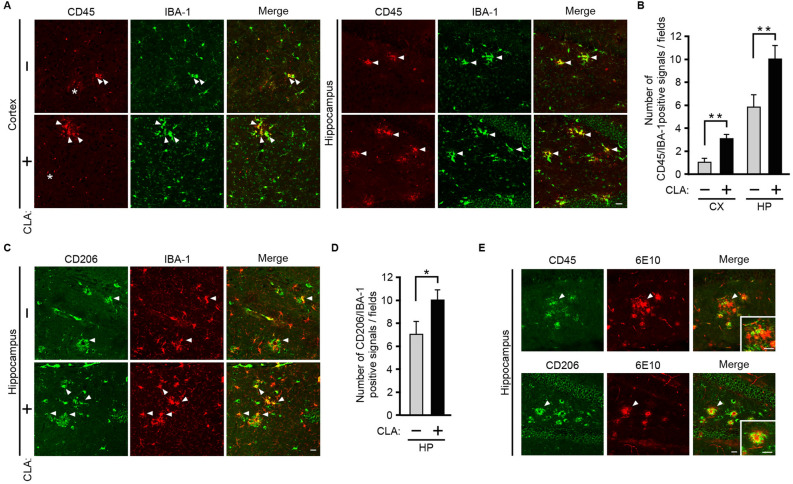
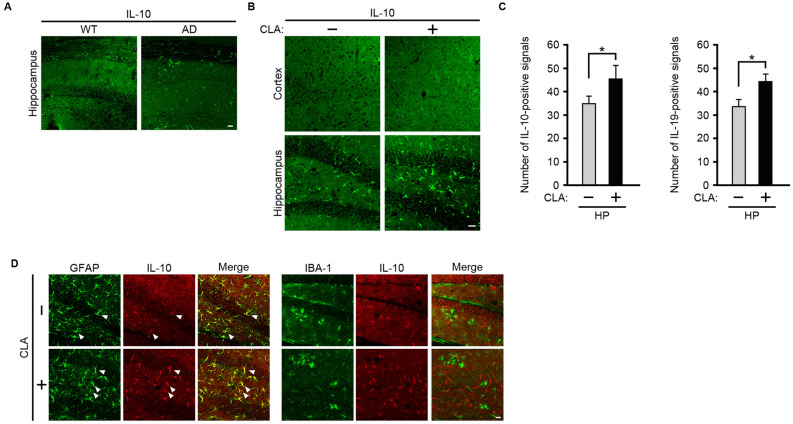
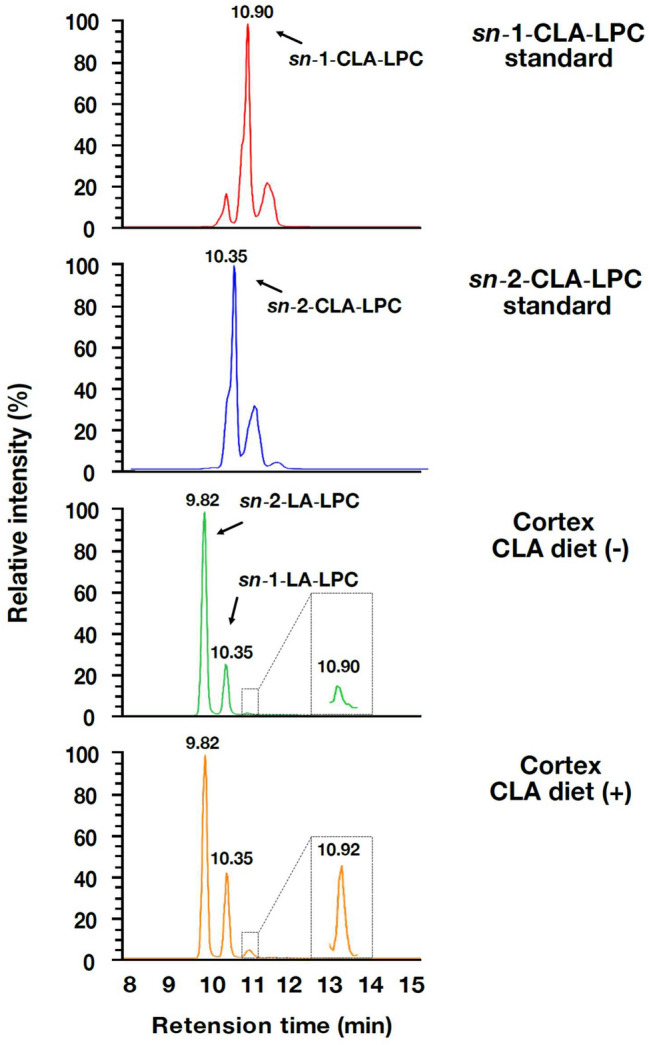
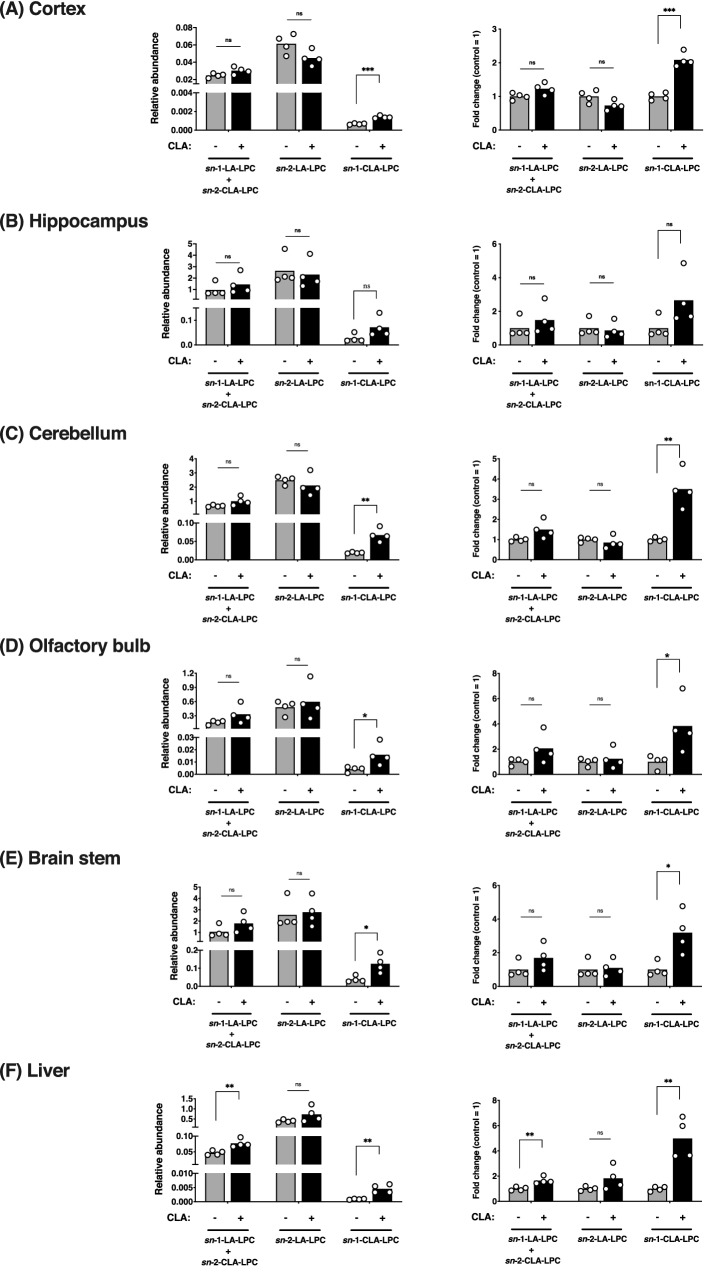
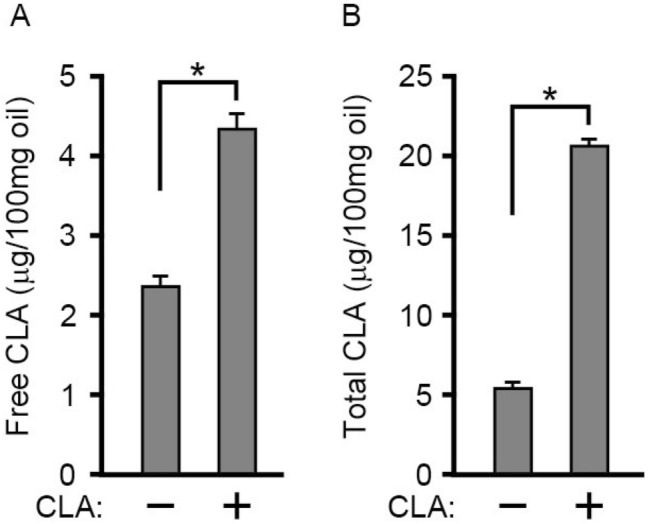
Conjugated linoleic acid (CLA) is an isomer of linoleic acid (LA). The predominant dietary CLA is cis-9, trans-11-CLA (c-9, t-11-CLA), which constitutes up to ~ 90% of total CLA and is thought to be responsible for the positive health benefits associated with CLA. However, the effects of c-9, t-11-CLA on Alzheimer's disease (AD) remain to be elucidated. In this study, we investigated the effect of dietary intake of c-9, t-11-CLA on the pathogenesis of an AD mouse model. We found that c-9, t-11-CLA diet-fed AD model mice significantly exhibited (1) a decrease in amyloid-β protein (Aβ) levels in the hippocampus, (2) an increase in the number of microglia, and (3) an increase in the number of astrocytes expressing the anti-inflammatory cytokines, interleukin-10 and 19 (IL-10, IL-19), with no change in the total number of astrocytes. In addition, liquid chromatography-tandem mass spectrometry (LC-MS/MS) and gas chromatographic analysis revealed that the levels of lysophosphatidylcholine (LPC) containing c-9, t-11-CLA (CLA-LPC) and free c-9, t-11-CLA were significantly increased in the brain of c-9, t-11-CLA diet-fed mice. Thus, dietary c-9, t-11-CLA entered the brain and appeared to exhibit beneficial effects on AD, including a decrease in Aβ levels and suppression of inflammation.


Conflict of interest statement

The authors declare no competing interests.

Figures

Figure 1
Figure 1
Structure of linoleic acid and its two main conjugated derivatives. CLA is normally generated by symbiotic bacteria in the stomach of ruminant animals. The predominant isomer in dietary sources is cis,trans-11-CLA ( c-9, t-11-CLA) (second panel), which constitutes up to ~ 90% of total CLA, Trans-10, cis-12-CLA (t-10, c-12-CLA) (bottom panel) is another common isomer that accounts for 1–10% of total CLA in dietary sources,.
Figure 2
Figure 2
The c-9, t-11-CLA diet reduces Aβ40 and Aβ42 levels in the hippocampus of AD model mice. (A) Aβ40 and Aβ42 levels were measured with ELISA using lysates of the cortex and hippocampus of c-9, t-11-CLA diet-fed AD model mice (CLA +) and control diet-fed AD model mice (CLA −). Aβ40 and Aβ42 levels in the hippocampus of c-9, t-11-CLA diet-fed mice were significantly decreased (right graphs) compared with controls, but were not significantly changed in the cortex (left graphs). Bars show the average value (n = 6 mice for each group). *P < 0.05 (Aβ40, P = 0.032; Aβ42, P = 0.031). (B) Thioflavin-S staining of brain sections of c-9, t-11-CLA diet-fed and control diet-fed AD model mice. The number of thioflavin-S-positive signals (green) tended to decrease in the hippocampus, but the positive signals were rarely detected in the cortex. (C) The histograms show the number of thioflavin-S-positive signals in the hippocampus. (n = 6 mice for each group; five different fields per mouse were used for counting of the positive signals). (D) Immunostaining of the brain sections of c-9, t-11-CLA diet-fed and control diet-fed AD model mice with AT100 antibody. The number of AT100-positive signals in the hippocampus of c-9, t-11-CLA diet-fed mice tended to decrease but no difference was seen in the cortex. (E) The histograms show the number of AT100-positive signals (n = 6 mice for each group; eight fields per mouse were counted). CX: cortex, HP: hippocampus. Bar, 50 µm. CLA + : c-9, t-11-CLA diet-fed AD model mice. CLA − : control diet-fed AD model mice.
Figure 3
Figure 3
Effect of the c-9, t-11-CLA diet on the number of microglia and astrocytes in the brain of AD model mice. (A) Immunostaining of the brain sections of c-9, t-11-CLA diet-fed and control diet-fed AD model mice with anti-GFAP (astrocyte marker) and anti-IBA-1 antibodies (microglia marker). The number of IBA-1 (green)-positive signals was significantly increased in the cortex and hippocampus of c-9, t-11-CLA diet-fed mice compared with the control (right panels), whereas the number of GFAP (red)-positive signals was not changed (left panels). (B) The histograms show the numbers of GFAP-positive and IBA-1-positive signals (n = 6 mice for each group; five different fields per mouse were used to count the number). GFAP: glial fibrillary acidic protein; IBA-1: ionized calcium binding adaptor molecule 1. Bar, 20 µm. **P < 0.01 (cortex, P = 7.3 × 10−8; hippocampus, P = 3.8 × 10−5).
Figure 4
Figure 4
The c-9, t-11-CLA diet increased the number of CD45+ and CD206+ microglia. (A) Double immunostaining of brain sections of c-9, t-11-CLA diet-fed and control diet-fed AD model mice with anti-CD45 and anti-IBA-1 (microglia marker) antibodies. A portion of IBA-1 (green)-positive cells were CD45 (red)-positive as shown by the yellow color (right merged panels). The arrows indicate the representative CD45 (red)-and IBA-1 (green)-positive cells as shown by yellow color (right merged panels). Small red dots (representatives marked with an asterisk) were nonspecifically stained as judged from the staining of the brain sections without the 1st antibody. Bar, 20 µm. WT: wild-type mice, AD: AD model mice. CLA + : c-9, t-11-CLA diet-fed AD mouse model; CLA − : control diet-fed AD model mice. (B) Histograms show the numbers of CD45-positive and IBA-1-positive signals (n = 6 mice for each group; five different fields per mouse were counted). **P < 0.01 (hippocampus, P = 0.01; cortex, P = 0.0097). (C) Double immunostaining of brain sections in hippocampus of c-9, t-11-CLA diet-fed and control diet-fed AD model mice with anti-CD206 and anti-IBA-1 (microglia marker) antibodies. The arrows indicate the representative CD206 (red)-and IBA-1 (green)-positive cells as shown by yellow color (right merged panels). Brain sections in the cortex was not clearly immunostained with anti-CD206 antibody (data not shown). (D) Histograms show the numbers of CD206-positive and IBA-1-positive signals (n = 6 mice for each group; five different fields per mouse were counted). (E) CD45+ and CD206+ microglia were co-localized with Aβ deposits. The brain sections in hippocampus of c-9, t-11-CLA diet-fed AD model mice were doubly immunostained with anti-CD45 (green) and anti-Aβ (red) antibodies (upper panels) or anti-CD206 and anti-Aβ (red) antibodies (lower panels). The arrow indicates the representative CD45 (green)- or CD206- and 6E10 (red)-positive cells as shown by yellow color (right merged panels). 6E10 was used for the anti-Aβ (red) antibody. The insets in right panels show the magnified pictures indicated by arrows. Bar, 20 µm.
Figure 5
Figure 5
The c-9, t-11-CLA diet upregulates the number of IL-10- or IL-19-expressing astrocytes in the hippocampus of AD model mice. (A) Immunostaining of brain sections of wild-type and AD model mice with anti-IL-10 antibody. (B) Immunostaining of c-9, t-11-CLA diet-fed and control diet-fed AD model mice with anti-IL-10 antibody. IL-10 (green)-positive cells were significantly increased in the hippocampus of c-9, t-11-CLA diet-fed AD model mice compared with controls (lower panels). IL-10 (green)-positive cells were not observed in the cortex (upper panels). (C) The histogram shows the number of IL-10-positive cells (left panel) and IL-19-positive cells (right panel) in the hippocampus. (n = 6 mice for each group; three different fields per mouse were used to count the number). *P < 0.05 (IL-10, P = 0.023; IL-19, P = 0.04). HP: hippocampus (D) Double immunostaining of brain sections in the hippocampus of c-9, t-11-CLA diet-fed and control diet-fed AD model mice with anti-GFAP (astrocyte marker), anti-IBA-1 (microglia marker), and anti-IL-10 antibodies. A portion of GFAP (green)-positive cells were IL-10 (red) positive as shown by yellow color (left merge panels), but IBA-1 (green)-positive cells were not co-localized with IL-10 (red)-positive cells (right merge panels). The arrows indicate the representative GFAP (green)- and IL-10 (red)-positive cells as shown by yellow color (right merged panels). Bar, 20 µm. WT: wild-type mice, AD: AD model mice. CLA + : c-9, t-11-CLA diet-fed AD mouse model, CLA − : control diet-fed AD model mice.
Figure 6
Figure 6
LC–MS/MS analysis of synthetic sn-1- and sn-2-CLA-LPC. Synthetic sn-1-CLA-LPC (top panel), synthetic sn-2-CLA-LPC (second panel from the top), the LPC peak area of the cortex lysate from control diet-fed mice (third panel from the top), and the LPC peak area of the cerebellum lysate from CLA diet-fed mice (bottom panel) were detected with LC–MS/MS analysis. Synthetic sn-1-CLA-LPC corresponded to the extra peak with a delayed retention time following the two peaks of LA-LPC (sn-1-LA and sn-2-LA. See) observed in the cortex, whereas the peak of sn-2-CLA-LPC corresponded to that of sn-1-LA-LPC.
Figure 7
Figure 7
The c-9, t-11-CLA-LPC level in the brain was increased by the c-9, t-11-CLA diet. The LPC peaks in the various brain regions and the liver were detected with LC–MS/MS analysis. Relative abundance is shown as the area ratio per tissue weight (g) (left panel), and the fold change was indicated as the relative ratio of the peak area in c-9, t-11-CLA diet-fed mice to that in control diet-fed mice (right panel). The peak of sn-1-c-9, t-11-CLA-LPC in the lysates of the cortex (P = 0.00068) (A), cerebellum (P = 0.0017) (C), olfactory bulb (P = 0.04) (D) and brain stem (P = 0.015) (E) was significantly increased in c-9, t-11-CLA diet-fed mice as well as in the liver (P = 0.0025) (F). The peak for sn-1-c-9, t-11-CLA-LPC in the hippocampus (P = 0.09) was not significantly changed, but it tended to be increased. A peak with no significant change in area for LA [sn-1-(and also sn-2-CLA-) and sn-2-LA]-LPC was observed between brain regions from c-9, t-11-CLA diet-fed and control diet-fed mice, but an increased tendency by the c-9, t-11-CLA diet was observed. In the liver, the peak of sn-1-LA-LPC and also sn-2-CLA-LPC was significantly increased by the c-9, t-11-CLA diet. Left panel: LPC area ratio/g tissue. n = 4 mice for each group. *P < 0.05, **P < 0.001, ***P < 0.0001 ns: not significant.
Figure 8
Figure 8
Gas chromatographic analysis of the level of free c-9, t-11-CLA and total c-9, t-11-CLA in the brain of c-9, t-11-CLA diet-fed mice. Free c-9, t-11-CLA was quantitatively determined in the brains from control diet-fed mice ( −) and c-9, t-11-CLA diet-fed mice as described in “Methods”. (B) Total c-9, t-11-CLA was quantitatively determined by gas chromatography after saponification of the extracted lipids from the brains as described in “Methods.” *P < 0.05 (free CLA, P = 0.0002; total CLA, P = 1.6 × 10−6).

References

    1. Selkoe DJ, Hardy J. The amyloid hypothesis of Alzheimer’s disease at 25 years. EMBO Mol. Med. 2016;8:595–608. - PMC - PubMed
    1. Masters CL, et al. Alzheimer’s disease. Nat. Rev. Dis. Prim. 2015;1:1–18. - PubMed
    1. Zou K, et al. Amyloid β-protein (Aβ)1–40 protects neurons from damage induced by Aβ1-42 in culture and in rat brain. J. Neurochem. 2003;87:609–619. - PubMed
    1. Kuperstein I, et al. Neurotoxicity of Alzheimer’s disease Aβ peptides is induced by small changes in the Aβ42 to Aβ40 ratio. EMBO J. 2010;29:3408–3420. - PMC - PubMed
    1. Reynolds CM, Roche HM. Conjugated linoleic acid and inflammatory cell signalling. Prostaglandins Leukot. Essent. Fat. Acids. 2010;82:199–204. - PubMed

Publication types