

Effect of various weight loss interventions on serum NT-proBNP concentration in severe obese subjects without clinical manifest heart failure
- PMID: 33980890
- PMCID: PMC8115663
- DOI: 10.1038/s41598-021-89426-7
Effect of various weight loss interventions on serum NT-proBNP concentration in severe obese subjects without clinical manifest heart failure
Abstract
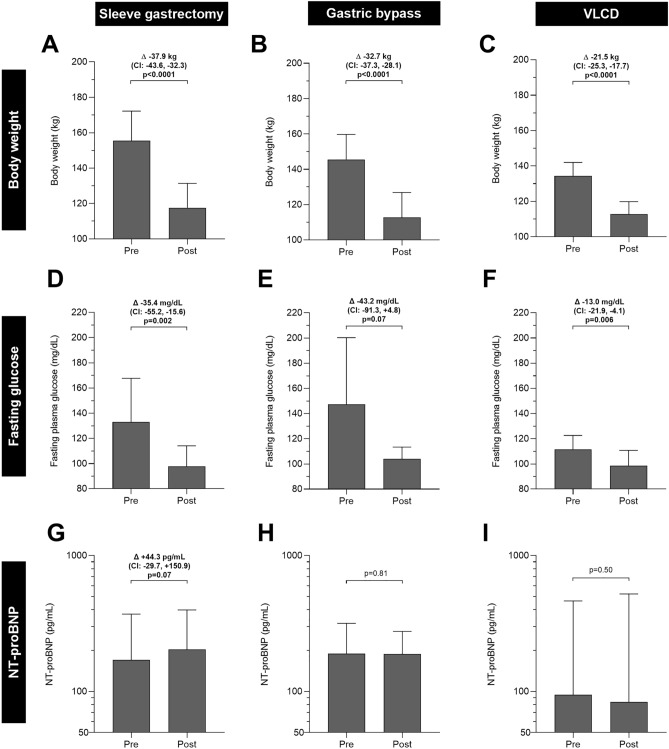
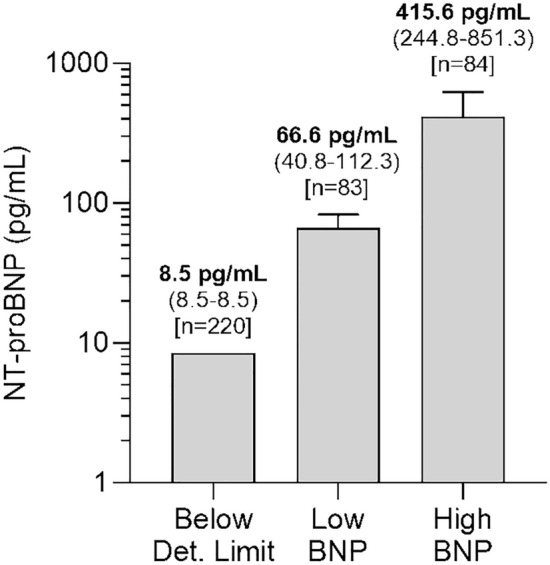
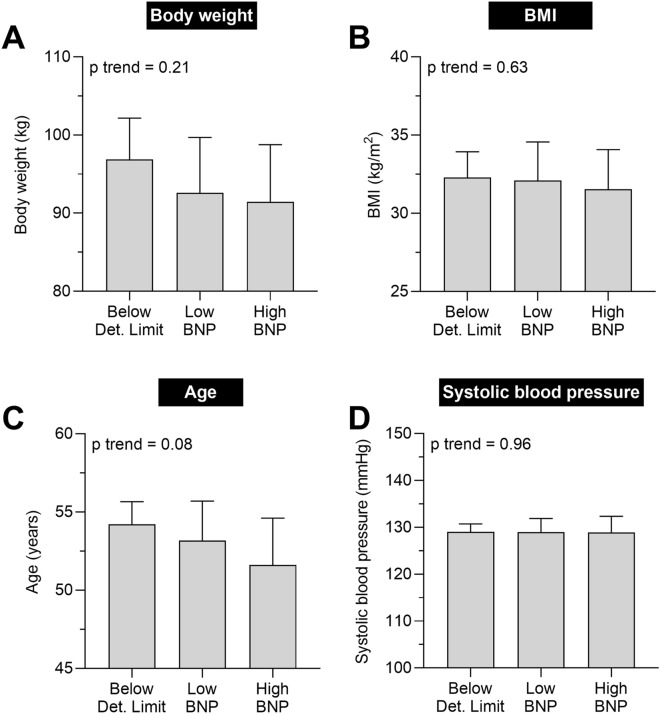
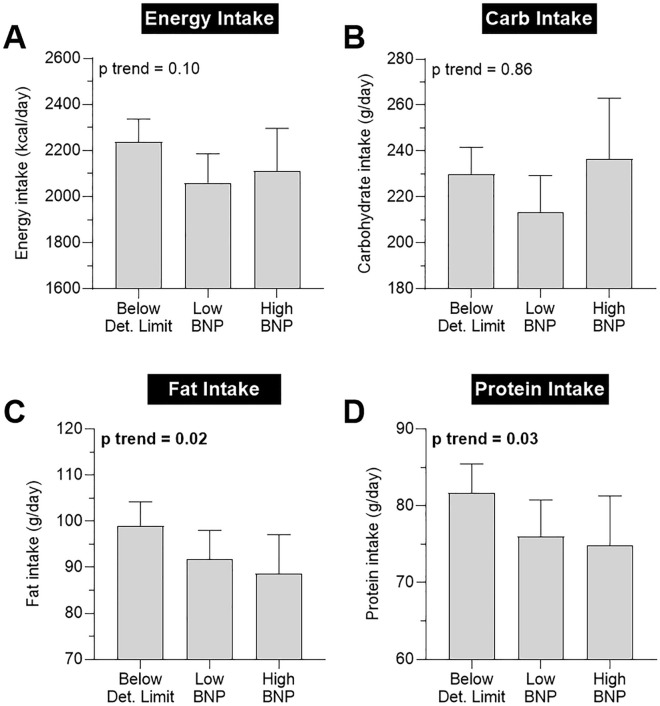
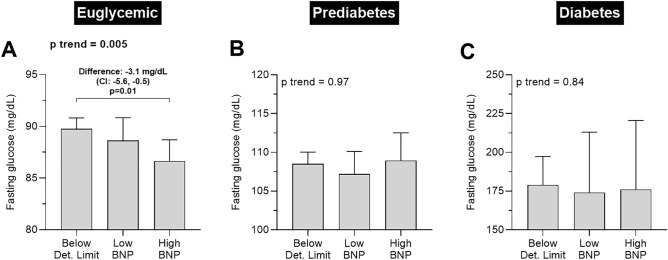
Obesity is associated with a "natriuretic handicap" indicated by reduced N-terminal fragment of proBNP (NT-proBNP) concentration. While gastric bypass surgery improves the natriuretic handicap, it is presently unclear if sleeve gastrectomy exhibits similar effects. We examined NT-proBNP serum concentration in n = 72 obese participants without heart failure before and 6 months after sleeve gastrectomy (n = 28), gastric bypass surgery (n = 19), and 3-month 800 kcal/day very-low calorie diet (n = 25). A significant weight loss was observed in all intervention groups. Within 6 months, NT-proBNP concentration tended to increase by a median of 44.3 pg/mL in the sleeve gastrectomy group (p = 0.07), while it remained unchanged in the other groups (all p ≥ 0.50). To gain insights into potential effectors, we additionally analyzed NT-proBNP serum concentration in n = 387 individuals with different metabolic phenotypes. Here, higher NT-proBNP levels were associated with lower nutritional fat and protein but not with carbohydrate intake. Of interest, NT-proBNP serum concentrations were inversely correlated with fasting glucose concentration in euglycemic individuals but not in individuals with prediabetes or type 2 diabetes. In conclusion, sleeve gastrectomy tended to increase NT-proBNP levels in obese individuals and might improve the obesity-associated "natriuretic handicap". Thereby, nutritional fat and protein intake and the individual glucose homeostasis might be metabolic determinants of NT-proBNP serum concentration.
Conflict of interest statement
Jan Beckmann reports grants and personal fees from Intuitive Surgical Sarl, personal fees from Ethicon, Johnson & Johnson, outside the submitted work. All other authors report no conflicts of interest.
Figures
Similar articles
-
Gastric bypass surgery elevates NT-ProBNP levels.Obes Surg. 2013 Sep;23(9):1421-6. doi: 10.1007/s11695-013-0889-z. Obes Surg. 2013. PMID: 23456799
-
Interaction of Body Mass Index on the Association Between N-Terminal-Pro-b-Type Natriuretic Peptide and Morbidity and Mortality in Patients With Acute Heart Failure: Findings From ASCEND-HF (Acute Study of Clinical Effectiveness of Nesiritide in Decompensated Heart Failure).J Am Heart Assoc. 2018 Feb 3;7(3):e006740. doi: 10.1161/JAHA.117.006740. J Am Heart Assoc. 2018. PMID: 29431103 Free PMC article.
-
B-type natriuretic peptide (BNP) and N-terminal pro-BNP in obese patients without heart failure: relationship to body mass index and gastric bypass surgery.Clin Chem. 2006 Apr;52(4):680-5. doi: 10.1373/clinchem.2005.062562. Epub 2006 Feb 23. Clin Chem. 2006. PMID: 16497939
-
N-terminal-pro-brain natriuretic peptide, but not brain natriuretic peptide, is increased in patients with severe obesity.Braz J Med Biol Res. 2007 Feb;40(2):153-8. Braz J Med Biol Res. 2007. PMID: 17273651
-
The effect of surgical and non-surgical weight loss on N-terminal pro-B-type natriuretic peptide and its relation to obstructive sleep apnea and pulmonary function.BMC Res Notes. 2016 Sep 13;9(1):440. doi: 10.1186/s13104-016-2241-x. BMC Res Notes. 2016. PMID: 27619215 Free PMC article. Clinical Trial.
Cited by
-
STEP HFpEF DM: a sweet sequel.Heart Fail Rev. 2024 Sep;29(5):913-915. doi: 10.1007/s10741-024-10408-8. Epub 2024 Jun 18. Heart Fail Rev. 2024. PMID: 38888653 No abstract available.
-
Obesity and heart failure with preserved ejection fraction: focus on new drugs and future direction in medical treatment.Korean J Intern Med. 2025 May;40(3):357-370. doi: 10.3904/kjim.2024.387. Epub 2025 Apr 30. Korean J Intern Med. 2025. PMID: 40360219 Free PMC article. Review.
-
Plasma microRNAs as Biomarkers for Predicting Radiotherapy Treatment-Induced Cardiotoxicity in Lung Cancer.Life (Basel). 2024 Dec 6;14(12):1619. doi: 10.3390/life14121619. Life (Basel). 2024. PMID: 39768327 Free PMC article.
-
Anti-obesity medications in the management of heart failure with preserved ejection fraction: available evidence and next STEPS.Heart Fail Rev. 2024 Sep;29(5):939-944. doi: 10.1007/s10741-024-10410-0. Epub 2024 Jul 4. Heart Fail Rev. 2024. PMID: 38965119 Review.
-
Prediabetes and type 2 diabetes but not obesity are associated with alterations in bile acid related gut microbe-microbe and gut microbe-host community metabolism.Gut Microbes. 2025 Dec;17(1):2474143. doi: 10.1080/19490976.2025.2474143. Epub 2025 Mar 5. Gut Microbes. 2025. PMID: 40045464 Free PMC article.
References
-
- Breidthardt T, Laule-Kilian K, Christ M, Perruchoud A. The integration of BNP and NT-proBNP into clinical medicine. Swiss. Med. Wkly. 2007;137:4–12. - PubMed
Publication types
MeSH terms
Substances
LinkOut - more resources
Full Text Sources
Other Literature Sources
Medical
Research Materials
