. 2021 May 12;11(1):10117.
doi: 10.1038/s41598-021-89418-7.

Physiological and transcriptomic analyses characterized high temperature stress response mechanisms in Sorbus pohuashanensis

Affiliations

Physiological and transcriptomic analyses characterized high temperature stress response mechanisms in Sorbus pohuashanensis

Xin Pei et al. Sci Rep. .

Abstract

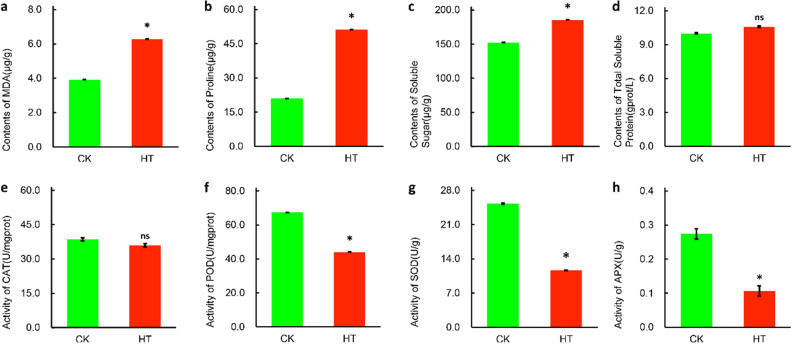
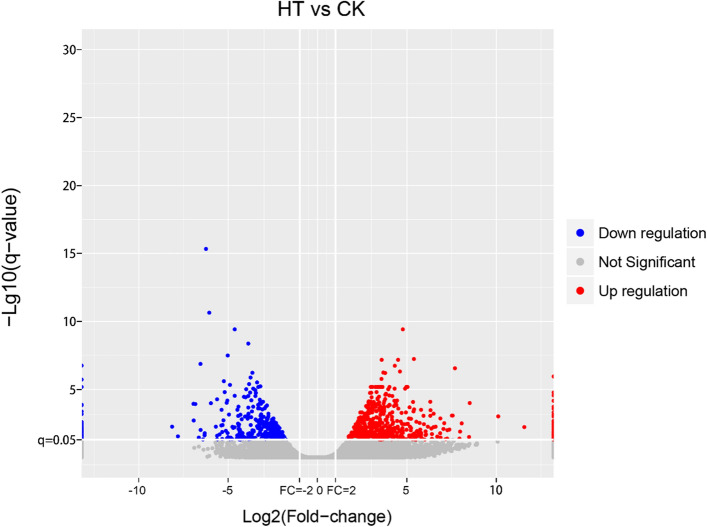
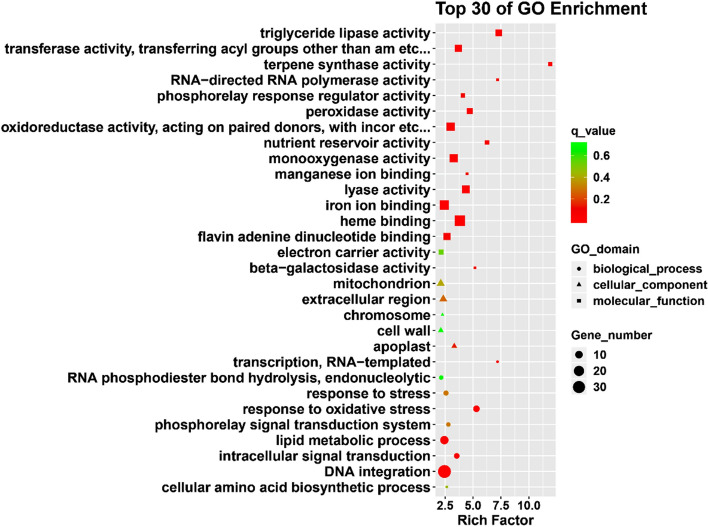
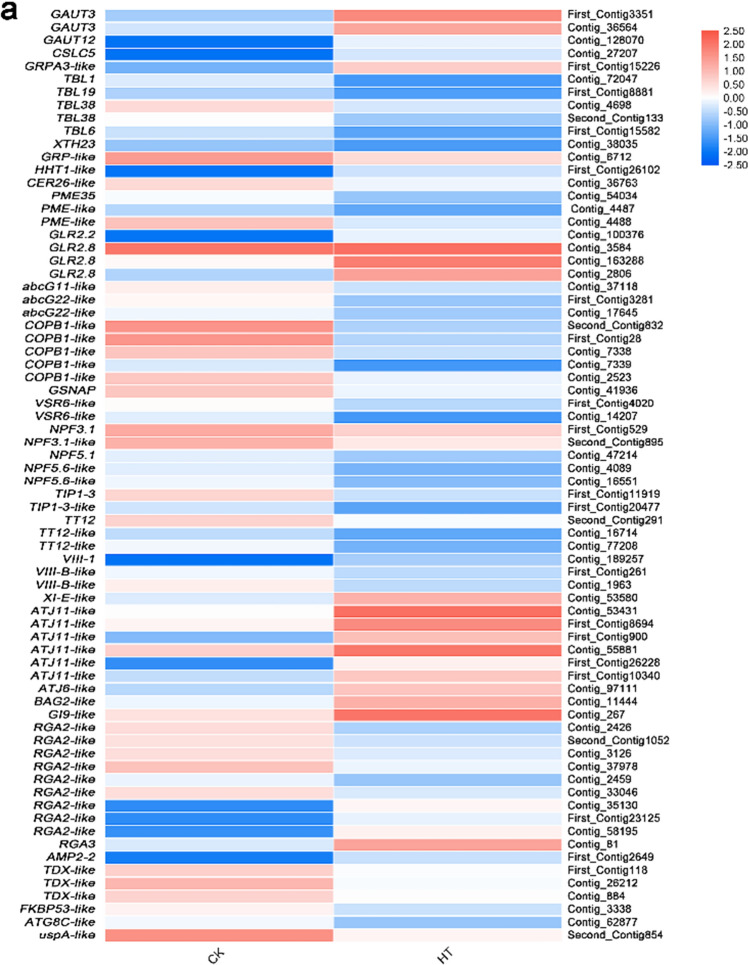
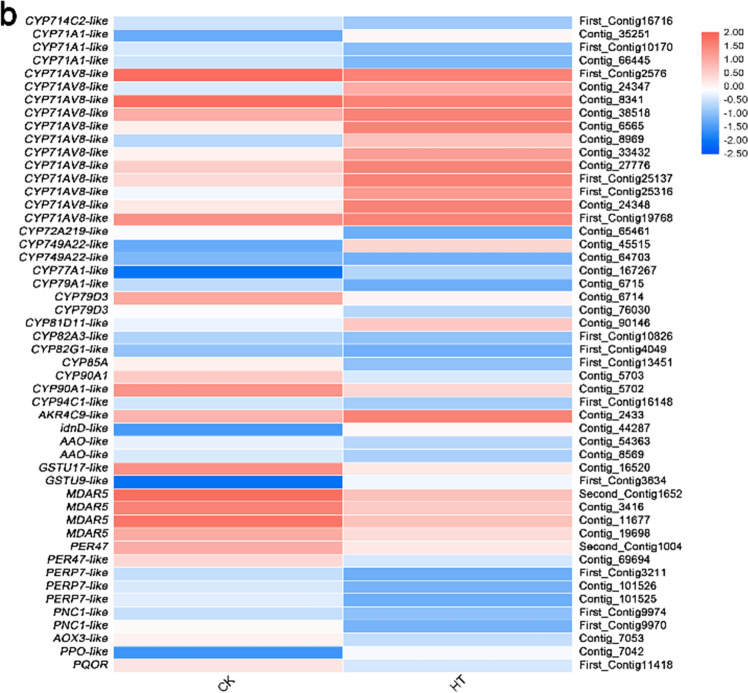
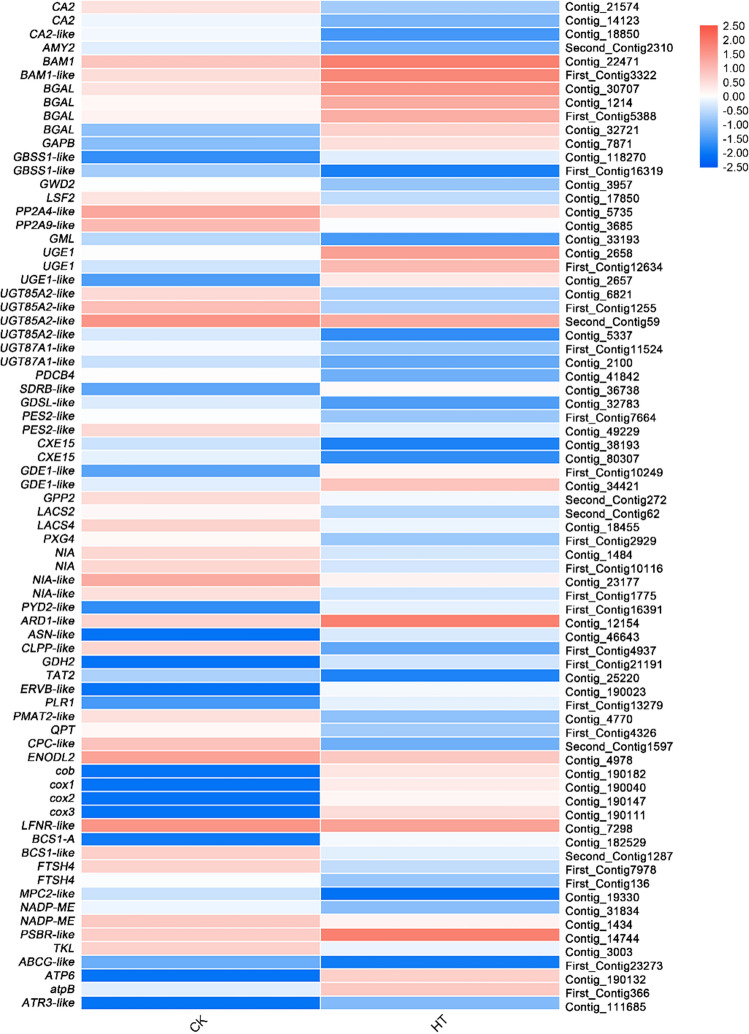
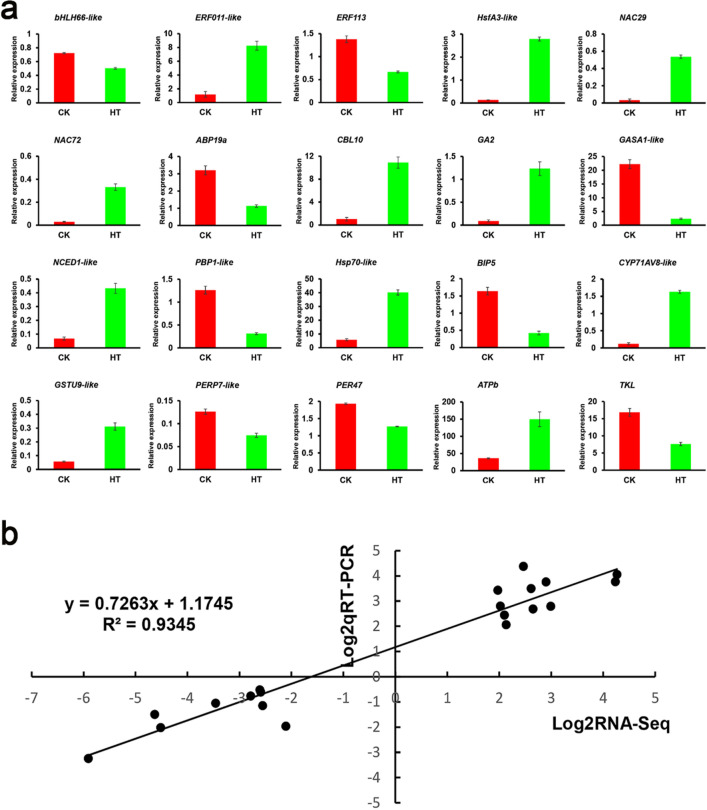
Sorbus pohuashanensis (Hance) Hedl. is a Chinese native alpine tree species, but the problem of introducing S. pohuashanensis to low altitude areas has not been solved. In this study, we aimed to explore the molecular regulatory network of S. pohuashanensis in response to high-temperature stress using RNA-Sequencing technology and physiological and biochemical determination. Based on transcriptomic data, we obtained 1221 genes (752 up-regulated and 469 down-regulated) that were differentially expressed during 8 h 43℃ treatment and candidate genes were related to calcium signaling pathway, plant hormone signal transduction, heat shock factors, chaperones, ubiquitin mediated proteolysis, cell wall modification, ROS scavenging enzymes, detoxification and energy metabolism. The analysis of high temperature response at the physiological level and biochemical level were performed. The chlorophyll fluorescence parameters of leaf cells decreased, the content of osmotic regulators increased, and the activity of ROS scavenging enzymes decreased. The molecular regulatory network of S. pohuashanensis in response to high-temperature stress was preliminarily revealed in this study, which provides fundamental information improving introducing methods and discovering heat-tolerant genes involved in high-temperature stress in this species and provides a reference for other plants of the genus Sorbus.


Conflict of interest statement

The authors declare no competing interests.

Figures

Figure 1
Figure 1
Effects of heat stress on the (a) Fv/Fm, (b) Fv`/Fm`, (c) ΦPSII, (d) qL, (e) NPQ and (f) qN of PS IIphotochemistry (significant difference at 5% levels according to standard deviation and multiple comparison).
Figure 2
Figure 2
Physiological and biochemical indexes of leaves of S. pahuashanensis under heat stress. (a) MDA, (b) Pro, (c) Soluble sugar, (d) Total soluble protein, (e) CAT, (f) POD, (g) SOD and (h) APX (* indicate the significant difference at 5% levels according to student’s t-test, respectively. NS means no significant difference).
Figure 3
Figure 3
Volcano plot of differentially expressed transcripts with high-temperature stress treatment in S. pohuashanensis at q-value ≤ 0.05. Up-regulated and down-regulated genes were represented by red and blue dots, respectively.
Figure 4
Figure 4
GO enrichment analysis of DEGs under high-temperature treatment. The figure shows the top 30 terms, and the size of the points indicates the number of differentially expressed genes involved in the path. The color scale indicates the significance level (q-value ≤ 0.05). The rich factor is the ratio between the number of DEGs and all genes enriched for the terms.
Figure 5
Figure 5
KEGG enrichment analysis of differentially expressed genes under high-temperature treatment. The figure shows the top 30 pathways. The size of the dot indicates the number of DEGs involved in the pathway. The color scale indicates the significance level (q-value ≤ 0.05). The rich factor is the ratio between the number of DEGs and all genes enriched for the pathways.
Figure 6
Figure 6
Relative expression levels of DEGs related to signal transduction pathway. The rows in the heat map represent the individual gene IDs, and the columns represent the samples taken from high-temperature treatment (HT) and control (CK). The changes in expression are indicated by colors ranging from blue (down-regulated) to yellow red (up-regulated).
Figure 7
Figure 7
Relative expression levels of DEGs related to transcriptional regulation. The rows in the heat map represent the individual gene IDs, and the columns represent the samples taken from high-temperature treatment (HT) and control (CK). The changes in expression are indicated by colors ranging from blue (down-regulated) to yellow red (up-regulated).
Figure 8
Figure 8
Relative expression levels of DEGs related to protein homeostasis (a) and ROS homeostasis (b). The rows in the heat map represent the individual gene IDs, and the columns represent the samples taken from high-temperature treatment (HT) and control (CK). The changes in expression are indicated by colors ranging from blue (down-regulated) to yellow red (up-regulated).
Figure 8
Figure 8
Relative expression levels of DEGs related to protein homeostasis (a) and ROS homeostasis (b). The rows in the heat map represent the individual gene IDs, and the columns represent the samples taken from high-temperature treatment (HT) and control (CK). The changes in expression are indicated by colors ranging from blue (down-regulated) to yellow red (up-regulated).
Figure 9
Figure 9
Relative expression levels of DEGs related to metabolism process. The rows in the heat map represent the individual gene IDs, and the columns represent the samples taken from high-temperature treatment (HT) and control (CK). The changes in expression are indicated by colors ranging from blue (down-regulated) to yellow red (up-regulated).
Figure 10
Figure 10
Relative gene expression of DEGs analyzed by quantitative RT-PCR in response to high-temperature stress treatment. (a) quantitative RT-PCR data were normalized using the S. pohuashanensis Actin β gene and are shown relative to CK (normal condition). X-axes show different treatments (CK, normal condition and HT, high temperature condition) and Y-axes are scales of relative expression level (error bars indicate SD). (b) Correlation of expression levels between RNA-seq and qRT-PCR that identified 20 HT vs. CK. The log2qRT-PCR (y-axis) was plotted against log2RNA-seq (x-axis).
Figure 11
Figure 11
Schematic representation of the response mechanism of S. pohuashanensis to high temperature stress (Refer to Nishad et al. (2020) and Wang et al. (2020)),. High-temperature stress causes damage to membrane proteins, denaturation and inactivation of various enzymes, and accumulation of reactive oxygen species. High-temperature stress changes membrane fluidity, which may be sensed by proteins, such as Ca2+ channels and receptor-like kinases, localized at the plasma membrane. Calcium signaling plays critical roles in sensing sudden changes in temperature and activating cascades of signaling, leading to the production of Hsps that keep protein-unfolding under control. HSFs are the transcription factors that read the activation of thermosensors and induce the expression of HSPs. HsfAs are activated by high-temperature, and they target downstream transcription factors (such as HsfA3) to induce the expression of heat stress-responsive genes (Hsp70, sHsp, and other chaperones), which are important for ROS scavenging and protein homeostasis. In addition, some TF genes, including ERFs, bZIPs and ATHBs also play a role in the molecular mechanism of high-temperature stress in S. pohuashanensis. Accumulation of ROS in plants activates HSFs, which in turn activate ROS scavenging and detoxifying enzymes like APX and SOD. ROS level occurs due to the change by production of antioxidants, osmolytes, and Hsps. The major stress-responsive osmolytes in plants include proline, soluble-sugar and protein which play roles in maintaining cellular ionic homeostasis.

Similar articles

Cited by

References

    1. Abbo S, Lev-Yadun S, Gopher A. Plant domestication and crop evolution in the Near East: on events and processes. Crit. Rev. Plant Sci. 2012;31:241–257. doi: 10.1080/07352689.2011.645428. - DOI
    1. Castro AVP, Brito P, González-Rodríguez A. Changes in thermic limits and acclimation assessment for an alpine plant by chlorophyll fluorescence analysis: Fv/Fm vs Rfd. Photosynthetica. 2017;56:527–536. doi: 10.1007/s11099-017-0691-6. - DOI
    1. Zheng G, Tian B, Li W. Membrane lipid remodelling of Meconopsis racemosa after Its introduction into lowlands from an alpine environment. PLoS ONE. 2014;9:e106614. doi: 10.1371/journal.pone.0106614. - DOI - PMC - PubMed
    1. Mani MS. Alpine plants Book reviews: ecology and phytogeography of high altitude plants of the Northwest Himalaya Introduction to high altitude botany. Science. 1979;206:883–896.
    1. Berry JA, Bjorkman O. Photosynthetic response and adaptation to temperature in higher plants. Annu. Rev. Plant Physiol. 2003;31:491–543. doi: 10.1146/annurev.pp.31.060180.002423. - DOI

Publication types

LinkOut - more resources