

Random forest-based prediction of stroke outcome
- PMID: 33980906
- PMCID: PMC8115135
- DOI: 10.1038/s41598-021-89434-7
Random forest-based prediction of stroke outcome
Abstract
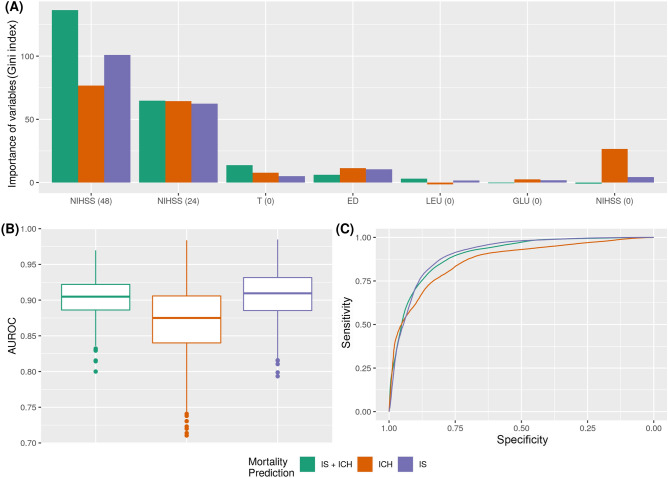
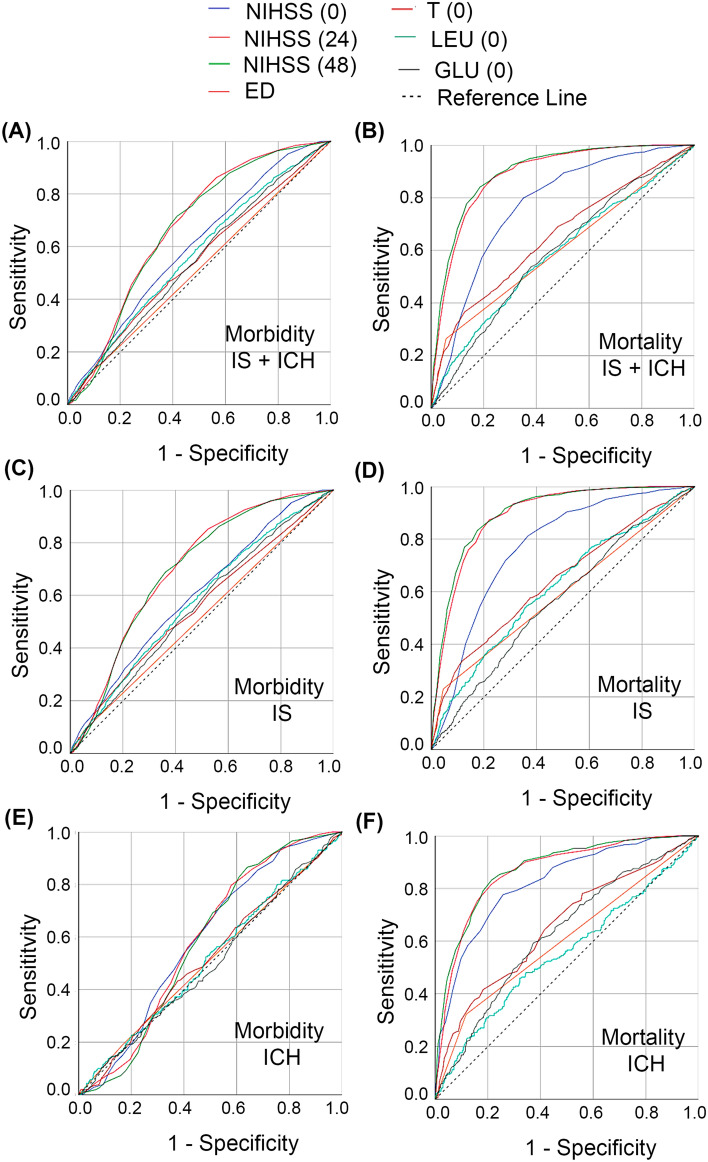
We research into the clinical, biochemical and neuroimaging factors associated with the outcome of stroke patients to generate a predictive model using machine learning techniques for prediction of mortality and morbidity 3-months after admission. The dataset consisted of patients with ischemic stroke (IS) and non-traumatic intracerebral hemorrhage (ICH) admitted to Stroke Unit of a European Tertiary Hospital prospectively registered. We identified the main variables for machine learning Random Forest (RF), generating a predictive model that can estimate patient mortality/morbidity according to the following groups: (1) IS + ICH, (2) IS, and (3) ICH. A total of 6022 patients were included: 4922 (mean age 71.9 ± 13.8 years) with IS and 1100 (mean age 73.3 ± 13.1 years) with ICH. NIHSS at 24, 48 h and axillary temperature at admission were the most important variables to consider for evolution of patients at 3-months. IS + ICH group was the most stable for mortality prediction [0.904 ± 0.025 of area under the receiver operating characteristics curve (AUC)]. IS group presented similar results, although variability between experiments was slightly higher (0.909 ± 0.032 of AUC). ICH group was the one in which RF had more problems to make adequate predictions (0.9837 vs. 0.7104 of AUC). There were no major differences between IS and IS + ICH groups according to morbidity prediction (0.738 and 0.755 of AUC) but, after checking normality with a Shapiro Wilk test with the null hypothesis that the data follow a normal distribution, it was rejected with W = 0.93546 (p-value < 2.2e-16). Conditions required for a parametric test do not hold, and we performed a paired Wilcoxon Test assuming the null hypothesis that all the groups have the same performance. The null hypothesis was rejected with a value < 2.2e-16, so there are statistical differences between IS and ICH groups. In conclusion, machine learning algorithms RF can be effectively used in stroke patients for long-term outcome prediction of mortality and morbidity.
Conflict of interest statement
The authors declare no competing interests.
Figures


Similar articles
-
Defining Minor Intracerebral Hemorrhage.Cerebrovasc Dis. 2021;50(4):435-442. doi: 10.1159/000515169. Epub 2021 Apr 8. Cerebrovasc Dis. 2021. PMID: 33831860
-
Modified ICH score was superior to original ICH score for assessment of 30-day mortality and good outcome of non-traumatic intracerebral hemorrhage.Clin Neurol Neurosurg. 2021 Oct;209:106913. doi: 10.1016/j.clineuro.2021.106913. Epub 2021 Aug 28. Clin Neurol Neurosurg. 2021. PMID: 34507127
-
Stroke Mortality Outcomes in Uganda.J Stroke Cerebrovasc Dis. 2021 May;30(5):105661. doi: 10.1016/j.jstrokecerebrovasdis.2021.105661. Epub 2021 Mar 6. J Stroke Cerebrovasc Dis. 2021. PMID: 33684710
-
Intracerebral haemorrhage: from clinical settings to animal models.Stroke Vasc Neurol. 2020 Dec;5(4):388-395. doi: 10.1136/svn-2020-000334. Epub 2020 Mar 26. Stroke Vasc Neurol. 2020. PMID: 33376200 Free PMC article. Review.
-
Intracerebral Hemorrhage: A Common yet Disproportionately Deadly Stroke Subtype.Mayo Clin Proc. 2021 Jun;96(6):1639-1654. doi: 10.1016/j.mayocp.2020.10.034. Epub 2021 May 2. Mayo Clin Proc. 2021. PMID: 33952393 Review.
Cited by
-
Machine Learning Approaches for Stroke Risk Prediction: Findings from the Suita Study.J Cardiovasc Dev Dis. 2024 Jul 1;11(7):207. doi: 10.3390/jcdd11070207. J Cardiovasc Dev Dis. 2024. PMID: 39057627 Free PMC article.
-
Machine Learning-Based Prediction of Subsequent Vascular Events After 6 Months in Chinese Patients with Minor Ischemic Stroke.Int J Gen Med. 2022 Apr 7;15:3797-3808. doi: 10.2147/IJGM.S356373. eCollection 2022. Int J Gen Med. 2022. PMID: 35418774 Free PMC article.
-
[An interpretable machine learning-based prediction model for risk of death for patients with ischemic stroke in intensive care unit].Nan Fang Yi Ke Da Xue Xue Bao. 2023 Jul 20;43(7):1241-1247. doi: 10.12122/j.issn.1673-4254.2023.07.21. Nan Fang Yi Ke Da Xue Xue Bao. 2023. PMID: 37488807 Free PMC article. Chinese.
-
Predicting ischemic stroke patients' prognosis changes using machine learning in a nationwide stroke registry.Med Biol Eng Comput. 2024 Aug;62(8):2343-2354. doi: 10.1007/s11517-024-03073-4. Epub 2024 Apr 5. Med Biol Eng Comput. 2024. PMID: 38575823 Free PMC article.
-
Interpretable prediction of stroke prognosis: SHAP for SVM and nomogram for logistic regression.Front Neurol. 2025 Mar 4;16:1522868. doi: 10.3389/fneur.2025.1522868. eCollection 2025. Front Neurol. 2025. PMID: 40103937 Free PMC article.
References
Publication types
MeSH terms
LinkOut - more resources
Full Text Sources
Other Literature Sources
Medical
