. 2021 May 12;11(1):10078.
doi: 10.1038/s41598-021-89530-8.

C646 inhibits G2/M cell cycle-related proteins and potentiates anti-tumor effects in pancreatic cancer

Affiliations

C646 inhibits G2/M cell cycle-related proteins and potentiates anti-tumor effects in pancreatic cancer

Hiroaki Ono et al. Sci Rep. .

Abstract

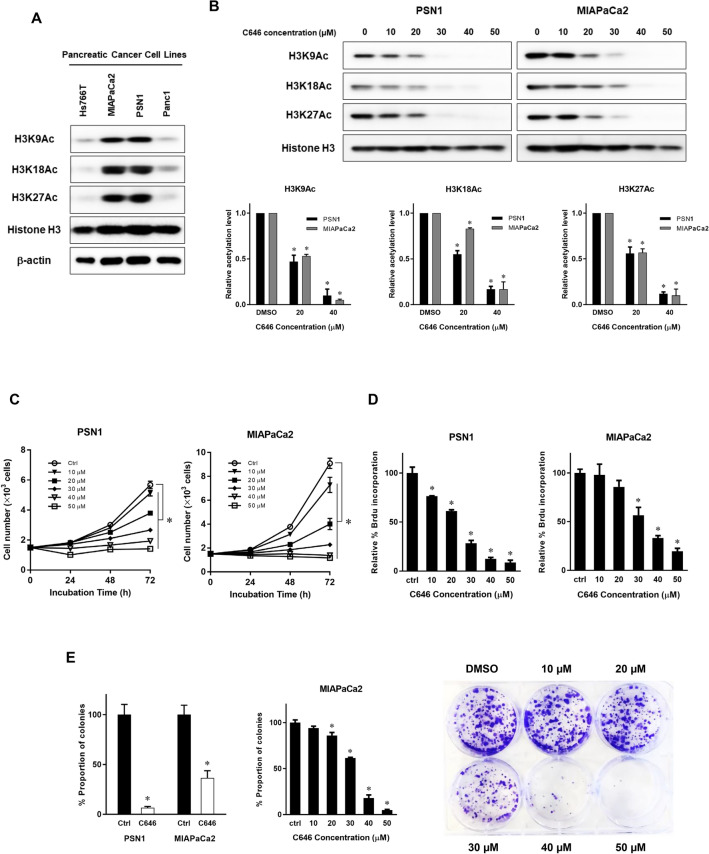
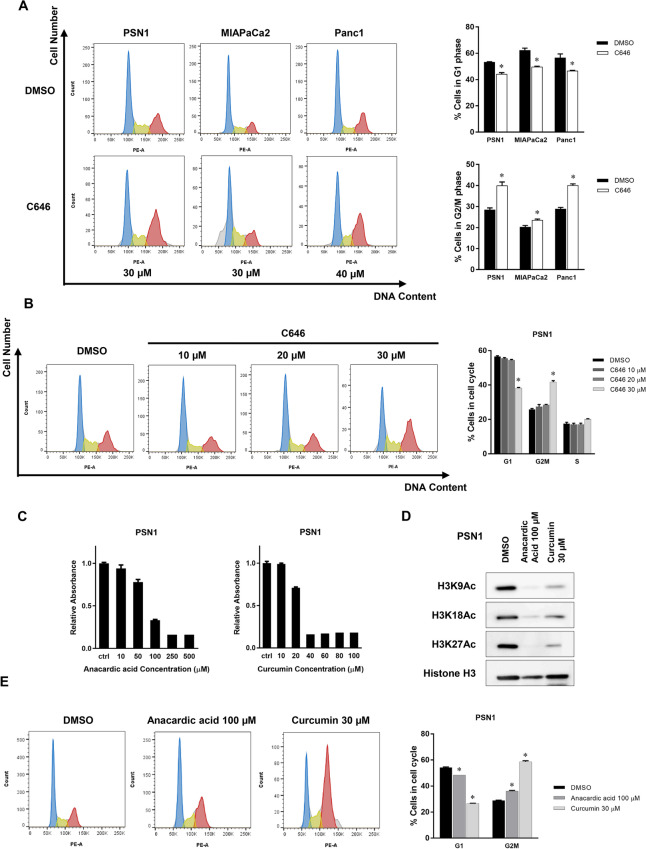
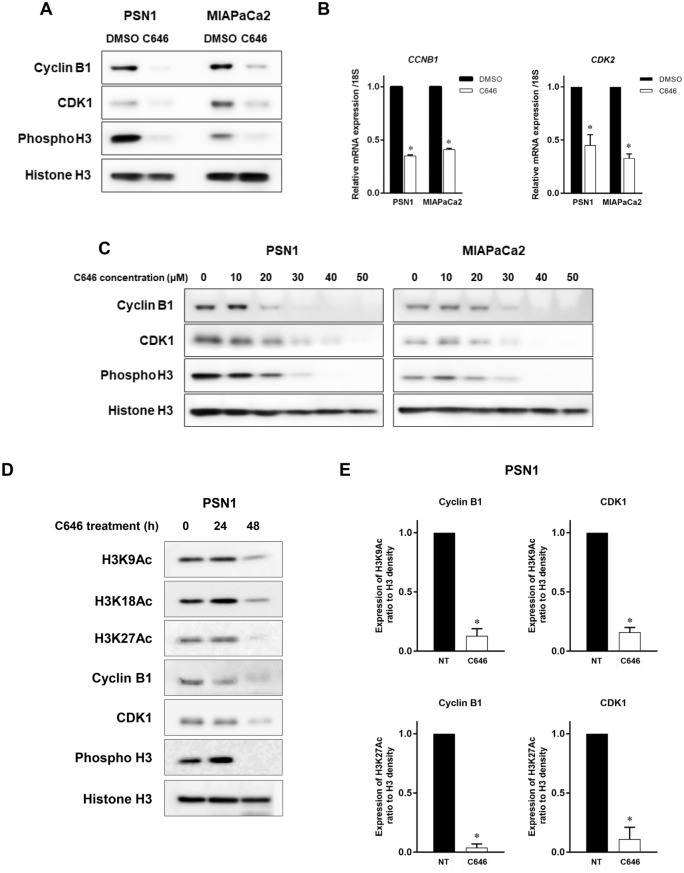
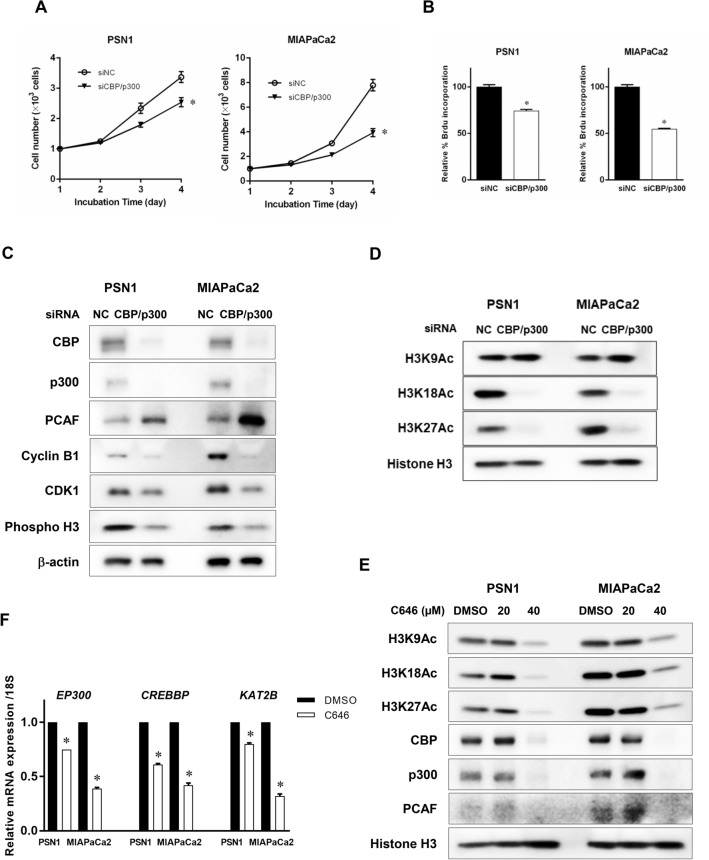
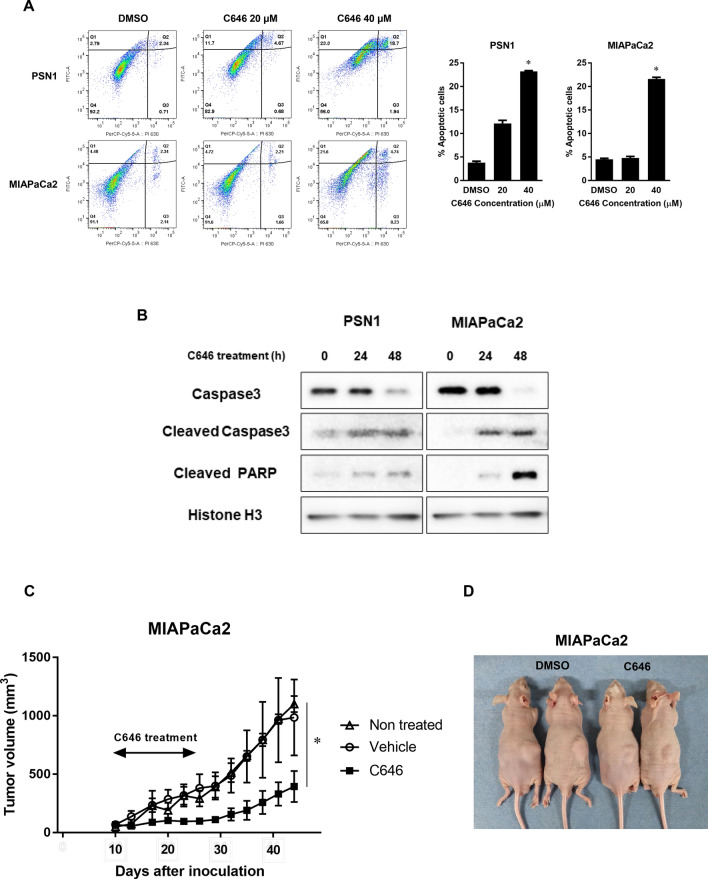
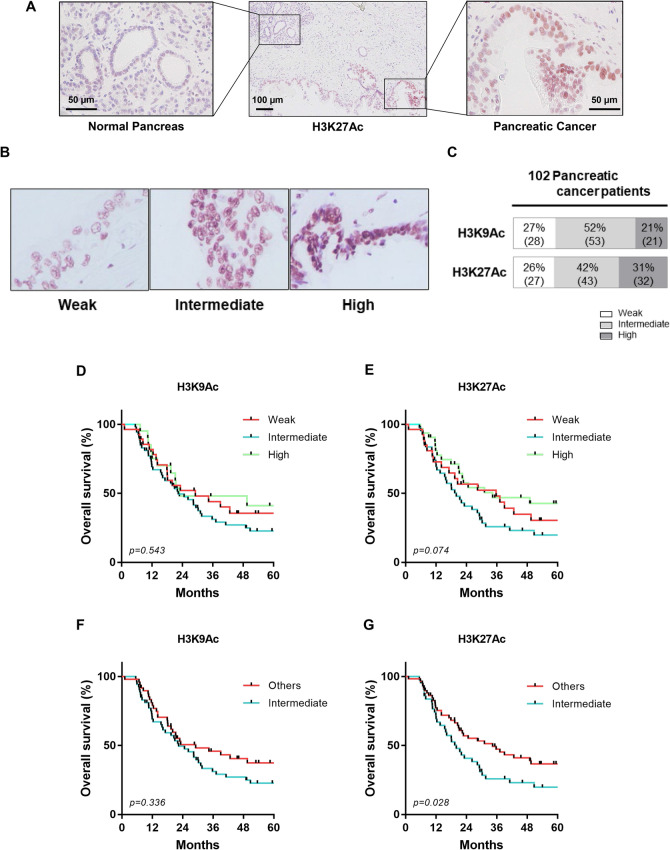
The activity of histone acetyltransferases (HATs) plays a central role in an epigenetic modification in cooperation with HDACs (histone deacetyl transferases). It is likely that malfunction of this enzymatic machinery controlling epigenetic modification is relevant to carcinogenesis and tumor progression. However, in pancreatic cancer, the clinical relevance of HAT activity and histone acetylation has remained unclear. We identified that H3 acetylation was expressed in all pancreatic cancer patients, indicating that H3 acetylation may be essential in pancreatic cancer cells. We also found that the HAT inhibitor C646 augmented anti-tumor effects in vitro by inhibiting cell proliferation and cell cycle progression concomitantly with suppression of acetylated H3K9 and H3K27 expression. C646 or p300 and CBP (CREB-binding protein)-specific siRNA treatment inhibited the transcription of the G2/M cell cycle regulatory proteins cyclin B1 and CDK1 (cyclin-dependent kinase 1). C646 treatment also inhibited tumor growth in vivo in a xenograft mouse model. C646 could be an effective therapeutic agent for pancreatic cancer. The epigenetic status of pancreatic cancers based on their level of histone H3 acetylation may influence patient survival. Epigenetic stratification according to H3K27 acetylation could be useful for predicting disease prognosis as well as the therapeutic efficacy of C646 in pancreatic cancer.


Conflict of interest statement

The authors declare no competing interests.

Figures

Figure 1
Figure 1
C646 inhibits histone H3 acetylation and proliferation of pancreatic cancer cells. (A) Endogenous H3K9Ac, H3K18Ac, and H3K27Ac expression in human pancreatic cancer cell lines. Histone H3 acetylation levels were quantified in four pancreatic cancer cell lines, Hs766T, MIAPaCa2, PSN1, and Panc1, by Western blotting. (B) C646 treatment (10–50 µM) compared with the DMSO vehicle control by Western blotting of PSN1 and MIAPaCa2 cells. Histone H3K9, H3K18, and H3K27 acetylation were downregulated as the C646 concentration increased. Experiments were performed in duplicate. Error bars represent mean ± SD. *p < 0.05. (C, D) Cell viability following C646 treatment of PSN1 and MIAPaCa2 cells by WST-8 assay (C) and BrdU incorporation assay (D). (C) Cells were seeded at 1.5 × 103 per well and incubated overnight, after which titrated doses of C646 (10–50 µM) were added. Cell viability assays were performed every 24 h up to 72 h. (D) C646 treatment was for 72 h. Each data point was evaluated as relative % ratio normalized to vehicle control. Each experiment was performed in duplicate. Error bars represent mean ± SD. *p < 0.05 by one-way ANOVA with post hoc Dunnett's test. (E) Left panel, clonogenic cell survival after C646 treatment relative to DMSO vehicle control for PSN1 and MIAPaCa2 cells. Cancer cells were treated with 30 µM C646 or DMSO for nine hours and then incubated for seven days in fresh media. The ability to form colonies after C646 treatment was significantly decreased in both cell lines. *p < 0.05 vs control. Middle panel, dose-dependent effects on the clonogenic assay for MIAPaCa2 cells (*p < 0.05 vs control by one-way ANOVA with post hoc Dunnett's test). Right panel, representative image of clonogenic cell survival assay on treatment of MIAPaCa2 cells with different doses of C646. Error bars represent mean ± SD.
Figure 2
Figure 2
C646 induces G2/M arrest in pancreatic cancer cells. (A) Effects of C646 treatment on cell cycle progression. Flow cytometry was performed after 30 µM C646 treatment in PSN1 and MIAPaCa2 cells and 40 µM C646 in Panc1 cells for 48 h. C646 treatment decreased the number of cells arresting in G1 phase and increased cells accumulating in G2/M in all three pancreatic cancer cell lines. Error bars represent mean ± SD. *p < 0.05 vs DMSO vehicle control. (B) Dose-dependency of C646-induced G2/M cell cycle arrest in PSN1 cells. Error bars represent mean ± SD. *p < 0.05 vs DMSO vehicle control. (C) Cell viability following treatment with the HAT inhibitors curcumin and anacardic acid for 72 h and analysis of dose dependence by WST-8 assay in PSN1 cells. Error bars represent mean ± SD. (D) Effects of curcumin and anacardic acid on histone H3 acetylation. Acetylation of H3K9, H3K18, and H3K27 were assessed following 72-h treatment of curcumin and anacardic acid. Histone H3 acetylation of H3K9, H3K18, and H3K27 were effectively downregulated by curcumin (30 µM) and anacardic acid (100 µM). (D) Effects of curcumin (30 µM) and anacardic acid (100 µM) on cell cycle progression following 48-h incubation in PSN1 cells. Notably, curcumin and anacardic acid induced G2/M cell cycle arrest in PSN1 cells. Error bars represent mean ± SD. *p < 0.05 vs DMSO vehicle control.
Figure 3
Figure 3
C646 inhibits expressions of G2/M cell cycle-associated genes. (A, B) Expression profiles of molecules associated with the G2/M transition at the protein level (A) and mRNA level (B) following C646 treatment. mRNA expression of cyclin B1 and CDK1 was inhibited after 48-h treatment with 30 µM C646 treatment in PSN1 and MIAPaCa2 cells. Inhibition of protein expression of cyclin B1 and CDK1 after 72-h C646 treatment was confirmed by Western blotting. Phosphorylated histone H3 (Ser10), recognized as an M phase marker, was also inhibited by C646 treatment. Error bars represent mean ± SD. *p < 0.05 vs DMSO vehicle control. (C) Dose-dependent analysis of G2/M cell cycle-associated molecules following C646 treatment (10–50 µM) by Western blotting in PSN1 and MIAPaCa2 cells. (D) Time-dependent analysis of histone H3 acetylation and G2/M cell cycle-associated molecules following C646 treatment for 24 and 48 h in PSN1 cells. (E) Quantitative ChIP analysis of cyclin B1 and CDK1 with C646 treatment (40 µM) in PSN1 cells. H3K9ac and H3K27ac levels at the promoter region of cyclin B1 and CDK1 were significantly decreased by C646 treatment. Error bars represent mean ± SD. *p < 0.05 vs controls.
Figure 4
Figure 4
P300 and CBP dual knockdown inhibits CDK1 and cyclin B1 expression and H3K18 and H3K27 acetylation, but not H3K9 acetylation. (A, B) Cell viability following CBP and p300 siRNA treatment as determined by WST-8 assay (A) and BrdU incorporation assay (B). Cells were transfected with CBP- and p300-specific siRNAs or negative control siRNA for 48 h and cell viability was assessed every 24 h through 72 h (WST-8 assay) (A) or at 72 h (BrdU incorporation assay) (B). Error bars represent mean ± SD. *p < 0.05 vs controls treated with negative control siRNA by one-way ANOVA with post hoc Dunnett's test (A) and t-test (B). (C) Effects on CBP, p300, and PCAF expression and expression of G2/M cell cycle regulatory molecules after p300 and CBP siRNA treatment. Effective knockdown of CBP and p300 by treatment with CBP- and p300-specific siRNAs was confirmed at the protein level. PCAF expression was increased by p300 and CBP gene silencing. Expression of G2/M cell cycle regulatory molecules were suppressed. Cancer cells were treated with CBP- and p300-specific siRNAs or negative control siRNA for 72 h. (D) Effects of silencing both p300 and CBP genes on histone H3 acetylation. Effects on acetylation of H3K9, H3K18, and H3K27 were assessed. Acetylated H3K18 (H3K18Ac) and H3K27 (H3K27Ac) were downregulated by CBP and p300 gene silencing, while acetylated H3K9 (H3K9Ac) was not affected. (E) Effects of C646 treatment on histone H3 acetylation and CBP, p300, and PCAF expression in PSN1 and MIAPaCa2 cells. Cancer cells were treated with C646 for 72 h at each concentration (20 and 40 µM). At a C646 concentration of 40 µM, which sufficiently inhibited histone acetylation, expression of these HAT molecules was downregulated. (F) Effects of CBP, p300, and PCAF mRNA levels following C646 treatment. mRNA expression of p300, CBP, and PCAF were inhibited after 48-h treatment with 30 µM C646 treatment in PSN1 and MIAPaCa2 cells.
Figure 5
Figure 5
C646 induces apoptosis of pancreatic cancer cells. Effects of C646 on apoptosis (A)/(B) and therapeutic efficacy of C646 treatment against pancreatic tumors transplanted in nude mice (C)/(D). (A) Cancer cells were treated with C646 at 30 µM for 48 h and fixed in 70% ethanol at − 20 °C overnight. Fixed cells were stained with for annexin V-FITC and propidium iodide. The proportions of apoptotic cells were significantly increased as C646 concentration was increased, compared with the control cells. Error bars represent mean ± SD. *p < 0.05 vs controls. (B) Cancer cells were treated with C646 at 30 µM for 48 h. The expression of apoptotic markers was increased by C646 treatment compared with controls. (C) Mice were inoculated with MIAPaCa2 cells in the flank by subcutaneous injection. Once tumors reached measurable size in 10 days, C646 (10 mg/kg) or vehicle (DMSO) were administrated by i.p. injection daily for two weeks. The dose of C646 was set to 10 mg/kg, which is the lower dose in this study, referring to previous literature. The volume of the tumors in mice was recorded over for eight weeks (C646, vehicle, and nontreated; each N = 4). C646 treatment in pancreatic cancer suppressed the growth of the tumor significantly (*p < 0.01 by one-way ANOVA with post hoc Dunnett's test). Error bars represent mean ± SD. (D) Representative images of transplanted tumors in mice at the time of necropsy (left panel, vehicle; right panel, C646).
Figure 6
Figure 6
Clinical significance of histone acetylation in pancreatic cancer cells. (A) Representative immunohistochemical staining of pancreatic cancer with positive H3K27Ac expression concomitant with normal pancreas tissue. Left panel: adjacent normal pancreatic tissue. Right panel: pancreatic cancer. (B) Representative immunohistochemical images of weak, intermediate, and high expression of histone acetylation in pancreatic cancer tissues. For scoring H3K9 and H3K27 acetylation, the intensity was graded using high-power (× 200) microscopy and evaluated by the intensity randomly chosen 3 fields from each specimen. Histone H3 acetylation of K9 and K27 staining were scored for nuclear intensity with numerical scores of 1, 2 and 3 representing weak, intermediate, and high staining intensity. Expression of histone acetylation can also be identified by staining patterns in the nucleus of cancer cells. Speckled low staining pattern with weak expression and diffuse strong staining pattern with high expression were observed. Intermediate expression showed mixed moderate staining pattern with speckled and diffuse staining. If the staining was homogenous within a given tumor, it was evaluated by intensity scores. If the staining is heterogeneous, then the assigned score was that observed in ≥ 50% or the majority of the nuclear of the cancer cells. (C) The frequency of pancreatic cancer patients with weak, intermediate, or high staining for H3K9Ac and H3K27Ac. Of note, all pancreatic cancer samples were positive for H3K9aAc and H3K27Ac expression to some degree. (DG) Kaplan–Meier curves for survival rates (overall survival) of pancreatic cancer patients according to H3K9Ac and H3K27Ac expression. (D), (F) H3K9Ac expression. (E), (G) H3K27Ac expression. Subgroup analysis was performed stratifying patients into intermediate acetylated H3 expression-vs-pooled weak and high acetylated H3 expression. Intermediate H3K27Ac immunoreactivity in tumor cells was significantly associated with worse survival (p = 0.028).

Similar articles

Cited by

References

    1. Siegel RL, Miller KD, Jemal A. Cancer statistics, 2019. CA Cancer J. Clin. 2019;69:7–34. doi: 10.3322/caac.21551. - DOI - PubMed
    1. Rahib L, et al. Projecting cancer incidence and deaths to 2030: the unexpected burden of thyroid, liver, and pancreas cancers in the United States. Cancer Res. 2014;74:2913–2921. doi: 10.1158/0008-5472.CAN-14-0155. - DOI - PubMed
    1. Aguirre AJ, et al. Real-time genomic characterization of advanced pancreatic cancer to enable precision medicine. Cancer Discov. 2018;8:1096–1111. doi: 10.1158/2159-8290.CD-18-0275. - DOI - PMC - PubMed
    1. Jones S, et al. Core signaling pathways in human pancreatic cancers revealed by global genomic analyses. Science. 2008;321:1801–1806. doi: 10.1126/science.1164368. - DOI - PMC - PubMed
    1. Waddell N, et al. Whole genomes redefine the mutational landscape of pancreatic cancer. Nature. 2015;518:495–501. doi: 10.1038/nature14169. - DOI - PMC - PubMed

Publication types

MeSH terms

LinkOut - more resources