Observational Study
. 2021 May 12;11(1):10124.
doi: 10.1038/s41598-021-89545-1.

COVID-19's natural course among ambulatory monitored outpatients

Affiliations
Observational Study

COVID-19's natural course among ambulatory monitored outpatients

Barbora Weinbergerova et al. Sci Rep. .

Abstract

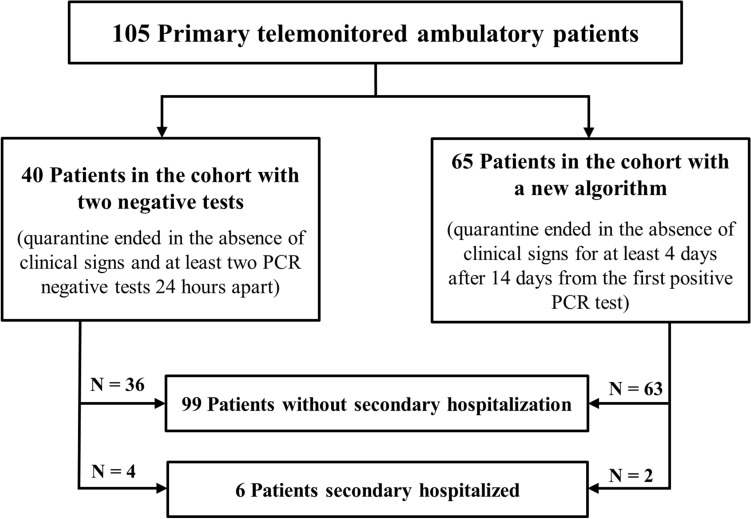
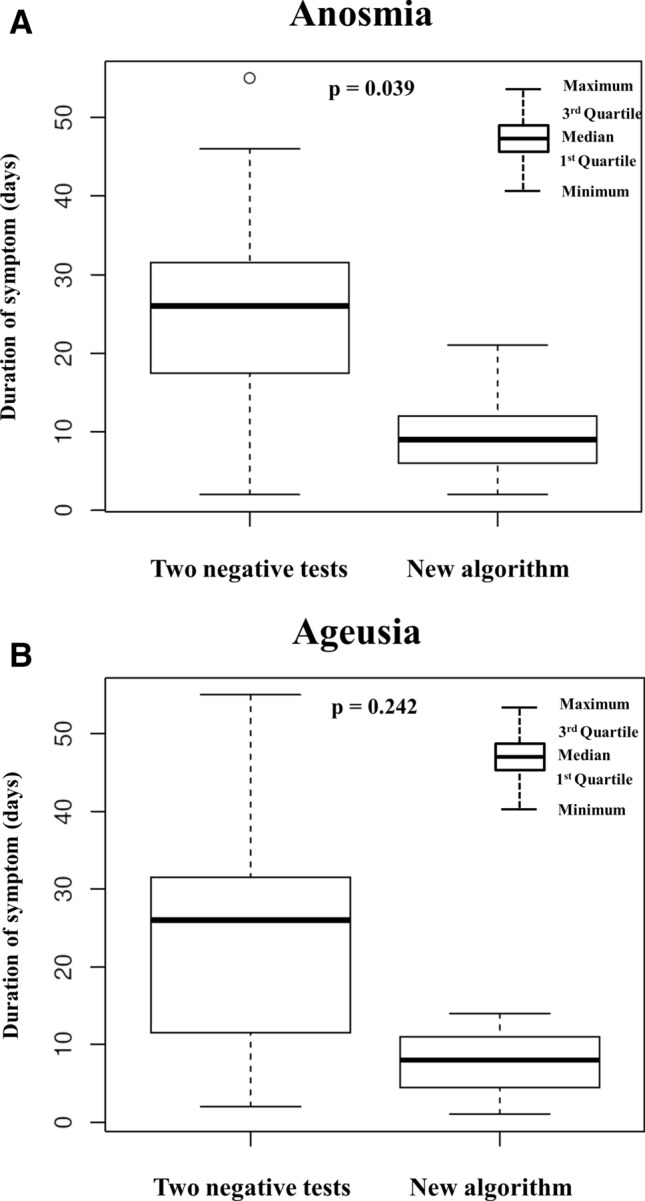
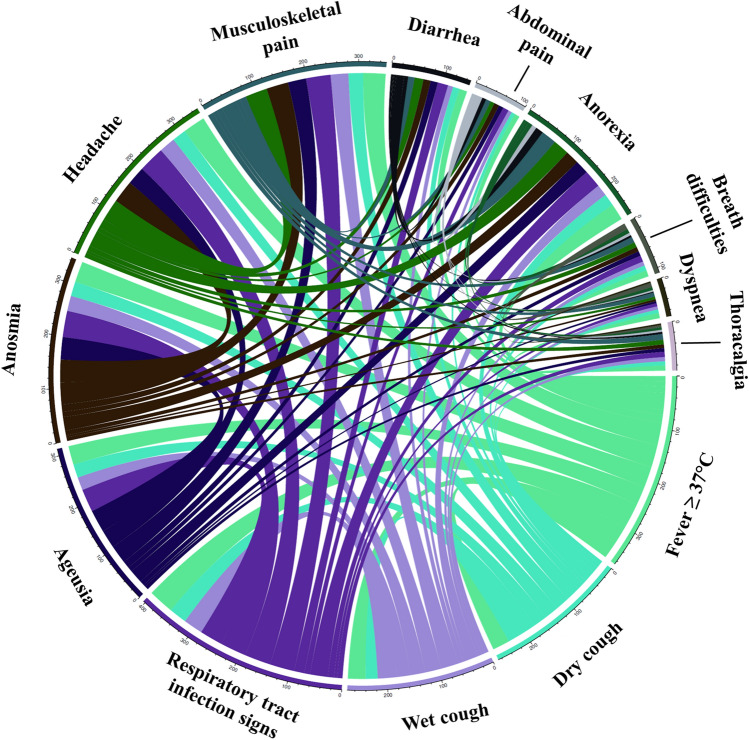
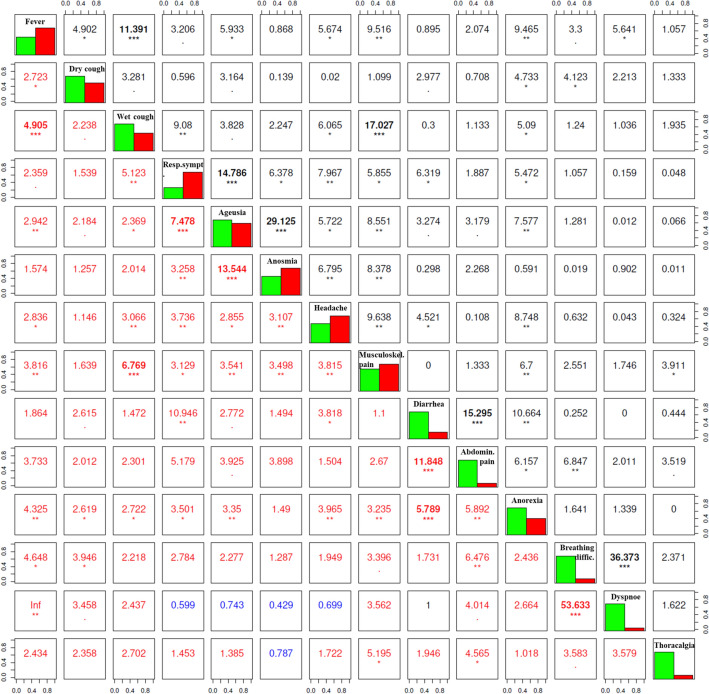
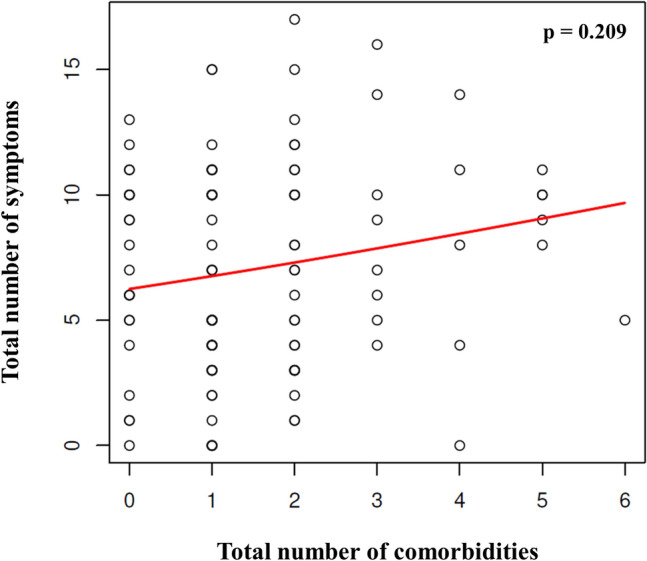
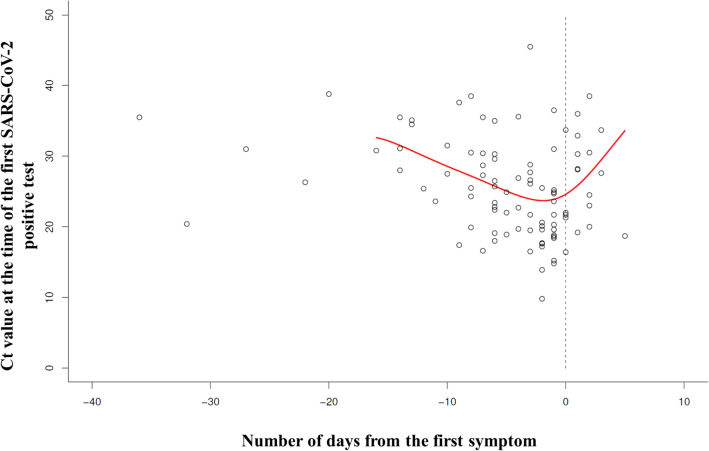
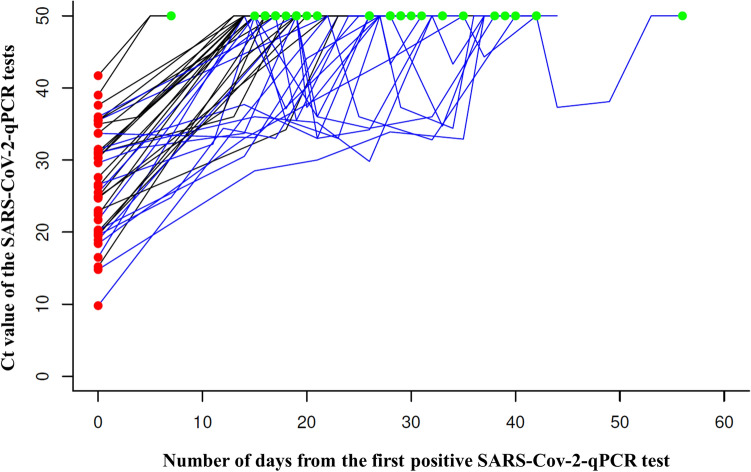
Research objective was to detail COVID-19's natural trajectory in relation to the Czech population's viral load. Our prospective detailed daily questionnaire-based telemonitoring study evaluated COVID-19's impact among 105 outpatients. In accordance with government quarantine requirements, outpatients were divided into a cohort with two negative tests at the end of the disease (40 patients) and a cohort with a new algorithm (65 patients) following a 14-day quarantine. Median follow-up differed significantly between the 2 groups (23 days vs. 16 days). Only 6% of patients were asymptomatic during the entire telemonitoring period. Another 13% of patients were diagnosed asymptomatic, as suspected contacts, yet later developed symptoms, while the remaining 81% were diagnosed as symptomatic on average 6 days following symptom onset. Telemonitoring enabled precise symptom status chronicling. The most frequently reported complaints were fevers, respiratory issues, and anosmia. Six patients were eventually hospitalized for complications detected early after routine telemonitoring. During the extended follow-up (median 181 days), anosmia persisted in 26% of patients. 79% of patients in the new quarantine algorithm cohort reported no symptoms on day 11 compared to just 56% of patients in the two negative test cohort upon first testing negative (median-19 days). The highest viral load occurred within 0-2 days of initial symptom onset. Both the PCR viral load and two consecutive PCR negative sample realizations indicated high interindividual variability with a surprisingly fluctuating pattern among 43% of patients. No definitive COVID-19 symptoms or set of symptoms excepting anosmia (59%) and/or ageusia (47%) were identified. No preexisting medical conditions specifically foreshadowed disease trajectory in a given patient. Without a PCR negativity requirement for quarantine cessation, patients could exhibit fewer symptoms. Our study therefore highlights the urgent need for routine ambulatory patient telemedicine monitoring, early complication detection, intensive mass education connecting disease demeanor with subsequent swift diagnostics, and, notably, the need to reevaluate and modify quarantine regulations for better control of SARS-CoV-2 proliferation.


Conflict of interest statement

The authors declare no competing interests.

Figures

Figure 1
Figure 1
Diagram of patient selection algorithm for the analysis, which aims to describe symptoms in ambulatory monitored outpatients. PCR polymerase chain reaction.
Figure 2
Figure 2
(A) Anosmia duration in the cohort with two negative tests and the cohort with new algorithm. The box plots show anosmia duration in 23 patients in the cohort with two negative tests vs. 36 patients in the cohort with new algorithm. Three patients with a more severe disease course and longer follow-up for other objective complications were excluded from the new algorithm cohort. The small circle at the top of the graph marks an outlier. (B) Ageusia duration in the cohort with two negative tests and the cohort with new algorithm. The box plots show ageusia duration among 19 patients in the cohort with two negative tests vs. 27 patients in the cohort with new algorithm. Three patients with a more severe disease course and longer follow-up for objective complications were excluded from the new algorithm cohort.
Figure 3
Figure 3
The frequency and co-occurrence of COVID-19 symptoms in outpatients. Circular visualization showing the frequency of symptoms’ co-occurrence. Arc length corresponds to the frequency of symptoms, whereas the width of the ribbons between 2 symptoms shows the frequency of co-occurrence. Only symptoms co-occurring in more than three patients were included.
Figure 4
Figure 4
The correlation between COVID-19-symptoms’ co-occurrence in outpatients evaluated by using the Pearson’s Chi-squared tests (upper right) and Fisher’s odds ratio exact tests (lower left). Figure represents the relation between symptoms’ co-occurrence. The diagonal from the upper left corner to the lower right corner contains frequency histograms of each variable (green—symptom absent; red—symptom present). The Pearson’s Chi-squared tests (on the right top of the diagonal) measure the strength of a linear association between categorical variables presented by the Pearson correlation coefficient. The Fisher’s odds ratio exact tests (on the bottom left of the diagonal; red and blue numbers indicate positive and negative associations, respectively) represent the ordinal dependence between two measured quantities. Each significance level is depicted by stars: *p < 0.05; **p < 0.01; ***p < 0.001. Only symptoms co-occurring in more than three patients were included. COVID-19 Coronavirus Disease 2019.
Figure 5
Figure 5
The relationship between comorbidities and the number of symptoms in outpatients. Figure represents the relationship between the total number of comorbidities and the total number of symptoms in outpatients (Spearman’s rank correlation r = 0.12, p = 0.21). One circle corresponds to a unique patient, however, the circles of some patients may overlap in the graph. The red line represents a non-parametric regression function.
Figure 6
Figure 6
The correlation between Ct value of the first positive test and the time of initial symptom onset. Figure shows the correlation between diagnostic Ct value (performed on day 0) and the day of initial symptoms’ onset. Each small circle represents one unique symptomatic patient (the six completely asymptomatic patients were excluded from the analysis; additionally, another four patients with unknown absolute positive Ct value were excluded). To the right of the dashed line, a total of fourteen patients detected as contacts are shown (e.g. symptoms appeared after sampling). Patients already symptomatic at the time of the first positive PCR test sampling (N = 81) are displayed directly on the dashed line and to the left side of the dashed line. The correlation red curve between diagnostic Ct values and sampling time in relation to the symptoms’ onset is plotted U-shape. Ct cycle threshold, PCR polymerase chain reaction, SARS-CoV-2 severe acute respiratory syndrome coronavirus 2.
Figure 7
Figure 7
Viral load dynamics in the cohort with two negative tests. Figure illustrates the viral load dynamics of a total of 40 diagnostic (red points on the left side of the graph) and 148 follow-up samples evaluated in 40 patients from the cohort with two negative tests. The second negative tests are highlighted as green points at the top of the graph. Constantly increasing virus elimination curves are colored black, while fluctuating ones are blue. SARS-CoV-2 severe acute respiratory syndrome coronavirus 2, Ct cycle threshold, qPCR quantitative polymerase chain reaction.

Similar articles

Cited by

References

    1. WHO. Coronavirus disease (COVID-19) pandemic. https://www.who.int/emergencies/diseases/novel-coronavirus-2019. Accessed 20 Dec 2020.
    1. Borges do Nascimento, I. J. et al. Clinical, laboratory and radiological characteristics and outcomes of novel coronavirus (SARS-CoV-2) infection in humans: A systematic review and series of meta-analyses. PLoS One.15, e0239235 (2020). - PMC - PubMed
    1. Struyf T, et al. Signs and symptoms to determine if a patient presenting in primary care or hospital outpatient settings has COVID-19 disease. Cochrane Database Syst. Rev. 2020;7:CD013665. - PMC - PubMed
    1. Tenforde MW, et al. Symptom duration and risk factors for delayed return to usual health among outpatients with COVID-19 in a multistate health care systems network—United States, March–June 2020. MMWR Morb. Mortal Wkly. Rep. 2020;69:993–998. doi: 10.15585/mmwr.mm6930e1. - DOI - PMC - PubMed
    1. Jung C-Y, et al. Clinical characteristics of asymptomatic patients with COVID-19: A Nationwide Cohort Study in South Korea. Int. J. Infect. Dis. 2020;99:266–268. doi: 10.1016/j.ijid.2020.08.001. - DOI - PMC - PubMed

Publication types