. 2021 May 12;11(1):10143.
doi: 10.1038/s41598-021-89575-9.

Paracoccus denitrificans: a genetically tractable model system for studying respiratory complex I

Affiliations

Paracoccus denitrificans: a genetically tractable model system for studying respiratory complex I

Owen D Jarman et al. Sci Rep. .

Abstract

Mitochondrial complex I (NADH:ubiquinone oxidoreductase) is a crucial metabolic enzyme that couples the free energy released from NADH oxidation and ubiquinone reduction to the translocation of four protons across the inner mitochondrial membrane, creating the proton motive force for ATP synthesis. The mechanism by which the energy is captured, and the mechanism and pathways of proton pumping, remain elusive despite recent advances in structural knowledge. Progress has been limited by a lack of model systems able to combine functional and structural analyses with targeted mutagenic interrogation throughout the entire complex. Here, we develop and present the α-proteobacterium Paracoccus denitrificans as a suitable bacterial model system for mitochondrial complex I. First, we develop a robust purification protocol to isolate highly active complex I by introducing a His6-tag on the Nqo5 subunit. Then, we optimize the reconstitution of the enzyme into liposomes, demonstrating its proton pumping activity. Finally, we develop a strain of P. denitrificans that is amenable to complex I mutagenesis and create a catalytically inactive variant of the enzyme. Our model provides new opportunities to disentangle the mechanism of complex I by combining mutagenesis in every subunit with established interrogative biophysical measurements on both the soluble and membrane bound enzymes.


Conflict of interest statement

The authors declare no competing interests.

Figures

Figure 1
Figure 1
Purification and subunit composition of P. denitrificans complex I. (a) Typical Ni-affinity chromatography trace produced using a HisTrap HP column. The column was washed with 80 mM imidazole and protein eluted with 200 mM imidazole. (b) Typical size exclusion chromatography trace using a Superdex 200 increase 5/150 GL column. Complex I was identified by measuring the relative NADH:APAD+ activity in eluted fractions (black trace). (c) SDS-PAGE analysis of purified P. denitrificans complex I. Two full-length lanes are shown from a single gel; the image has been cut and they have been moved to be adjacent to each other. The original image is shown in SI Fig. S6. Individual complex I subunits were identified and assigned by excising each band, treating the sample with trypsin and analyzing the resultant peptides by mass spectrometry. Peptides were assigned to a subunit/protein by peptide mass fingerprinting.
Figure 2
Figure 2
EPR spectra of NADH-reduced purified complex I from P. denitrificans. (a) Complex I (5.8 mg mL–1) was reduced anaerobically with 15 mM NADH. EPR spectra were recorded at 100 kHz modulation frequency with a modulation amplitude of 7 G and a microwave power of 2.02 mW at the temperatures indicated. Vertical lines correspond to the g factors for the individual FeS clusters. (b) Simulation of the EPR spectrum of purified Pd-CI at 16 K. The total simulation of the combined FeS cluster signals is shown in red, with the individual simulations labelled according to the established nomenclature. FeS clusters N1b-N4 were simulated at a 1:1 ratio. Simulation parameters are given in SI Table S2.
Figure 3
Figure 3
Characterization of purified complex I from P. denitrificans. (a) KM curve for DQ and Q1 substrates for a typical sample of soluble complex I. The KM values for DQ and Q1 are 169 ± 15 and 124 ± 8 µM, respectively (± S.E. of the fit). (b) Piericidin A and rotenone IC50 titration curves for soluble complex I, using DQ as the substrate. The IC50 values of piericidin A and rotenone are 72 ± 7 nM and 2226 ± 185 nM, respectively (± S.E. of the fit).
Figure 4
Figure 4
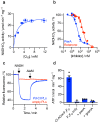
Characterization of Pd-CI in liposomes. (a) KM curve for Q10 in proteoliposomes. The KM and Vmax values were determined to be 1.1 ± 0.2 mM and 27.9 ± 1.2 µmol min–1 (mg CI)–1, respectively (± S.E.M. of the fit). (b) Inhibition by piericidin A and rotenone. The measured IC50 values for piericidin A and rotenone were 24 ± 3 nM and 452 ± 48 nM, respectively (± S.E. of the fit). (c) Proton pumping measured by an ACMA fluorescence quench assay. Proton pumping was initiated by addition of 1 mM NADH and proteoliposomes uncoupled by addition of 25 µg mL–1 alamethicin (AlaM). Liposomes without Pd-CI were added as a control. (d) Coupling Pd-CI catalysis to ATP synthesis. Pd-CI was co-reconstituted in liposomes with E. coli ATP synthase (CI-AOX-F1FO) and NADH-coupled ATP production was measured as luminescence using a luciferase-based assay. No ATP was generated by proteoliposomes containing only ATP synthase (F1FO only) while addition of 2 μM piericidin A (pierA) or 20 μg mL–1 gramicidin A (gramA) inhibited ATP synthesis. Alternative oxidase (AOX) was directly added to the assay mixture at 20 µg mL–1 in panels (ac) and at 5 µg mL–1 in panel (d). See “Materials and methods” for the assembly of proteoliposomes and other assay conditions.
Figure 5
Figure 5
Creation of a catalytically inactive complex I variant. (a) Growth of wild-type P. denitrificans in succinate minimal media,. Cells were grown with/without 10 mM taurine to induce NDH-2 expression and with/without 5 µM piericidin A to inhibit complex I and cell growth. (b) Comparison of the complex I flavin site activity (NADH:APAD+) of wild-type and the K232QNqo13 variant measured in three different contexts. Membrane activities were measured using dNADH due to the expression of NDH-2 during cell growth. The specific activities have been normalized to the wild type activities; in membranes (0.527 ± 0.006 µmol min–1 mg–1, S.E.M. n = 3), purified CI (12.13 ± 0.14 µmol min–1 mg–1, S.E.M. n = 4), and proteoliposomes (10.71 ± 0.12 µmol min–1 mg–1, S.E.M. n = 3). (c) Comparison of the quinone reductase activity (Q10 or DQ) of wild-type and the K232QNqo13 variant measured in three different contexts. The specific activities have been normalized to the wild type activities (minus the average piericidin A insensitive rates) in membranes (2.41 ± 0.02 µmol min–1 mg–1, S.E.M. n = 3), purified enzyme (19.73 ± 0.058 µmol min–1 mg–1, S.E.M. n = 3), and proteoliposomes (41.45 ± 0.17 µmol min–1 mg–1, S.E.M. n = 3).

Similar articles

Cited by

References

    1. Hirst J. Mitochondrial complex I. Annu. Rev. Biochem. 2013;82:551–575. doi: 10.1146/annurev-biochem-070511-103700. - DOI - PubMed
    1. Kaila VRI. Long-range proton-coupled electron transfer in biological energy conversion: Towards mechanistic understanding of respiratory complex I. J. R. Soc. Interface. 2018;15:20170916. doi: 10.1098/rsif.2017.0916. - DOI - PMC - PubMed
    1. Parey K, Wirth C, Vonck J, Zickermann V. Respiratory complex I: Structure, mechanism and evolution. Curr. Opin. Struct. Biol. 2020;63:1–9. doi: 10.1016/j.sbi.2020.01.004. - DOI - PubMed
    1. Balaban RS, Nemoto S, Finkel T. Mitochondria, oxidants, and aging. Cell. 2005;120:483–495. doi: 10.1016/j.cell.2005.02.001. - DOI - PubMed
    1. Murphy MP. How mitochondria produce reactive oxygen species. Biochem. J. 2009;417:1–13. doi: 10.1042/BJ20081386. - DOI - PMC - PubMed

Publication types

Substances

LinkOut - more resources