. 2021 May 12;4(1):564.
doi: 10.1038/s42003-021-02093-2.

Sterol O-acyltransferase 2 chaperoned by apolipoprotein J facilitates hepatic lipid accumulation following viral and nutrient stresses

Affiliations

Sterol O-acyltransferase 2 chaperoned by apolipoprotein J facilitates hepatic lipid accumulation following viral and nutrient stresses

Hung-Yu Sun et al. Commun Biol. .

Abstract

The risks of non-alcoholic fatty liver disease (NAFLD) include obese and non-obese stresses such as chronic hepatitis C virus (HCV) infection, but the regulatory determinants remain obscure. Apolipoprotein J (ApoJ) served as an ER-Golgi contact-site chaperone near lipid droplet (LD), facilitating HCV virion production. We hypothesized an interplay between hepatic ApoJ, cholesterol esterification and lipid deposit in response to NAFLD inducers. Exposures of HCV or free-fatty acids exhibited excess LDs along with increased ApoJ expression, whereas ApoJ silencing alleviated hepatic lipid accumulation. Both stresses could concomitantly disperse Golgi, induce closer ApoJ and sterol O-acyltransferase 2 (SOAT2) contacts via the N-terminal intrinsically disordered regions, and increase cholesteryl-ester. Furthermore, serum ApoJ correlated positively with cholesterol and low-density lipoprotein levels in normal glycaemic HCV patients, NAFLD patients and in mice with steatosis. Taken together, hepatic ApoJ might activate SOAT2 to supply cholesteryl-ester for lipid loads, thus providing a therapeutic target of stress-induced steatosis.


Conflict of interest statement

The authors declare no competing interests.

Figures
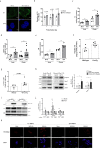
Fig. 1
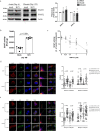
Fig. 1. ApoJ participated in HCV-induced lipid accumulation.
a Representative images of LDs in Huh7.5 cells with mock or HCV infection at day 6 post-infection. Scale bar, 5 μm. b The diameters of LDs (n > 2000) were quantified with ImageJ software. The data were collected from three independent experiments (n ≧ 8). Quantification of the intracellular contents of TC (c), CE/FC ratio (d), and TG (e) with acute or chronic HCV infections (n ≧ 6). The hepatic TC level (f) and CE/FC ratio (g) in wild type (n = 5) and HCV coreTg mice (n = 7). h Protein levels of ApoJ and HCV-NS3 in Huh7.5 cells with acute or chronic HCV infections. The right panel: ApoJ intensities (n = 3); psApoJ, ApoJ precursor. i Protein levels of ApoJ and HCV core in control and ApoJ-silenced Huh7.5 cells inoculated with HCV (MOI = 0.01) at day 6 post-infection. j TC, CE/FC ratio and TG contents and with HCV infection in the control and ApoJ-silenced Huh7.5 cells at day 6 post-infection. All results are presented as the mean ± SEM, and asterisks indicate statistical significance (p < 0.05). k Images of LDs visualized by CholEsteryl BODIPY™ 542/563 C11 tracer with MOI = 0.01 or 0.5 at post-infection day 3. Scale bar, 50 μm. Uncropped blots of h and thereafter are displayed in Supplementary Figs. 15–30.
Fig. 2
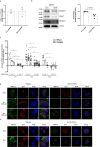
Fig. 2. HCV infection induced the co-localization of ApoJ with SOAT2 and elevated SOAT activity in the context of Golgi dispersion.
a Protein levels of SOAT1 and SOAT2 in Huh7.5 cells with acute or chronic HCV infections, with the intensities shown in the right panel (n ≧ 2). b HCV-infected Huh7.5 cells were fed with NBD-Chol, and the SOAT activity was evaluated (n = 6). c HCV-infected Huh7.5 cells were treated with 0.25–2 μM TMP153 for 16 h and the SOAT activity was quantified as in b. The asterisk indicates statistical significance (p < 0.05) as compared to the untreated control. d Representative IFA images of SOAT2 (red) and Golgi (TGN38, green) in HCV-infected cells. The scatter plots of red and green channels, as shown at the right of the merged image, and the Pearson’s and Mander’s colocalization coefficients were analysed by the Coloc2 plugin from ImageJ/Fiji (ImageJ-Fiji-ImgLib http://fiji.sc/), respectively, as shown in the right panel. The fluorescence intensity profile across the arrow for both channels was analysed by FVW31S software. e Representative IFA images of SOAT2 (red) and ApoJ (green) analysed as in d. Scale bar, 5 μm.
Fig. 3
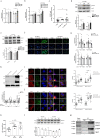
Fig. 3. FFA-induced hepatic lipid accumulation depended on ApoJ.
The cellular contents of TC and TG were quantified in Huh7 cells treated with PA (a) or OA (b) for 24 h (n ≧ 5), CE/FC ratio of PA and OA treated cells (c) (n ≧ 6), and ApoJ expression in Huh7 cells treated with PA (d) or OA (e). The lower panel: ApoJ intensities (n = 3); psApoJ, ApoJ precursor. f Representative images of LDs stained with BODIPY493/503, and g quantification of lipid contents in Huh7.5 cells bearing Luc or ApoJ shRNA treated with PA or OA for 24 h. Scale bar, 100 μm in f. h Quantification of lipid contents in the cells transfected with ApoJ expressing plasmid or control vector. All results are normalized to the respective untreated control and presented as the mean ± SEM (n ≧ 5), and asterisks indicate statistical significance (p < 0.05). Representative IFA images of SOAT2 (red) and Golgi (TGN38, green) (i); SOAT2 and ApoJ (green) (j) in PA- or OA-treated cells were analysed by Coloc2 plugin and FVW31S software as in Fig. 2d. Scale bar, 5 μm. Asterisks indicate statistical significance (p < 0.05). k The PA- (200 μM) or OA- (800 μM) treated Huh7 cells were fed with NBD-Chol, and the SOAT activity was evaluated and expressed as the mean ± SEM (n = 6). l The protein level of SOAT2 in Huh7 cells treated with PA or OA for 24 h. The lower panel: SOAT2 intensities (n ≧ 2). m Huh7 cells were treated with 800 μM OA for 24 h. The cell lysate was immunoprecipitated with antibody against ApoJ and examined by western blot analysis recognizing SOAT1, SOAT2, and ApoJ.
Fig. 4
Fig. 4. ApoJ silencing reduced SOAT2 expression and SOAT enzymatic activity.
Huh7.5 cells bearing Luc or ApoJ shRNA were established to examine a SOAT2 mRNA (n = 3); b SOAT2 protein expression (representative image in left panel; SOAT2 intensity in right panel, n = 4) and; c SOAT enzymatic activity in the presence of FFAs or HCV infection at MOI = 0.01 for 6 days with and without TMP153 treatment; and d, e image visualization of NBD-CE under confocal microscopy observation. The data were presented as the mean ± SEM (n ≧ 6), and asterisks indicate statistical significance (p < 0.05) between the control and ApoJ knockdown cells. Scale bar, 5 μm.
Fig. 5
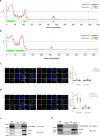
Fig. 5. ApoJ co-localized with SOAT2 by recognizing the IDR region.
The IDR regions of SOAT1 (UniProt ID: P35610, a) and SOAT2 (UniProt ID: O75908, b) were predicted by D2P2 (http://d2p2.pro/search) and IUPred2A (https://iupred2a.elte.hu/) algorithms, respectively. Huh7 cells were transfected with SOAT1-DsRed (c, the left panels), IDR-truncated SOAT1-DsRed (ΔSOAT1-DsRed, c, the right panels); SOAT2-DsRed (d, the left panels), and IDR-truncated SOAT2-DsRed (ΔSOAT2-DsRed, d the right panels), followed by administration of PA (100 μM) or OA (400 μM) for 24 h, and visualized with confocal microscopy. The fluorescence intensity was analysed by FVW31S software. The Mander’s coefficient was analysed by ImageJ with the Coloc2 plugin from ImageJ/Fiji shown above. Scale bar, 5 μm. Huh7 cells were transfected with plasmids encoding SOAT2-DsRed (e) or ΔSOAT2-DsRed (f). The cell lysates were immunoprecipitated with antibody against ApoJ and examined by western blot analysis recognizing DsRed and apoJ.
Fig. 6
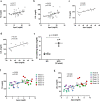
Fig. 6. The circulating ApoJ levels exhibited positive correlations with LDL and Chol.
The correlations of ApoJ vs. a TC and b LDL in CHC patients; and c TC and d LDL in NAFLD patients with steatosis grade ≧ 2 are shown. e The serum ApoJ levels of mice with an ND or HFD for 18 weeks were determined by ELISA quantification and are presented as the mean ± range (n = 6). The correlations of serum ApoJ vs. TC (f) and LDL (g) in mice with HFD-induced steatosis from 8 to 18 weeks feeding time intervals.
Fig. 7
Fig. 7. The proposed model of ApoJ/SOAT2 axis in stress-induced hepatosteatosis.
In hepatocytes facing stress, ApoJ mobilizes along with dispersed Golgi to the Golgi–ER contact site, where ApoJ interacts with ER-resident SOAT2 at the N-terminal IDR region and coordinates Chol esterification to produce CE for LD deposition and lipoprotein loading.

Similar articles

Cited by

References

    1. Arab JP, Arrese M, Trauner M. Recent insights into the pathogenesis of nonalcoholic fatty liver disease. Annu. Rev. Pathol. 2018;13:321–350. doi: 10.1146/annurev-pathol-020117-043617. - DOI - PubMed
    1. Goh GB, McCullough AJ. Natural history of nonalcoholic fatty liver disease. Dig. Dis. Sci. 2016;61:1226–1233. doi: 10.1007/s10620-016-4095-4. - DOI - PMC - PubMed
    1. Argo CK, Caldwell SH. Epidemiology and natural history of non-alcoholic steatohepatitis. Clin. Liver Dis. 2009;13:511–531. doi: 10.1016/j.cld.2009.07.005. - DOI - PubMed
    1. Schade, M. et al. Cellular senescence and their role in liver metabolism in health and disease: overview and future directions. World J. Surg. Surgcal Res. 1, 1035 (2018).
    1. Fujimoto T, Parton RG. Not just fat: the structure and function of the lipid droplet. Cold Spring Harb. Perspect. Biol. 2011;3:a004838. doi: 10.1101/cshperspect.a004838. - DOI - PMC - PubMed

Publication types

MeSH terms