. 2021 May 12;4(1):80.
doi: 10.1038/s41746-021-00453-0.

An artificial intelligence system for predicting the deterioration of COVID-19 patients in the emergency department

Affiliations

An artificial intelligence system for predicting the deterioration of COVID-19 patients in the emergency department

Farah E Shamout et al. NPJ Digit Med. .

Abstract

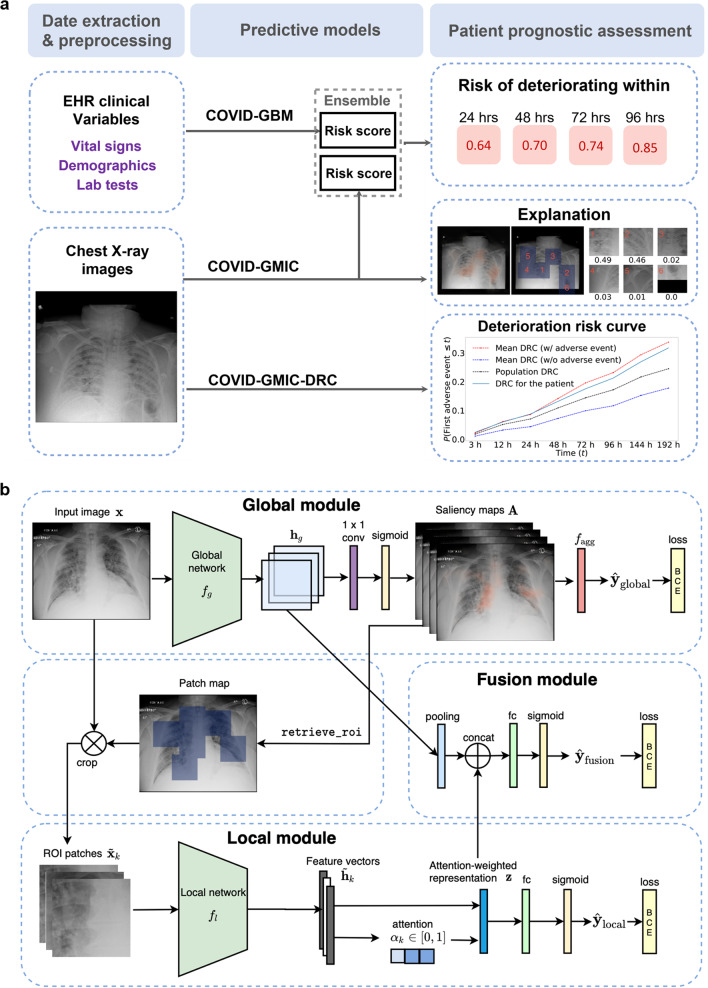
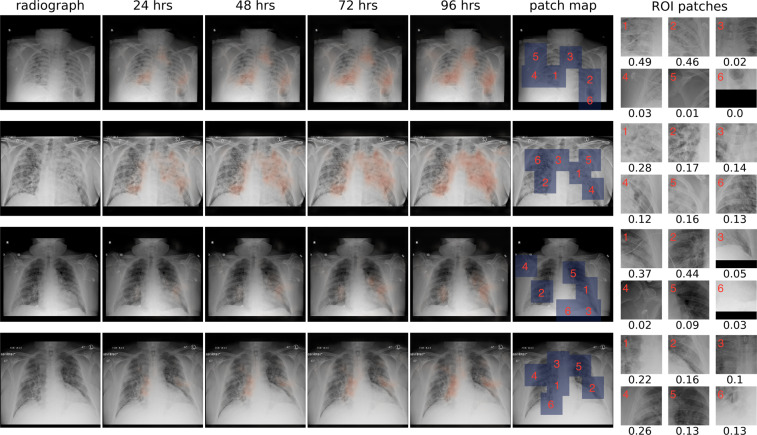
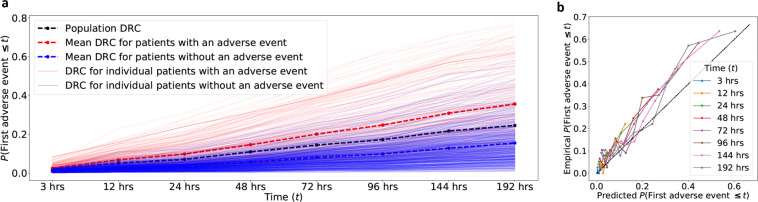
During the coronavirus disease 2019 (COVID-19) pandemic, rapid and accurate triage of patients at the emergency department is critical to inform decision-making. We propose a data-driven approach for automatic prediction of deterioration risk using a deep neural network that learns from chest X-ray images and a gradient boosting model that learns from routine clinical variables. Our AI prognosis system, trained using data from 3661 patients, achieves an area under the receiver operating characteristic curve (AUC) of 0.786 (95% CI: 0.745-0.830) when predicting deterioration within 96 hours. The deep neural network extracts informative areas of chest X-ray images to assist clinicians in interpreting the predictions and performs comparably to two radiologists in a reader study. In order to verify performance in a real clinical setting, we silently deployed a preliminary version of the deep neural network at New York University Langone Health during the first wave of the pandemic, which produced accurate predictions in real-time. In summary, our findings demonstrate the potential of the proposed system for assisting front-line physicians in the triage of COVID-19 patients.


Conflict of interest statement

The authors declare no competing interests.

Figures

Fig. 1
Fig. 1. Overview of the AI system and the architecture of its deep learning component.
a Overview of the AI system that assesses the patient’s risk of deterioration every time a chest X-ray image is collected in the ED. We design two different models to process the chest X-ray images, both based on the GMIC neural network architecture,. The first model, COVID-GMIC, predicts the overall risk of deterioration within 24, 48, 72, and 96 h, and computes saliency maps that highlight the regions of the image that most informed its predictions. The predictions of COVID-GMIC are combined with predictions of a gradient boosting model that learns from routinely collected clinical variables, referred to as COVID-GBM. The second model, COVID-GMIC-DRC, predicts how the patient’s risk of deterioration evolves over time in the form of deterioration risk curves. b Architecture of COVID-GMIC. First, COVID-GMIC utilizes the global network to generate four saliency maps that highlight the regions on the X-ray image that are predictive of the onset of adverse events within 24, 48, 72, and 96 h, respectively. COVID-GMIC then applies a local network to extract fine-grained visual details from these regions. Finally, it employs a fusion module that aggregates information from both the global context and local details to make a holistic diagnosis.
Fig. 2
Fig. 2. Illustrations of the dataset and the dataset flowchart.
a Examples of chest X-ray images in our dataset. Example 1: Patient was discharged and experienced no adverse events (44 years old male). Example 2: Patient was transferred to the ICU after 95 h (71 years old male). Example 3: Patient was intubated after 72 h (66 years old male). Example 4: Patient was transferred to the ICU after 48 h (99 years old female). Example 5: Patient was intubated after 24 h (74 years old male). Example 6: Patient was transferred to the ICU in 30 min (73 years old female). It is important to note that the extent of parenchymal disease does not necessarily have a direct correlation with deterioration time. For example, Example 5 has less severe parenchymal findings than Examples 3 and 4, but deteriorated faster. b Flowchart showing how the inclusion and exclusion criteria were applied to obtain the final training and test sets, where n represents the number of chest X-ray exams, and p represents the number of unique patients. Specifically, we excluded 783 exams that were not linked to any radiology report, nine exams that had missing encounter information, and 5213 exams from patients who were still hospitalized by May 13, 2020. To ensure that our system predicts deterioration prior to its occurrence, we excluded 6260 exams that were collected after an adverse event and 187 exams of already intubated patients. The final dataset consisted of 7502 chest X-ray exams corresponding to 4204 unique patients. We split the dataset at the patient level such that exams from the same patient exclusively appear either in the training or test set. In the training set, we included exams that were collected both in the ED and during inpatient encounters. Since the intended clinical use of our model is in the ED, the test set only includes exams collected in the ED and hence we excluded 543 patients who did not have exams collected in the ED. This resulted in 5224 exams (5617 images) in the training set and 770 exams (832 images) in the test set. We included both frontal and lateral images, however there were less than 50 lateral images in the entire dataset.
Fig. 3
Fig. 3. Explainability of COVID-GMIC.
From left to right: the original X-ray image, saliency maps for clinical deterioration within 24, 48, 72, and 96 h, locations of region-of-interest (ROI) patches, and ROI patches with their associated attention scores. All four patients were admitted to the intensive care unit and were intubated within 48 h. In the first example, there are diffuse airspace opacities, though the saliency maps primarily highlight the medial right basal and peripheral left basal opacities. Similarly, the two ROI patches (1 and 2) on the basal region demonstrate comparable attention values, 0.49 and 0.46, respectively. In the second example, the extensive left mid to upper-lung abnormality (ROI patch 1) is highlighted, which correlates with the most extensive area of parenchymal consolidation. In the third example, the saliency maps highlight the left mid lung (ROI patch 1) and right hilar/infrahilar regions (ROI patch 2) which show groundglass opacities. In the last example, the saliency maps highlight the right infrahilar region (ROI patch 1) and the left mid lung periphery (ROI patch 2). The ROI patch 4 is also assigned the highest attention score as a predictive region of clinical deterioration, which corresponds to dense peripheral right upper lobe consolidation.
Fig. 4
Fig. 4. Deterioration risk curves (DRCs) and reliability plot for COVID-GMIC-DRC.
a DRCs generated by the COVID-GMIC-DRC model for patients in the test set with (faded red lines) and without adverse events (faded blue lines). The mean DRC for patients with adverse events (red dashed line) is higher than the DRC for patients without adverse events (blue dashed line) at all times. The graph also includes the ground-truth population DRC (black dashed line) computed from the test data. b Reliability plot of the DRCs generated by the COVID-GMIC-DRC model for patients in the test set. The empirical probabilities are computed by dividing the patients into deciles according to the value of the DRC at each time t. The empirical probability equals the fraction of patients in each decile that suffered adverse events up to t. This is plotted against the predicted probability, which equals the mean DRC of the patients in the decile. Perfect calibration is indicated by the diagonal black dashed line.

Update of

Similar articles

Cited by

References

    1. Baugh JJ, et al. Creating a COVID-19 surge clinic to offload the emergency department. Am. J. Emerg. Med. 2020;38:1535–1537. doi: 10.1016/j.ajem.2020.04.057. - DOI - PMC - PubMed
    1. Debnath S, et al. Machine learning to assist clinical decision-making during the COVID-19 pandemic. Bioelectron. Med. 2020;6:1–8. doi: 10.1186/s42234-020-00050-8. - DOI - PMC - PubMed
    1. Whiteside T, Kane E, Aljohani B, Alsamman M, Pourmand A. Redesigning emergency department operations amidst a viral pandemic. Am. J. Emerg. Med. 2020;38:1448–1453. doi: 10.1016/j.ajem.2020.04.032. - DOI - PMC - PubMed
    1. Dorsett, M. Point of no return: COVID-19 and the us health care system: an emergency physician’s perspective. Sci. Adv. 6 eabc5354 (2020). - PMC - PubMed
    1. McKenna P, et al. Emergency department and hospital crowding: causes, consequences, and cures. Clin. Exp. Emerg. Med. 2019;6:189. doi: 10.15441/ceem.18.022. - DOI - PMC - PubMed

LinkOut - more resources