. 2021 Aug;125(3):422-432.
doi: 10.1038/s41416-021-01400-2. Epub 2021 May 12.

Pan-cancer association of HLA gene expression with cancer prognosis and immunotherapy efficacy

Affiliations

Pan-cancer association of HLA gene expression with cancer prognosis and immunotherapy efficacy

Evelien Schaafsma et al. Br J Cancer. 2021 Aug.

Abstract

Background: The function of major histocompatibility complex (MHC) molecules is to bind peptide fragments derived from genomic mutations or pathogens and display them on the cell surface for recognition by cognate T cells to initiate an immune response.

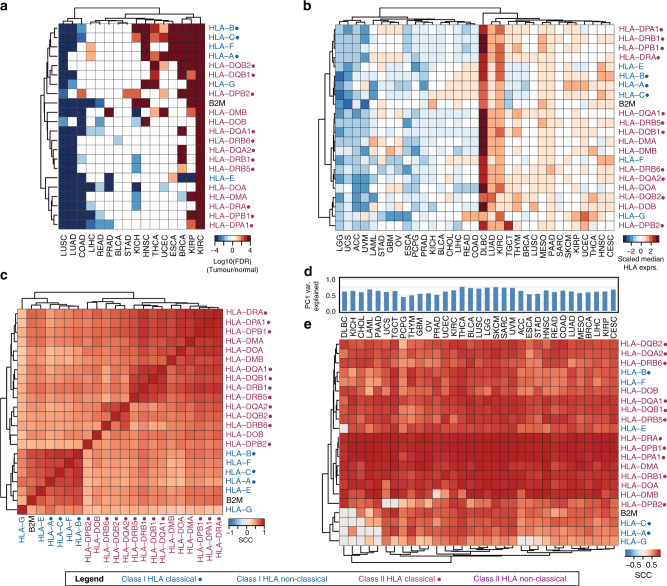
Methods: In this study, we provide a comprehensive investigation of HLA gene expression in a pan-cancer manner involving 33 cancer types. We utilised gene expression data from several databases and immune checkpoint blockade-treated patient cohorts.

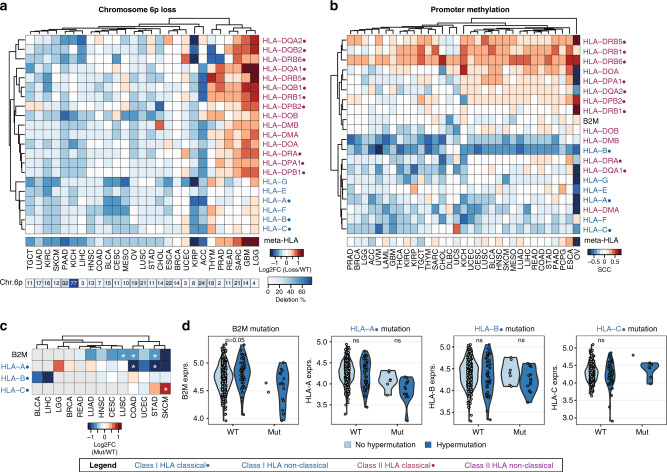
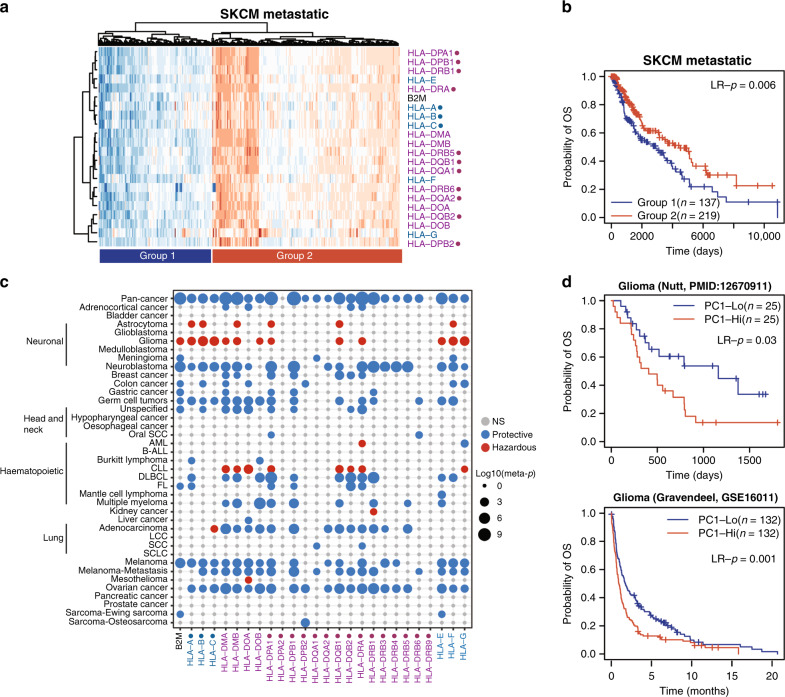
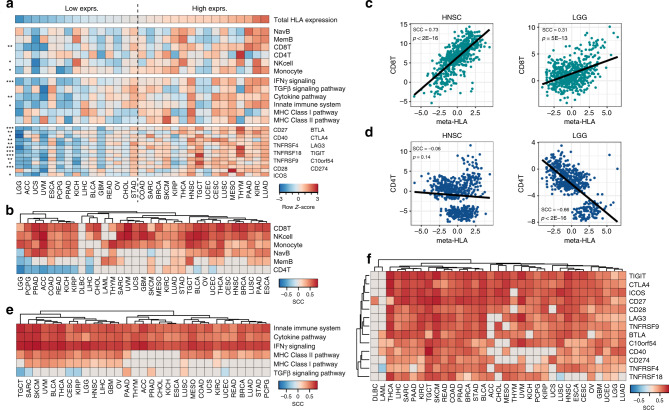
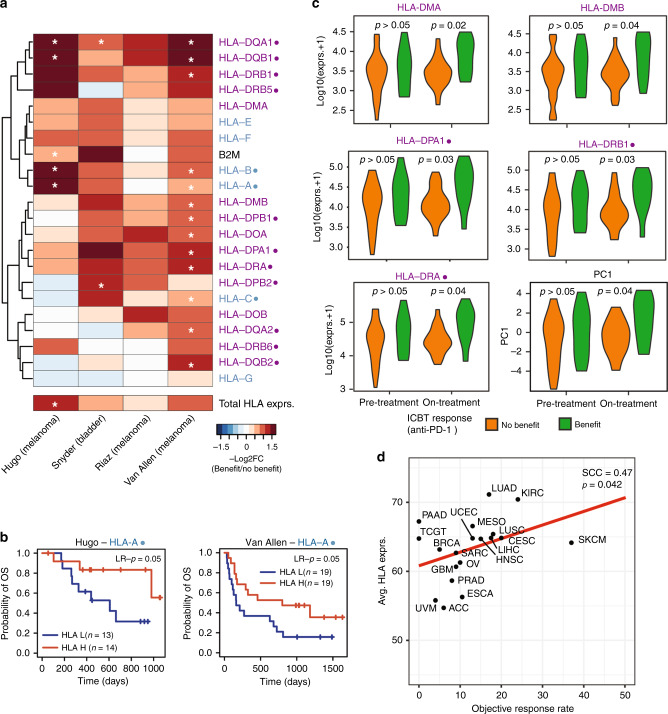
Results: We show that MHC expression varies strongly among cancer types and is associated with several genomic and immunological features. While immune cell infiltration was generally higher in tumours with higher HLA gene expression, CD4+ T cells showed significantly different correlations among cancer types, separating them into two clusters. Furthermore, we show that increased HLA gene expression is associated with prolonged survival in the majority of cancer types. Lastly, HLA gene expression is associated with patient response to immune checkpoint blockade, which is especially prominent for HLA class II expression in tumour biopsies taken during treatment.

Conclusion: We show that HLA gene expression is an important feature of tumour biology that has significant impact on patient prognosis.


Conflict of interest statement

The authors declare no competing interests.

Figures

Fig. 1
Fig. 1. HLA mRNA expression comparison across cancer types and HLA genes.
a Heatmap comparing the expression between all HLA/B2M between normal and tumour tissue. Displayed are −log10(p-value) values of t-tests comparing HLA/B2M expression in normal and tumour tissue. P-values were adjusted by the Bonferroni procedure. All adjusted p-values > 0.05 were considered non-significant and set to −log10(p) = 0. P-values received a negative sign if the log2FC between normal and tumour was negative (i.e. higher expression in normal tissue). Values greater than |4| were set to 4. b Median HLA/B2M gene expression by cancer type and HLA gene. c Correlation matrix of HLA/B2M gene expression across all cancer types. d Percentage of variance captured by principal component 1 (PC1) in each cancer type. e Correlation matrix of the meta-HLA gene and gene expression of HLA/B2M. P-values were adjusted by the Bonferroni procedure. All correlations with adjusted p-values > 0.05 were considered non-significant and set to 0. Classical HLA genes indicated with a dot (●), HLA class I genes indicated in blue, HLA class II genes in purple.
Fig. 2
Fig. 2. Association between HLA gene expression and genomic features.
a Heatmap of the log2 fold change (log2FC) comparing HLA and B2M expression between patients with chr6p loss and patients with diploid chr6p (WT). b Heatmap of Spearman correlation coefficients (SCCs) comparing HLA/B2M promoter methylation and mRNA expression in samples with diploid chr6p. c Heatmap the log2FC comparing HLA and B2M mRNA expression between patients with and without mutations in HLA genes. Only cancer types with at least five samples displaying HLA mutations were included. Grey boxes indicate <5 samples with HLA mutations available. Stars indicate significant comparisons at p < 0.05, two-sided Student’s t-test. d Comparison of HLA gene expression in STAD between patients without (WT) and with HLA mutations (Mut). WT and Mut samples were stratified by hypermutation status (light blue = no hypermutation, dark blue = hypermutation). Significance indicated by two-sided Student’s t-tests for comparisons in which both groups had at least five samples. Classical HLA genes indicated with a dot (●), HLA class I genes indicated in blue, HLA class II genes in purple.
Fig. 3
Fig. 3. HLA gene expression associated with prognosis.
a Heatmap showing clustering of metastatic melanoma patients based on HLA gene expression. b KM plot showing a difference in survival between metastatic melanoma patients in group 1 or group 2 from (a). Significance indicated by Log-rank tests. c Heatmap displaying the −log10(meta-p-value) of univariate CoxPH regression between HLA/B2M gene expression and overall survival. Blue dots indicate a protective role for HLA gene expression, whereas red dots indicate a hazardous role. Dot sizes indicate −log10(meta-p-value). d KM plot showing the difference in survival between glioma patients with low and high meta-HLA scores in two independent datasets. Significance indicated by Log-rank tests. Classical HLA genes indicated with a dot (●), HLA class I genes indicated in blue, HLA class II genes in purple.
Fig. 4
Fig. 4. Association between meta-HLA gene expression and the tumour microenvironment.
a Overview of HLA gene expression and the TME characteristics in all cancer types. Heatmap displaying z-transformed values of total HLA gene expression, immune cell infiltration, pathway activity and immune checkpoint expression. Cancer types ordered based on total HLA gene expression. Stars indicate significance between cancer types with low and high overall HLA expression (separated by dotted line) assessed by Student t-tests. *** = <0.001, ** = <0.01, * = <0.05. b Spearman correlation coefficients (SCCs) between meta-HLA gene expression and the infiltration of six major immune cell types. c Correlation between CD8+ T-cell infiltration and meta-HLA expression in HNSC and LGG. d Correlation between CD4+ T-cell infiltration and meta-HLA expression in HNSC and LGG. e SCCs between meta-HLA gene expression and the activity of six immune pathways. f SCCs between meta-HLA gene expression and the mRNA expression of immune checkpoint proteins. All non-significant correlations (Bonferroni-corrected p > 0.05) are shown in grey.
Fig. 5
Fig. 5. HLA Class I genes associated with response to immune checkpoint blockade.
a Heatmap showing the -log10(p-values) comparing HLA gene expression in pre-treatment samples from patients with clinical benefit (complete response (CR) and partial response (PR)) to patients without the clinical benefit (progressive disease (PD)). Due to the small sample sizes, significance was indicated by a one-sided t-test hypothesising that patients with clinical benefit had higher HLA gene expression compared to patients without clinical benefit. White stars indicate significance at p < 0.05. b KM plot comparing overall survival between patients with low and high HLA-A gene expression in the Hugo and Van Allen datasets. Significance calculated by Log-rank tests. c Violin plots comparing gene expression of 5 HLA class II genes and the meta-HLA gene between patients who benefitted or did not benefit from anti-PD-1 treatment in pre- or on-treatment biopsies. Significance calculated by two-sided Student’s t-tests. d Correlation between -log10(total HLA gene expression) and ICBT objective response rate based on ref. Classical HLA genes indicated with a dot (●), HLA class I genes indicated in blue, HLA class II genes in purple.

References

    1. Neefjes J, Jongsma MLM, Paul P, Bakke O. Towards a systems understanding of MHC class I and MHC class II antigen presentation. Nat. Rev. Immunol. 2011;11:823–836. doi: 10.1038/nri3084. - DOI - PubMed
    1. Albitar M, Johnson M, Do KA, Day A, Jilani I, Pierce S, et al. Levels of soluble HLA-I and beta2M in patients with acute myeloid leukemia and advanced myelodysplastic syndrome: association with clinical behavior and outcome of induction therapy. Leukemia. 2007;21:480–488. doi: 10.1038/sj.leu.2404506. - DOI - PubMed
    1. Shiina T, Inoko H, Kulski JK. An update of the HLA genomic region, locus information and disease associations: 2004. Tissue Antigens. 2004;64:631–649. doi: 10.1111/j.1399-0039.2004.00327.x. - DOI - PubMed
    1. Roche PA, Furuta K. The ins and outs of MHC class II-mediated antigen processing and presentation. Nat. Rev. Immunol. 2015;15:203–216. doi: 10.1038/nri3818. - DOI - PMC - PubMed
    1. Braud VM, Allan DS, O’Callaghan CA, Söderström K, D’Andrea A, Ogg GS, et al. HLA-E binds to natural killer cell receptors CD94/NKG2A, B and C. Nature. 1998;391:795–799. doi: 10.1038/35869. - DOI - PubMed

Publication types

Substances