. 2021 May;593(7859):454-459.
doi: 10.1038/s41586-021-03529-9. Epub 2021 May 12.

Structures of telomerase at several steps of telomere repeat synthesis

Affiliations

Structures of telomerase at several steps of telomere repeat synthesis

Yao He et al. Nature. 2021 May.

Abstract

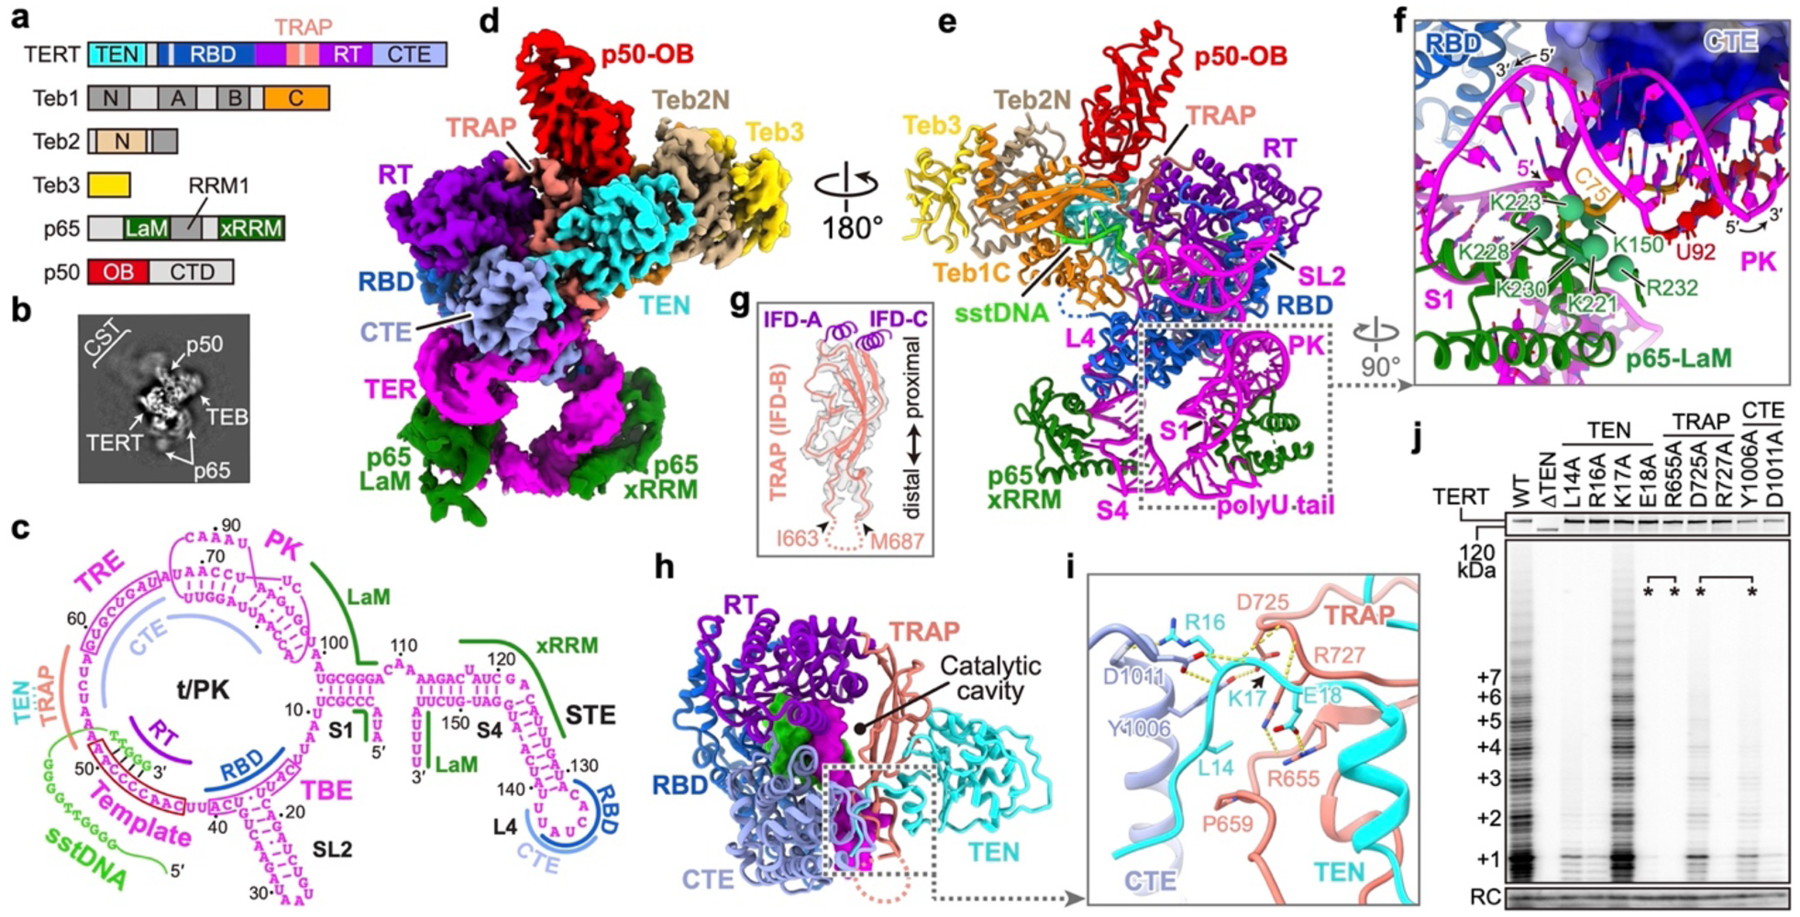
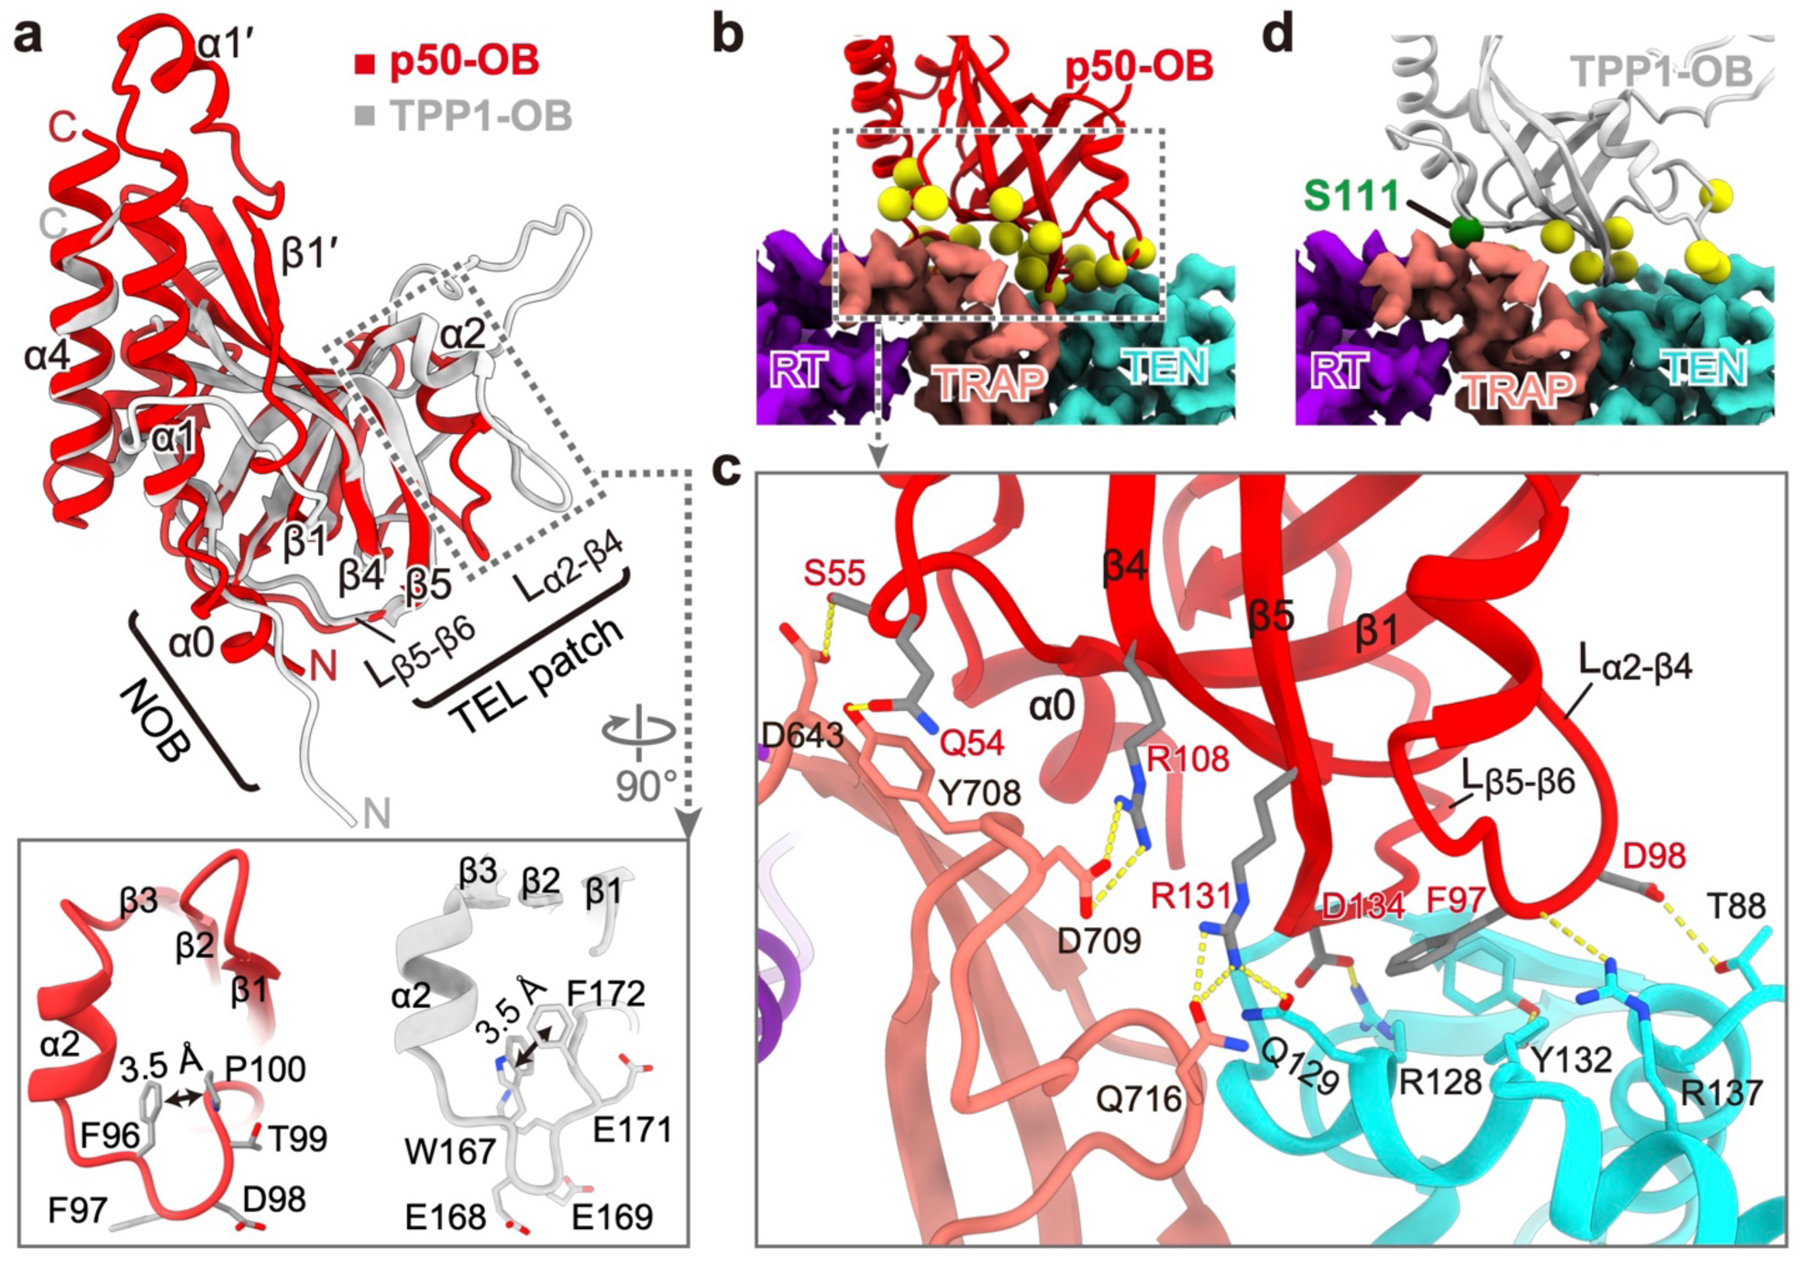
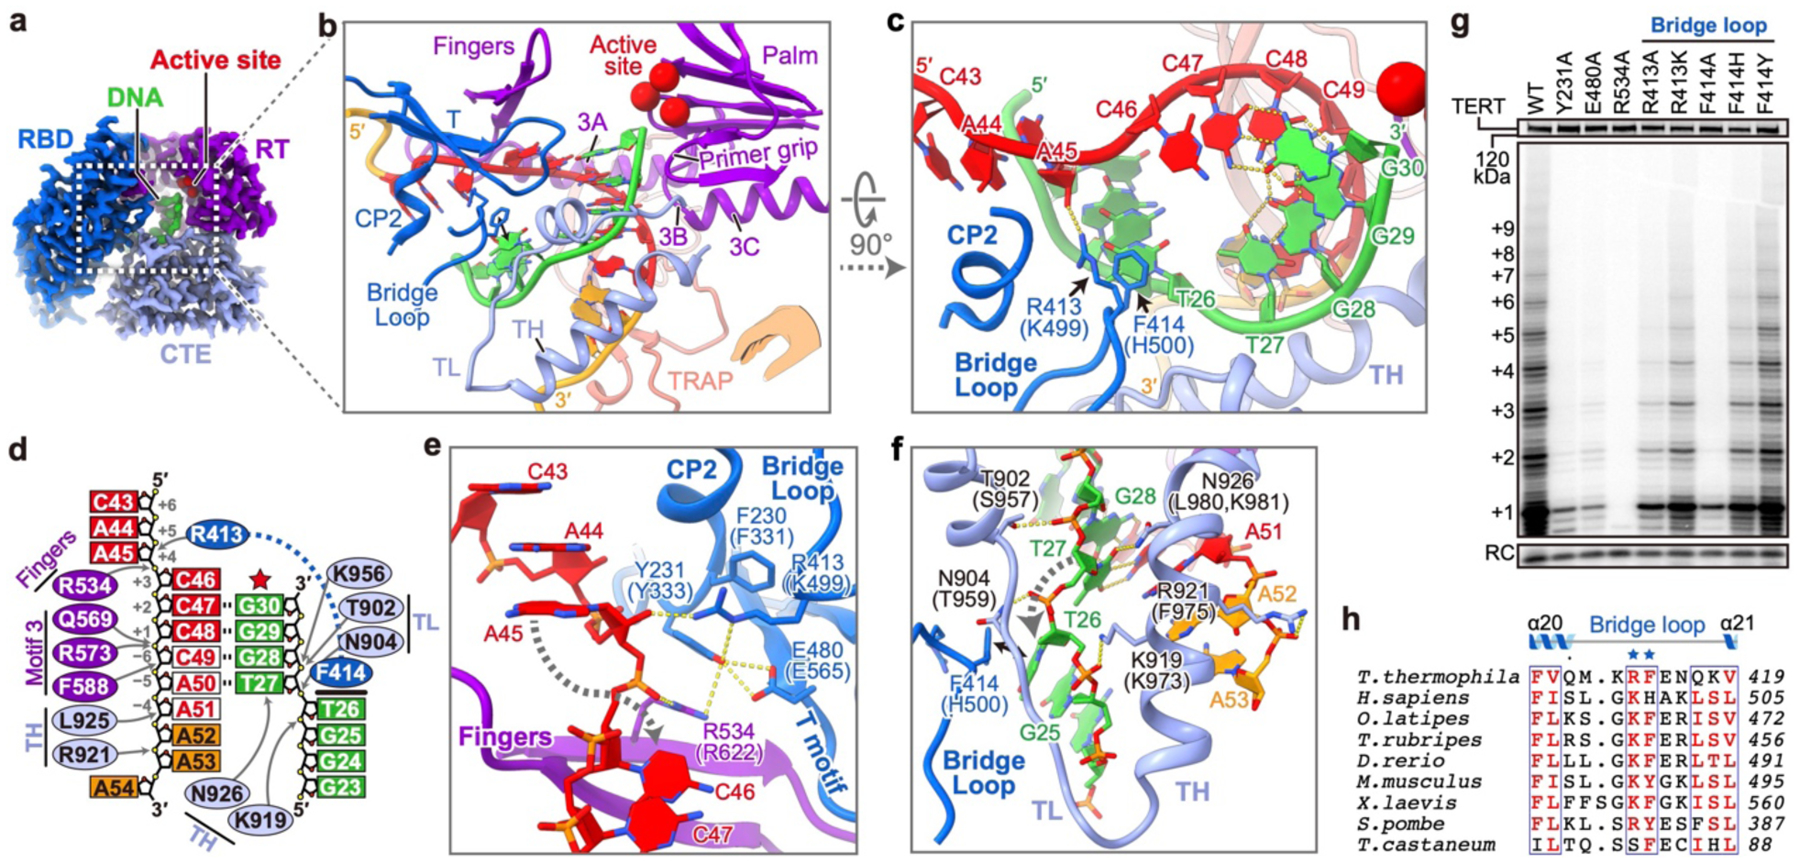
Telomerase is unique among the reverse transcriptases in containing a noncoding RNA (known as telomerase RNA (TER)) that includes a short template that is used for the processive synthesis of G-rich telomeric DNA repeats at the 3' ends of most eukaryotic chromosomes1. Telomerase maintains genomic integrity, and its activity or dysregulation are critical determinants of human longevity, stem cell renewal and cancer progression2,3. Previous cryo-electron microscopy structures have established the general architecture, protein components and stoichiometries of Tetrahymena and human telomerase, but our understandings of the details of DNA-protein and RNA-protein interactions and of the mechanisms and recruitment involved remain limited4-6. Here we report cryo-electron microscopy structures of active Tetrahymena telomerase with telomeric DNA at different steps of nucleotide addition. Interactions between telomerase reverse transcriptase (TERT), TER and DNA reveal the structural basis of the determination of the 5' and 3' template boundaries, handling of the template-DNA duplex and separation of the product strand during nucleotide addition. The structure and binding interface between TERT and telomerase protein p50 (a homologue of human TPP17,8) define conserved interactions that are required for telomerase activation and recruitment to telomeres. Telomerase La-related protein p65 remodels several regions of TER, bridging the 5' and 3' ends and the conserved pseudoknot to facilitate assembly of the TERT-TER catalytic core.


Conflict of interest statement

Competing interests The authors declare no competing interests.

Figures

Extended Data Fig. 1:
Extended Data Fig. 1:. Biochemical and biophysical evaluation of endogenously purified Tetrahymena telomerase with single-stranded telomeric DNA (sstDNA).
a, Silver-stained SDS-PAGE gel of the tandem affinity purified telomerase. Serial diluted BSA samples were loaded together to assist concentration estimation of the telomerase sample. Gel image is representative of independent biological replicates (n=3). b, Direct telomeric DNA extension assays of the purified telomerase bound with different sstDNA primers. A standard telomere addition pattern is observed when using (GTTGGG)5 or (GTTGGG)3 primer (P1 and P2). However, the translocation of product is inhibited when using (GTTGGG)2GTTGGLGLGLT primer (P3), resulting in a single dark band (red asterisk). GL denotes LNA nucleotide instead of DNA nucleotide. Note that the LNA containing product (red asterisk) migrates slightly slower through the gel than non-modified DNA. RC, recovery control. Gel image is representative of independent biological replicates (n=3). c, Motion corrected cryo-EM micrograph. d, Representative 2D class averages of telomerase particles. All results from sample purification (a), activity assays (b), and cryo-EM experiments (c) were successfully reproduced at least three times. For gel source data, see Supplementary Fig. 1.
Extended Data Fig. 2:
Extended Data Fig. 2:. Cryo-EM data processing workflow of telomerase with sstDNA (GTTGGG)5 (telomerase T3D2) and the evaluation of the reconstruction.
a, Data processing workflow (detailed in methods). Soft masks used in data processing are colored in orange. b, Euler angle distributions of telomerase particles used for the 3.3 Å resolution reconstruction. c, Local resolution evaluation of the 3.3 Å resolution cryo-EM map shown in surface views (left) and a slice view of the core region (right). d, Superposition of reconstructions P1, P2 and P3, that illustrate the rotation of TEN–TRAP. The three maps were lowpass-filtered to 6 Å and aligned on the TERT ring. p50 (red) and TEB bind to and move together with TEN–TRAP. e, Plot of the Fourier shell correlation (FSC) as a function of the spatial frequency with resolution of the final reconstruction indicated. f, FSC coefficients as a function of spatial frequency between model and cryo-EM density maps. Red curve: refined model versus half map 1 used for refinement; green curve: refined model versus half map 2 not used for refinement; black curve: refined model versus the combined final map. The generally similar appearances between the red and green curves suggests no substantial over-fitting. g, Representative cryo-EM densities (gray and mesh) encasing the related atomic models (color sticks and ribbons).
Extended Data Fig. 3:
Extended Data Fig. 3:. Detailed interactions between TERT and p65 with TER.
a, Close-up view of motif 3N (aa. 550–560). Motif 3A helix is bent toward motif 2, and motif 3N in between forms a finger shape architecture. b, Ribbon diagram of the TERT–TER “interlock” with TERT domains colored as indicated. c, Schematic of SL2, TBE and TBEL nucleotides and their interactions with TERT RBD domain. Arrows indicate sites of polar interactions. Bold line represents the stacking interaction between F242 and C39. d-f, Structure of TER L4 and its interactions with TERT RBD, CTE and p65 xRRM (green). g, Rainbow colored ribbon diagram of p65 LaM with secondary structural elements labeled. Positively charged and aromatic residues located on the interface between p65 LaM and TER are shown as spheres. h, Electrostatic surface representation of p65 LaM and its interactions with TER S1, PK and the 3′ polyU. p65 LaM in g and h are in the same orientation. i, Schematic of PK with regions that interact with TERT and p65 indicated. j, Interactions between motif 3 and the template. End of motif 3B and start of motif 3C are in minor groove of the duplex. k, The eight TER nucleotides that stack inside the catalytic cavity. Cryo-EM densities are shown as transparent meshes. Ideal A-form stacking of 8 nucleotides (white) is shown for comparison. Backbone of the last 3 TER nucleotides in the stacking deviate from ideal A-form conformation.
Extended Data Fig. 4:
Extended Data Fig. 4:. Interactions between TEN–TRAP and telomerase activity assays.
a, Ribbon representation of TERT with its domains colored as indicated. Unmodeled regions of TERT are shown as dashed lines, including the linker between TEN and RBD (aa. 180–215), flexible linkers within RBD (aa. 252–280), and TRAP (aa. 664–686). b, Hydrophobic interactions between the distal region of TRAP and the C-terminal helix of TEN domain, which is further stabilized by Q168 via two hydrogen bonds. c, The extended β sheet across TEN and TRAP. V791Y (V731 in Tetrahymena) mutation in hTERT that disrupts telomere length maintenance and cell immortalization is located at the interface. d, e, In vitro reconstituted telomerase activity assays with TERT mutations on the TEN–TRAP interface. The top panels are SDS-PAGE gels showing the expression level of 35S-Met incorporated TERT mutants. RC, recovery control. Quantitation of activity and RAP for each mutant are shown in bar graphs below. f, g, Quantitation of activity and RAP for gel shown in Fig. 1j and 3g. The data represent the mean ± s.d. from 3 independent experiments.
Extended Data Fig. 5:
Extended Data Fig. 5:. Comparison between TERT from Tetrahymena (TtTERT), human (hTERT), and the TERT-like protein from Tribolium castaneum (TcTERT-like).
a, Sequence alignment of TtTERT and hTERT. Secondary structures and conserved motifs of TtTERT are shown on top, with unmodeled regions shown as dashed lines. The alignments of TEN, RBD, RT, CTE domains and TRAP motif were conducted separately with NIH COBALT and then merged together. The alignment of CP2/TFLY region was adjusted manually according to the previously reported alignment. b, Structural comparison of the TERT-ring of TtTERT (color) and TcTERT-like protein (gray, PDB ID: 3KYL). TcTERT-like protein lacks TEN, TRAP, and TER, and was crystallized with an artificial template–DNA duplex. c, d, Ribbon diagrams of template–DNA duplexes and surrounding structural elements of TtTERT (c) and TcTERT-like protein (d). The palm, fingers, primer grip, thumb helix, thumb loop, motif 3 and T are structurally conserved between TtTERT and TcTERT-like protein. The “bridge loop” of TcTERT-like protein is in a similar position as the one in TtTERT, however the tip residues (S82 and F83) have no contact with the template–DNA duplex. CP2, which participates in template 5′ boundary definition and template nucleotides guidance in TtTERT, appears to be absent in TcTERT-like protein.
Extended Data Fig. 6:
Extended Data Fig. 6:. Details of p50-OB–TERT (a-d) and Teb1C–sstDNA (e-h) interactions.
a, Rainbow colored ribbon diagram of p50-OB with secondary structure elements labeled. b, Comparison of p50-OB (red) and human TPP1-OB (gray, PDB ID: 2I46) structures. c, TEN loop (aa. 121–126) passes through a hydrophobic cleft of p50-OB. This loop is disordered loop in the TEN domain crystal structure.d, Structure based sequence alignment of p50-OB and human TPP1-OB. The secondary structure elements of p50-OB (red) and TPP1-OB (gray) are shown above and below the sequence alignment, respectively. Residues located at the interface between p50-OB and TERT are highlighted in yellow. The NOB and TEL patch residues on human TPP1-OB are indicated and colored in yellow as well. The phosphorylation site S111 of TPP1-OB is colored in green. Scaffold residues of Lα2-β4 shown in Fig. 2a (lower) are colored in blue. e, Path of sstDNA from active site to Teb1C. Low-pass filtered cryo-EM density of sstDNA (transparent surface) is superimposed with the unfiltered DNA density (green) to better show its flexible region from T20 to G22. Cryo-EM densities corresponding to TERT domains, TER and Teb1C are colored as in Fig. 1d. f, Sequence of the sstDNA used for the cryo-EM sample preparation with the template and Teb1C interacting regions indicated. Nucleotides from G1 to G16 are invisible in the cryo-EM map. g, Interactions between sstDNA nucleotides and Teb1C as indicated in e. Intermolecular hydrogen bonds and stacking interactions are shown as dashed yellow lines and black arrows, respectively. h, Specific interactions between Teb1C residues K660, E667 and sstDNA nucleotide G19 shown together with their cryo-EM densities. Hydrogen bonds and their lengths are indicated.
Extended Data Fig. 7:
Extended Data Fig. 7:. Cryo-EM reconstructions of telomerase with different sstDNA bound.
a, List of sstDNA primers used for cryo-EM sample preparation and their sequences. DNA/LNA nucleotides that pair with the template are underlined. b, Resolution of reconstructions determined by gold-standard FSC at the 0.143 criterion. c, d, Cryo-EM data processing workflow of telomerase T4D4 and T5D5, and evaluations of the final reconstructions. Initial particle screening processes are analogous to those described in the data processing workflow of telomerase T3D2 and omitted for brevity. Focused 3D classifications were performed to separate DNA-free and DNA-bound particles. Short duplexes were observed in both of T4D4 and T5D5 reconstructions. We note that for telomerase T5D5, there is a subset of particles with a longer duplex, which we attribute to the greater stability conferred on the duplex by LNA nucleotides at the thermodynamically most stable duplex (dGGGGT·rACCCC) formed in the previous step.
Extended Data Fig. 8:
Extended Data Fig. 8:. Template–DNA duplexes in telomerase structures at different steps of telomeric DNA synthesis.
Top, sequences of sstDNA primers. TL/GL denotes LNA nucleotide. DNA/LNA nucleotides pairing with the template are underlined. Middle, ribbon diagrams of the duplex, template adjacent nucleotides, bridge loop, thumb helix (TH) and thumb loop (TL) superimposed with cryo-EM densities (transparent surfaces). Bottom, schematics of the duplexes. The active site (red star), bridge loop residues (R413 and F414), and catalytic cavity (gray shade) in different structures are aligned to show the relative positions of the duplex. TER and DNA nucleotides are color coded as in Fig. 4.
Extended Data Fig. 9:
Extended Data Fig. 9:. Structural details of template boundary determination (TBE, TBEL, TREL, TRE) in telomerase T5D5.
a, Telomerase catalytic cavity in telomerase T5D5 with TER (gray) and DNA (green) shown as ribbon and TERT shown as surface (colored). TBE, TBEL, template, TREL and TRE nucleotides are highlighted as indicated. b-e, Detailed interactions between TERT and TER in regions as indicated in a. Intermolecular hydrogen bonds and stacking interactions are shown as dashed yellow lines and black arrows, respectively. The electrostatic surface of the TRAP–TH channel is shown in d. f, Schematic showing specific interactions between TERT and TREL-TRE as shown in c and e. Nucleotides from A54 to A58 are unmodeled and indicated as dashed orange lines. g, Predicted TRE and TREL conformation when the template is at the +1 position (template nucleotide C48 at the active site). TREL nucleotides C56U57A58 would be fully stretched (~5–6 Å phosphate-to-phosphate distance for each nucleotide) to span the distance from the “neck” of the TRAP–TH channel to the anchored TRE.
Fig. 1:
Fig. 1:. 3.3 Å resolution structure of Tetrahymena telomerase with sstDNA.
a, Domain organization of TERT, p65, p50, and TEB. Regions invisible in the cryo-EM map are colored in gray. b, Representative 2D class average image. c, Schematic of TER secondary structure. Interaction sites with TERT, sstDNA and p65 are indicated. d, Cryo-EM density. e, Molecular model of telomerase. f, TER PK and its interactions with TERT CTE and p65 LaM. Green spheres are positively charged p65 LaM residues on the interface. TERT CTE is shown as electrostatic surface. g, Superposition of ribbon diagram and cryo-EM density of TRAP. Dashed line indicates TRAP flexible linker. h, Structure of TERT, with DNA (green) and TER (magenta) within the catalytic cavity shown as surfaces. i, CTE–TRAP–TEN interface. j, Telomerase activity assays with alanine substitutions of residues shown in i. Asterisks indicate residues interacting with each other as pairs. The number of telomeric repeats synthesized are indicated at left. The top panel shows expression levels of 35S-Met labeled TERT mutants. RC, recovery control. Activity assays were successfully repeated 3 times. For gel source data for all Figures, see Supplementary Fig. 1.
Fig. 2:
Fig. 2:. Structure of p50-OB and interactions with TERT.
a, Comparison of p50-OB (red) and human TPP1-OB (gray, PDB ID: 2I46) structures. Zoomed-in views show Lα2-β4 in p50-OB (left) and TPP1-OB (right). b, Interface between p50-OB (ribbon, with yellow spheres for residues at interface) and TERT (cryo-EM density). c, Sidechain interactions between p50-OB and TRAP–TEN, as in b. d, TPP1-OB docked onto Tetrahymena TERT. Yellow spheres are TEL patch residues. Green sphere is S111.
Fig. 3:
Fig. 3:. Interactions between TERT and template–DNA duplex.
a, Cryo-EM densities of TERT and template–DNA. Red spheres are active site residues (D618,D815,D816). b, c, Ribbon depictions of template–DNA and TERT motifs involved in duplex handling. Template and adjacent nucleotides are red and orange, respectively. Bridge loop R413 and F414 are shown as sticks. The hand (inset in b) shows orientation relative to other polymerases. d, Schematic showing specific interactions between TERT and template–DNA. Template alignment nucleotides are red in white background. Arrows indicate sites of polar interactions. Bold line indicates F414 and T26 stacking interaction. e, f, Sidechain interactions surrounding the template (e) and DNA (f) nucleotide flipping regions. The corresponding human TERT residues are in parentheses. g, Telomerase activity assays with TERT substitutions on CP2, T motif, fingers and bridge loop. n=3 independent experiments. h, Sequence alignment of the bridge loop, with conserved residues in red.
Fig.4.
Fig.4.. Structural details for template boundary determination.
a, Telomerase T3D2 catalytic cavity with TER (gray), DNA (green ribbon), and TERT (colored surface). b, c, Comparison of TER and template–DNA in telomerase T3D2 (b) and T5D5 (c). Red star marks TERT active site. d-g, Detailed TERT–TER interactions in regions indicated with dashed boxes in a. Hydrogen-bonds (dashed yellow lines) and stacking interactions (black lines) are indicated. TRAP–TH channel is shown as electrostatic surface in f. h, Schematic of interactions between TERT and TREL-TRE. i, Telomerase activity assays with TERT substitutions on the interface with TBEL and TREL. Telomerase activity and RAP were determined relative to WT. The data represent the mean ± s.d. from 3 independent experiments.
Fig. 5:
Fig. 5:. A model for telomere repeat synthesis.
At step 0/10, six TREL nucleotides are in the TRAP–TH channel, with 3 stacked above the neck and 3 fully stretched between the neck and TRE. Five template nucleotides beyond the +1 position and 2 TBEL nucleotides are looped out. The template moves from +1 to +6 position during the synthesis of one telomere repeat (steps 0–6), with concomitant stretching of TBEL and looping of TREL. At step 6, the TBEL is fully stretched and all 7 TREL plus one template nucleotide are looped out below the neck of the TRAP–TH channel. Following addition of the last dGTP a series of events leads to template translocation: duplex distortion (7), duplex melting and TRAP opening (8), template re-positioning (9), and DNA re-pairing and TRAP closing (10). TBE and TRE anchor sites, locations of TH, TL, F414, and template position at active site are illustrated. The pawl-and- ratchet cartoons illustrate the movement of TRAP (salmon) and TREL nucleotides (orange) through the TRAP–TH neck. Step 2 corresponds to the 3.3 Å resolution structure T3D2.

References

    1. Blackburn EH & Collins K Telomerase: an RNP enzyme synthesizes DNA. Cold Spring Harb Perspect Biol 3 (2011). - PMC - PubMed
    1. Armanios M & Blackburn EH The telomere syndromes. Nat Rev Genet 13, 693–704 (2012). - PMC - PubMed
    1. Shay JW Role of Telomeres and Telomerase in Aging and Cancer. Cancer Discov 6, 584–593 (2016). - PMC - PubMed
    1. Jiang J et al. Structure of Tetrahymena telomerase reveals previously unknown subunits, functions, and interactions. Science 350, aab4070 (2015). - PMC - PubMed
    1. Jiang J et al. Structure of Telomerase with Telomeric DNA. Cell 173, 1179–1190 e1113 (2018). - PMC - PubMed

Publication types

MeSH terms