. 2021 Jun;594(7863):413-417.
doi: 10.1038/s41586-021-03531-1. Epub 2021 May 12.

Thymic development of gut-microbiota-specific T cells

Affiliations

Thymic development of gut-microbiota-specific T cells

Daniel F Zegarra-Ruiz et al. Nature. 2021 Jun.

Abstract

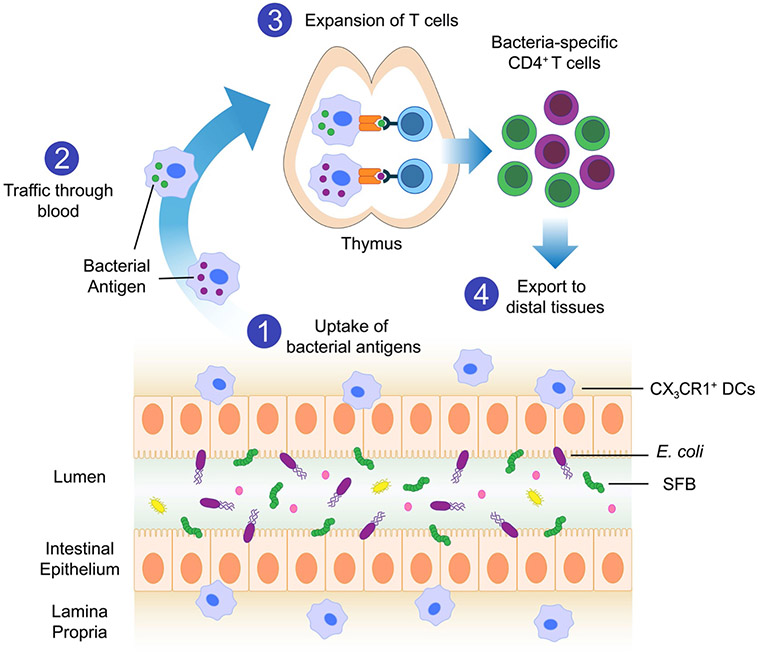
Humans and their microbiota have coevolved a mutually beneficial relationship in which the human host provides a hospitable environment for the microorganisms and the microbiota provides many advantages for the host, including nutritional benefits and protection from pathogen infection1. Maintaining this relationship requires a careful immune balance to contain commensal microorganisms within the lumen while limiting inflammatory anti-commensal responses1,2. Antigen-specific recognition of intestinal microorganisms by T cells has previously been described3,4. Although the local environment shapes the differentiation of effector cells3-5 it is unclear how microbiota-specific T cells are educated in the thymus. Here we show that intestinal colonization in early life leads to the trafficking of microbial antigens from the intestine to the thymus by intestinal dendritic cells, which then induce the expansion of microbiota-specific T cells. Once in the periphery, microbiota-specific T cells have pathogenic potential or can protect against related pathogens. In this way, the developing microbiota shapes and expands the thymic and peripheral T cell repertoire, allowing for enhanced recognition of intestinal microorganisms and pathogens.


Figures

Extended Data Fig. 1 ∣
Extended Data Fig. 1 ∣. Characterization of SFB-tetramer+ CD4+ T cells.
a, Gating strategy used to identify SFB-tetramer+ CD4+ T cells after magnetic enrichment. Live, CD45+ single cells negative for CX3CR1, Ly6G, B220, Ly6C, MHCII and CD8 were further analysed. From the CD3+CD4+ population, SFB-specific cells were identified as double positive for APC- and PE- (Fig. 1) or single positive for APC- or PE-conjugated tetramers specific for SFB peptide QFSGAVPNKTD (all other figures). b, Mice were colonized with SFB at weaning and two weeks later thymic T cells were compared to age-matched control (CTRL) mice. Frequencies and counts of SFB-tetramer+ cells in thymic flow-through after magnetic enrichment (n = 3 per group). c, 7B8 TCR transgenic mice were left uncolonized or SFB-colonized at weaning and two weeks later CD4+ counts in the thymus were compared (control n = 6; SFB n = 7). df, Mice were colonized with SFB at weaning and two weeks later thymic T cells were compared to age-matched control mice. d, Frequencies and counts of SFB-tetramer+ cells in CD8+ (single-positive; SP) and CD4+CD8+ (double-positive; DP) T cells (n = 10 per group). e, Frequencies and counts of no tetramer (NT), 2W1S, H. hepaticus (HH) and human (HU) tetramer+ cells in CD4+ T cells (n = 5 per group). f, Frequencies and counts of CD4+, CD8+ and CD4+CD8+ thymic subsets. gk, Representative flow plots of control and SFB CD4+ T cells for RORγt and FOXP3 (g), CD25 (h), CD44 (i); CD24 and TCRβ (j) and CD69 and TCRβ (k). In fk, n = 15 per group. Each replicate is a biologically independent sample. Data are shown as individual values and mean; P values by two-tailed unpaired t-test (b, c) or two-way ANOVA with Sidak’s post hoc test (df).
Extended Data Fig. 2 ∣
Extended Data Fig. 2 ∣. Thymic expansion of bacteria-specific T cells after colonization with commensal microorganisms at weaning.
ac, Thymic SFB-tetramer+ cells from young mice were analysed by flow cytometry (n = 15). a, CD24 and TCRβ. b, CD44. c, CD69 and TCRβ. d, Mice were colonized with SFB at weaning for two weeks and were injected intravenously with anti-CD45 before euthanasia. Flow cytometry of CD45 in thymic SFB-tetramer+ cells and spleen (n = 5). e, RAG2-GFP mice were colonized with SFB at weaning and two weeks later thymi were collected. Flow cytometry of thymic CD4+ cells (n = 7). f, g, Thymic SFB-non-specific and SFB-specific CD4+ T cells from young mice two weeks after colonization were analysed by RNA-seq. f, Principal component analysis of SFB-non-specific and SFB-specific CD4+ T cells (circled) compared to thymocytes at different developmental stages (GSE148973). g, Heat map showing row-standardized z-scores of mRNA expression for genes in enriched KEGG pathways (P < 0.05). In f, g, n = 5 (SFB-non-specific T cells); n = 3 (SFB-specific T cells). Each SFB-specific T cell replicate is a pool of 10 thymi. hj, Mice were colonized with SFB at weaning and were compared four weeks later to age-matched control mice. h, Flow cytometry and counts of SFB-tetramer+ cells in the MLNs (n = 5 (CTRL; n = 15 (SFB)), spleen (SPL; n = 5 per group), ileum (n = 5 (CTRL); n = 10 (SFB)) and colon (n = 5 per group). i, j, Flow cytometry (i) and counts (j) of thymic SFB-tetramer+ cells (n = 5 (CTRL); n = 15 (SFB)). k, RAG2-GFP mice were colonized with SFB at weaning and four weeks later thymi were collected. Flow cytometry of thymic CD4+ cells (n = 7). l, m, SPF and germ-free mice were treated with antibiotics (ABX) at weaning and compared two weeks later to age-matched control mice. Counts of total thymocytes, CD4+, CD8+ and thymic Treg cells in SPF mice (l; n = 15 (CTRL); n = 9 (ABX)) and germ-free mice (m; n = 3 (CTRL); n = 4 (ABX)). Each replicate is a biologically independent sample. Data are shown as individual values and mean; P values by two-tailed unpaired t-test (j, l, m) or two-way ANOVA with Sidak’s post hoc test (h).
Extended Data Fig. 3 ∣
Extended Data Fig. 3 ∣. Bacterial DNA is found in the thymus after early-life colonization.
a, b, hj, Mice were colonized with SFB or E. coli at weaning (young) or at 12 weeks of age (adult) and one week later were compared to age-matched control mice. a, b, SFB-specific qPCR in faecal pellets (FP) (a; young: CTRL, SFB n = 8; adult: CTRL, SFB n = 6); and MLNs (b; young: CTRL, SFB n = 9; adult: CTRL, SFB n = 7). hj, E. coli-specific qPCR in the thymus (h; young: CTRL n = 10, EC n = 15; adult: CTRL, EC n = 15), MLNs (i; young: CTRL, EC n = 8; adult: CTRL, EC n = 7) and faecal pellets (j; young: CTRL, EC n = 8; adult: CTRL, EC n = 10). Mice were colonized with SFB at weaning and compared one week later to age-matched control mice. c, e, SFB-specific qPCR (c; n = 6 per group) and 16S qPCR (e) in the thymus, MLNs, liver, spleen, heart and lungs (in e, thymus, MLNs: CTRL, SFB n = 12; liver, SPL, heart, lungs: CTRL, SFB n = 6). d, g, Mice were colonized with SFB at weaning and analysed up to three weeks later. SFB-specific PCR (d) and 16S qPCR (g) in the thymus, MLNs and faecal pellets (n = 5 per group). f, Mice were colonized with SFB at 12 weeks of age and compared one week later to age-matched control mice. 16S qPCR in thymus and MLNs (thymus: CTRL n = 16, SFB n = 11; MLNs CTRL, SFB n = 7). k, Mice were euthanized at 4 weeks of age, tissues were collected, DNA was isolated and 16S rDNA sequencing was performed. Bacterial phyla and class relative abundance in the thymus, MLNs and caecum (n = 5 per group; thymus and MLNs were pooled). ln, Mice were treated with antibiotics at weaning and compared one week later to age-matched control mice. 16S qPCR in the thymus (l; n = 7 (CTRL), n = 8 (ABX)); MLNs (m; n = 16 (CTRL), n = 9 (ABX)) and faecal pellets (n; n = 10 per group). Each replicate is a biologically independent sample. Data are shown as mean ± s.e.m. (d, g) or as individual values and mean; P values by two-tailed unpaired t-test (ln) or two-way ANOVA with Tukey’s (a, b, f, hj), Sidak’s (c, e) or Fisher’s LSD (e) post hoc test.
Extended Data Fig. 4 ∣
Extended Data Fig. 4 ∣. CX3CR1+ DCs are enriched in the thymus after colonization with commensal microorganisms in young mice.
ac, g, Thymic cell populations were analysed at weaning (W3), one (W4) and two (W5) weeks after weaning, and at 12 weeks of age (W12). Frequencies and counts of CD4+, CD8+ and CD4+CD8+ subsets (a); Treg cells (b) (in a, b, W3 n = 5; W4 n = 11; W5 n = 15; W12 n = 8); CD11c+MHCII+ DCs (c); and CD103+ and CX3CR1+ DC subsets (g) (in c, g, n = 10 (W3); n = 15 (W4, W5, W12)). d, m, p, q, Mice were treated with antibiotics at weaning and thymi were compared two weeks later to age-matched control mice. d, m, Frequencies and counts of CD11c+MHCII+ DCs (d) and CD103+ and CX3CR1+ DC subsets (m) (n = 23 per group). p, q, Frequencies of plasmacytoid DCs (pDCs) (p) and B cells (q) (n = 15 per group). e, f, il, n, o, Mice were colonized with SFB or E. coli at weaning (young) or at 12 weeks of age (adult) and thymi were compared two weeks later to age-matched control mice. e, f, Flow cytometry (e) and counts (f) of CD11c+MHCII+ DCs. i, Representative flow plot of CX3CR1+ DCs. j, Frequencies and counts of CD103+ DCs in the thymus (in e, f, i, j, young: CTRL n = 15; SFB n = 20; EC n = 12. Adult: CTRL n = 20; SFB n = 20; EC n = 16). k, l, Frequencies of CD11c+MHCII+ DCs (k) and CX3CR1+ DC subsets (l) in the MLNs (young: CTRL n = 12; SFB n = 15; EC n = 10. Adult: CTRL n = 8; SFB n = 12; EC n = 8). n, o, Frequencies of pDCs (n) and B cells (o) in the thymus (n = 12 per group). h, Mice were colonized with SFB at weaning for two weeks and were injected intravenously with anti-CD45 before euthanasia. Flow cytometry of CD45 in thymic CX3CR1+ DCs and spleen (n = 5). Each replicate is a biologically independent sample. Data are shown as individual values and mean; P values by two-tailed unpaired t-test (d, p, q), one-way ANOVA with Tukey’s post hoc test (b, c) or two-way ANOVA with Tukey’s (a, f, g, jl, n, o) or Sidak’s (m) post hoc test.
Extended Data Fig. 5 ∣
Extended Data Fig. 5 ∣. MHCII expression on CX3CR1+ cells is required for the thymic expansion of bacteria-specific T cells.
ag, Wild-type and CX3-DTR mice were colonized with SFB or E. coli at weaning or left untreated and tissues were compared one week (qPCR) or two weeks (flow cytometry analysis) later. a, Flow cytometry of thymic SFB-tetramer+ cells (CTRL: n = 5; SFB: WT n = 6; CX3-DTR n = 8). b, c, 16S qPCR in the thymus (b; n = 8 (WT); n = 9 (CX3-DTR)); and MLNs (c; n = 13 (WT); n = 12 (CX3-DTR)). d, e, SFB-specific qPCR in the thymus (d; n = 5 per group) and faecal pellets (e; n = 10 (WT); n = 5 (CX3-DTR)). f, g, E. coli-specific qPCR in the thymus (f; WT n = 7; CX3-DTR n = 12) and faecal pellets (g; n = 10). h, Diphtheria-toxin-treated littermate wild-type mice and mice depleted of CD103+ DCs (CD103-DTR CD11c-Cre) were analysed two weeks after weaning. Flow cytometry of CD103+ and CX3CR1+ DC subsets in colon lamina propria (n = 5). i, j, Diphtheria-toxin-treated littermate wild-type, CX3-DTR CD11c-Cre and CD103-DTR CD11c-Cre mice were colonized with E. coli at weaning and thymi were compared one week later. i, E. coli-specific qPCR (n = 8 (WT); n = 10 (CX3-DTR); n = 8 (CD103-DTR)). j, 16S qPCR (n = 24 (WT); n = 10 (CX3-DTR); n = 8 (CD103-DTR)). km, 4-OHT-treated MHCIIfl/+ (WT) and MHCIIfl/− (KO) CX3-Cre mice were colonized with SFB at weaning and thymi were compared two weeks later. k, Frequencies and counts of SFB-tetramer+ cells (n = 10 per group). l, SFB-specific qPCR (n = 5 per group). m, Frequencies of CD103+ and CX3CR1+ DC subsets (n = 10 per group). Each replicate is a biologically independent sample. Data are shown as individual values and mean P values by two-tailed unpaired t-test (bg, k, l) or one-way ANOVA with Tukey’s (i, j) or Sidak’s (m) post hoc test.
Extended Data Fig. 6 ∣
Extended Data Fig. 6 ∣. Intestinal CX3CR1+ DCs migrate to the thymus.
a, Thymic DCs were analysed at two weeks after weaning for XCR1 and SIRPα. Flow cytometry of total DCs, CX3CR1+ DCs, CD103+ DCs and pDCs (n = 5). bf, Caeca from KikGR33 transgenic mice were exposed to 405-nm-wavelength light or left untreated at 5 (young) or 14 (adult) weeks of age and two days later the thymus, MLNs and spleen were collected. b, Flow cytometry of RFP+MHCII+ cells in KikGR33 mice without light exposure (n = 5). c, Frequencies and counts of RFP+MHCII+ cells in young mice. d, e, Flow cytometry (d) and counts (e) of RFP+MHCII+ cells in adult mice. f, Flow cytometry of RFP+MHCII+ cells subsets in young and adult thymi. In cf, n = 5 (young); n = 9 (adult). gi, Mice were analysed at weaning (young) or at 12 weeks of age (adult) and thymus chemokine gene expression or colon lamina propria DC populations were analysed. g, Relative expression of chemokines in the thymus (n = 5 (young); n = 15 (adult)). h, CCR5+ cell frequencies of CX3CR1+ DCs in the colon (n = 10 per group). Wild-type and CX3CR1GFP/GFP (KO) mice were colonized with SFB at weaning and treated with TAK-779 or anti-CCL2 antibody and thymi were compared one week later. i, SFB-specific qPCR (n = 17 (WT); n = 13 (anti-CCR5 + anti-CCR2); n = 5 (WT anti-CCR2); n = 10 (KO); n = 5 (KO anti-CCR5 + anti-CCR2)). Each replicate is a biologically independent sample. Data are shown as individual values and mean; P values by two-tailed unpaired t-test (g, h) or one-way ANOVA with Fisher’s LSD post hoc test (i).
Extended Data Fig. 7 ∣
Extended Data Fig. 7 ∣. Bacteria-specific T cells from the thymus of young mice are functional in distal tissues.
Wild-type donor mice were colonized with SFB or E. coli at weaning and two weeks later CD4+ T cells from the thymus were sorted and transferred to SFB- or E. coli-colonized Rag2−/− recipient mice. Recipient mice were followed for four weeks and disease severity was compared to Rag2−/− mice receiving age-matched control donor thymocytes. af, SFB (n = 8 (CTRL); n = 13 (SFB)). a, Colon length. b, Immune infiltration in colon lamina propria. c, d, Flow cytometry (c) and counts (d) of TH17 cells. e, Representative flow plot of SFB-tetramer+ cells. f, Flow cytometry of RORγt and T-bet expression in SFB-tetramer+ cells. gi, E. coli (n = 8 (CTRL); n = 15 (EC)). g, Colon length. h, Immune infiltration in colon lamina propria. i, Representative flow plot of TH1 cells. Each replicate is a biologically independent sample. Data are shown as individual values and mean; P values by two-tailed unpaired t-test (a, b, d, g, h).
Extended Data Fig. 8 ∣
Extended Data Fig. 8 ∣. Bacteria-specific T cells from the thymus of adult mice do not increase pathology in distal tissues.
Wild-type donor mice were colonized with SFB or E. coli at 12 weeks of age and two weeks later CD4+ T cells from the thymus were sorted and transferred to SFB- or E. coli-colonized Rag2−/− recipient mice. Recipient mice were followed for four weeks and disease severity was compared to Rag2−/− mice receiving age-matched control donor thymocytes. ah, SFB. a, Relative weight change after transfer (n = 5 (CTRL); n = 7 (SFB)). b, Colon length. c, d, Representative H&E (c) and colitis score (d). e, Immune infiltration in colon lamina propria. f, g, Frequencies and counts of TH17 cells (f) and SFB-tetramer+ cells (g). h, Flow cytometry of RORγt and T-bet expression in SFB-tetramer+ cells. In bh, n = 4 (CTRL); n = 7 (SFB). in, E. coli (n = 7 (CTRL); n = 9 (EC)). i, Relative weight change after transfer. j, Colon length. k, l, Representative H&E (k) and colitis score (l). m, Immune infiltration in colon lamina propria. n, Frequencies and counts of TH1 cells. Each replicate is a biologically independent sample. Data are shown as mean ± s.e.m., with P values by two-way ANOVA with Fisher’s LSD post hoc test (a, i), or are shown as individual values and mean, with P values by two-tailed unpaired t-test (b, dg, j, ln). Scale bars, 100 μm (c, k).
Extended Data Fig. 9 ∣
Extended Data Fig. 9 ∣. Requirement for antigen presentation by CX3CR1+ cells for thymic T cell pathogenicity in distal tissues.
ad, Diphtheria-toxin-treated littermate SPF wild-type and CX3-DTR donor mice were colonized with SFB at weaning and two weeks later CD4+ T cells from the thymus were sorted and transferred to SFB-colonized Rag2−/− recipient mice. Recipient mice were followed for four weeks and disease severity was assessed. a, Colon length (n = 12 (WT); n = 13 (CX3-DTR). b, Immune infiltration in colon lamina propria. c, d, Flow cytometry (c) and counts (d) of SFB-tetramer+ cells. In bd, n = 8 per group. ek, 4-OHT-treated MHCIIfl/+ (WT) and MHCIIfl/− (KO) CX3-Cre mice were colonized with SFB at weaning and two weeks later CD4+ T cells from the thymus were sorted and transferred to SFB-colonized Rag2−/− recipient mice. Recipient mice were followed for four weeks and disease severity was assessed. e, Relative weight change after transfer. f, Colon length. g, h. Representative H&E (g) and colitis score (h). i, Immune infiltration in colon lamina propria. j, k, Flow cytometry (j) and counts (k) of SFB-tetramer+ cells. In ek, n = 8 (WT); n = 10 (KO). lq, SPF wild-type donor mice were treated with antibiotics at weaning and two weeks later CD4+ T cells from the thymus were sorted and transferred to untreated Rag2−/− recipient mice. Recipient mice were followed for eight weeks and disease severity was compared to Rag2−/− mice receiving age-matched control donor thymocytes. l, Relative weight change after transfer. m, Colon length. n, o, Representative H&E (n) and colitis score (o). p, Immune infiltration in colon lamina propria. q, Frequencies and counts of TH1 cells. In lq, n = 7 (CTRL); n = 9 (ABX). r, Wild-type mice were infected at 5 weeks of age with S. Typhimurium. MLNs were collected and cells restimulated with S. Typhimurium or E. coli. IFN-γ levels in culture supernatants (n = 7 (ST); n = 5 (EC)). Each replicate is a biologically independent sample. Data are shown as mean ± s.e.m., with P values by two-way ANOVA with Fisher’s LSD post hoc test (e, l), or are shown as individual values and mean, with P values by two-tailed unpaired t-test (a, b, d, f, h, i, k, m, or). Scale bars, 100 μm (g, n).
Extended Data Fig. 10 ∣
Extended Data Fig. 10 ∣. Proposed model for early-life thymic expansion of microbiota-specific T cells.
At weaning we propose that CX3CR1+ DCs take up intestinal commensal microorganisms (1) and migrate to the thymus (2), where they present bacterial antigens to CD4+ T cells. This induces the expansion of bacteria-specific CD4+T cells (3) that are later exported to peripheral organs (4).
Fig. 1 ∣
Fig. 1 ∣. Commensal colonization leads to an expansion of bacteria-specific T cells in the thymus.
ad, Mice were colonized with SFB at weaning (young) or at 12 weeks of age (adult) and two weeks later were compared to age-matched control mice. a, b, Flow plots (a) and counts (b) of thymic SFB-tetramer+ cells. c, d, Representative flow plots of RORγt and FOXP3 (c) and CD25 (d) in thymic SFB-tetramer+ cells. In ad, n = 12 (control young, control adult, SFB adult); n = 15 (SFB young). e, RAG2-GFP mice (n = 7) were colonized with SFB at weaning. Representative flow plot of CD73 and RAG2 in thymic SFB-tetramer+ cells two weeks after colonization. f, Frequencies and counts of SFB-tetramer+ cells in the MLNs and ileum (control: n = 6 (MLNs young, ileum young), n = 5 (MLNs adult, ileum adult); SFB: n = 6 (MLNs young, ileum young), n = 10 (MLNs adult), n = 5 (ileum adult)). g, Young and adult mice were colonized with SFB and one week later were compared to age-matched control mice. SFB-specific qPCR in the thymus (control: n = 10 (young), n = 11 (adult); SFB: n = 10 (young), n = 11 (adult)). Each replicate is a biologically independent sample. Data are shown as individual values and mean; P values by two-way ANOVA with Tukey’s post hoc test (b, f, g).
Fig. 2 ∣
Fig. 2 ∣. Enrichment of CX3CR1+ DCs in the thymus after colonization with commensal microorganisms.
a, Young and adult mice were colonized with SFB or E. coli (EC) and compared two weeks later to age-matched control mice. Frequencies and counts of thymic CX3CR1+ DCs (n = 15 (control young), n = 20 (control adult, SFB young, SFB adult), n = 12 (EC young), n = 16 (EC adult)). b, Wild-type (WT) mice and mice depleted of CX3CR1+ cells (CX3-DTR) were colonized with SFB at weaning and compared two weeks later. Frequencies and counts of thymic SFB-tetramer+ cells (n = 5 (control), n = 6 (SFB WT), n = 8 (SFB CX3-DTR)). c, d, Caeca from young (n = 5) and adult (n = 9) KikGR33 transgenic mice were exposed to 405-nm-wavelength light and two days later the thymus, MLNs and spleen were collected. c, Representative flow plot of RFP+MHCII+ cells in young mice. d, Composition of RFP+MHCII+ cells. Each replicate is a biologically independent sample. Data are shown as individual values and mean; P values by two-way ANOVA (a) or one-way ANOVA (b) with Tukey’s post hoc test.
Fig. 3 ∣
Fig. 3 ∣. Thymic microbiota-specific T cells are functional in distal tissues.
ah, Mice were colonized with SFB or E. coli at weaning and two weeks later thymic CD4+ T cells were transferred to SFB- or E. coli-colonized Rag2−/− mice. Recipient mice were followed for four weeks and disease severity was compared to Rag2−/− mice that received age-matched control thymocytes. a, e, Relative weight change in SFB (a) or E. coli (e) recipient mice. b, c, f, g, Representative haematoxylin and eosin (H&E) staining (b, f) and colitis score (c, g) in SFB (b, c) or E. coli (f, g) recipient mice. d, h, Frequencies and counts of colonic SFB-tetramer+ cells (d) and TH1 cells (h). In ad, n = 8 (control), n = 13 (SFB); in eh, n = 8 (control), n = 15 (EC). ik, Similarly, thymocytes from SFB-colonized diphtheria-toxin-treated littermate wild-type and CX3-DTR mice were transferred to SFB-colonized Rag2−/− mice. i, Relative weight change (n = 13 (WT); n = 14 (CX3-DTR)). j, k, Representative H&E staining (j) and colitis score (k) (n = 6 (WT); n = 10 (CX3-DTR)). l, Mice were colonized with E. coli (n = 11) at weaning and two weeks later were infected with S. Typhimurium (ST) and survival was compared to infected control mice (n = 11). A subset of mice colonized with E. coli received anti-CD4 antibody (n = 10) or isotype control (IgG) (n = 8) injections before and during infection with S. Typhimurium. Kaplan–Meier plot of survival. Each replicate is a biologically independent sample. Data are shown as mean ± s.e.m with P values by two-way ANOVA with Fisher’s LSD post hoc test (a, e, i) or are shown as individual values and mean, with P values by two-tailed unpaired t-test (c, d, g, h, k) or log-rank (Mantel–Cox) test (l). Scale bars, 100 μm (b, f, j).

Comment in

Similar articles

Cited by

References

    1. Hooper LV, Littman DR & Macpherson AJ Interactions between the microbiota and the immune system. Science 336, 1268–1273 (2012). - PMC - PubMed
    1. Zegarra-Ruiz DF et al. A diet-sensitive commensal Lactobacillus strain mediates TLR7-dependent systemic autoimmunity. Cell Host Microbe 25, 113–127 (2019). - PMC - PubMed
    1. Xu M et al. c-MAF-dependent regulatory T cells mediate immunological tolerance to a gut pathobiont. Nature 554, 373–377 (2018). - PMC - PubMed
    1. Yang Y et al. Focused specificity of intestinal TH17 cells towards commensal bacterial antigens. Nature 510, 152–156 (2014). - PMC - PubMed
    1. Lathrop SK et al. Peripheral education of the immune system by colonic commensal microbiota. Nature 478, 250–254 (2011). - PMC - PubMed

Publication types

MeSH terms