. 2021 May;593(7860):586-590.
doi: 10.1038/s41586-021-03539-7. Epub 2021 May 12.

DHODH-mediated ferroptosis defence is a targetable vulnerability in cancer

Affiliations

DHODH-mediated ferroptosis defence is a targetable vulnerability in cancer

Chao Mao et al. Nature. 2021 May.

Erratum in

Abstract

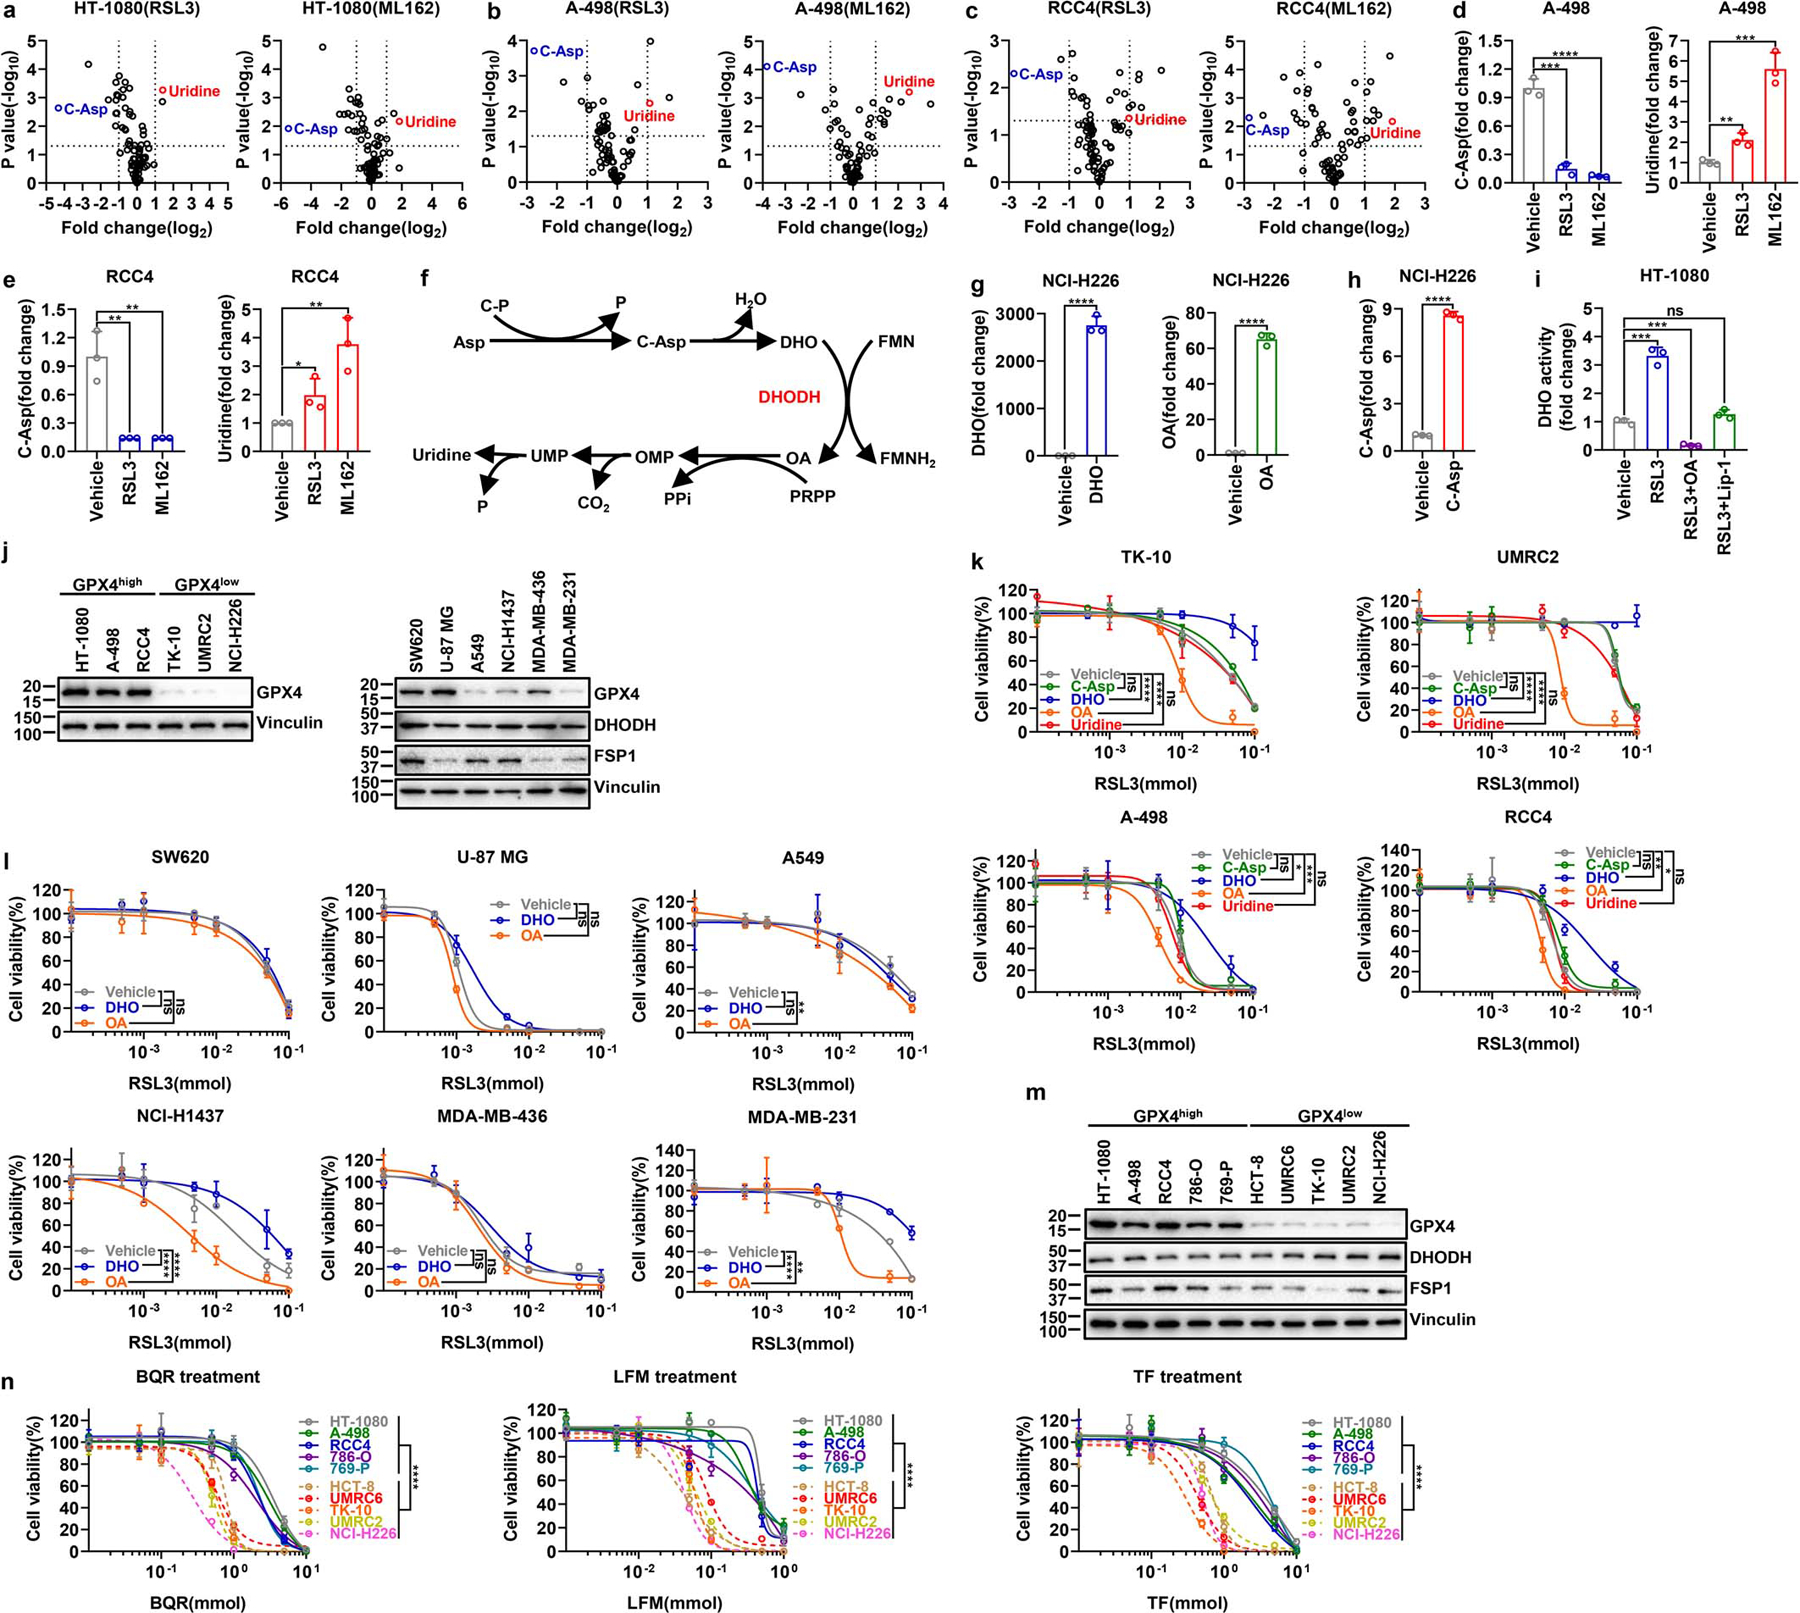
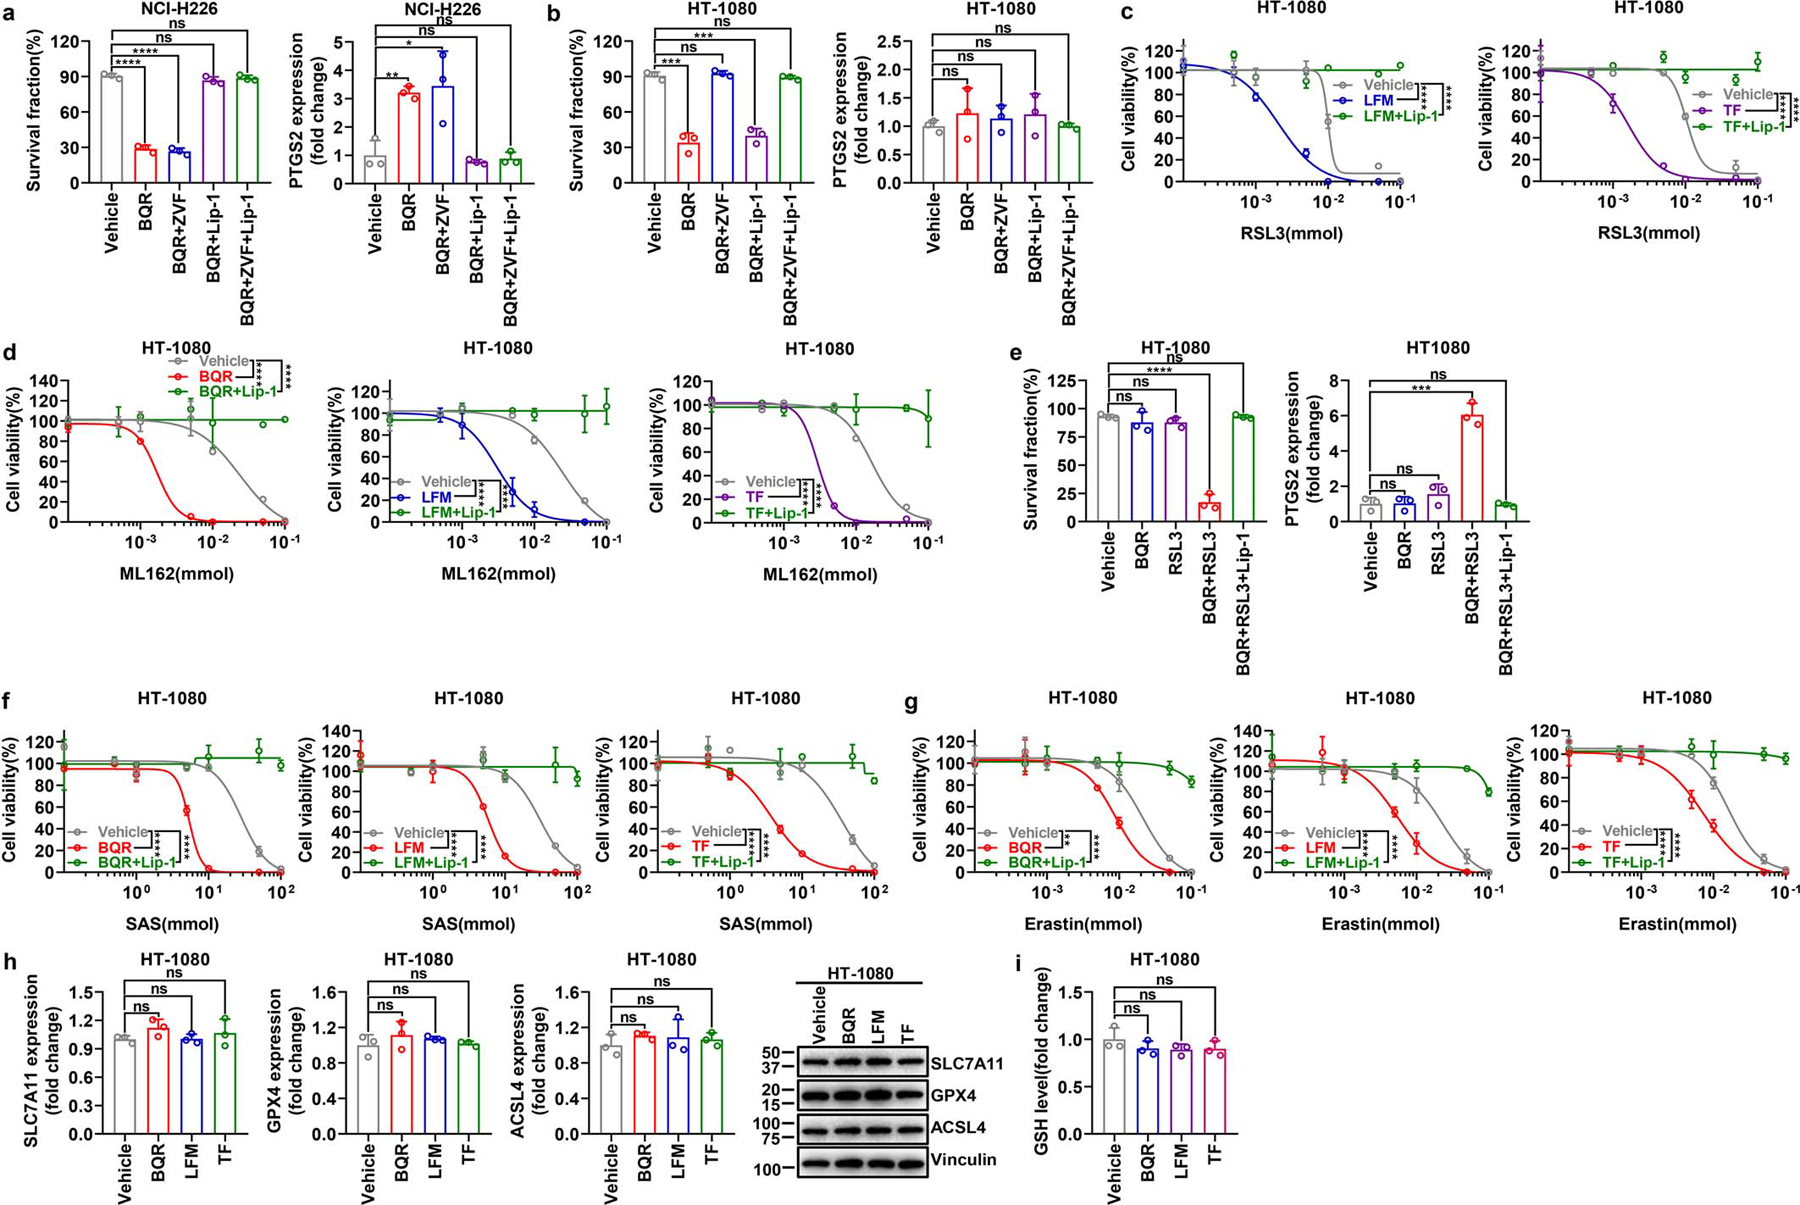
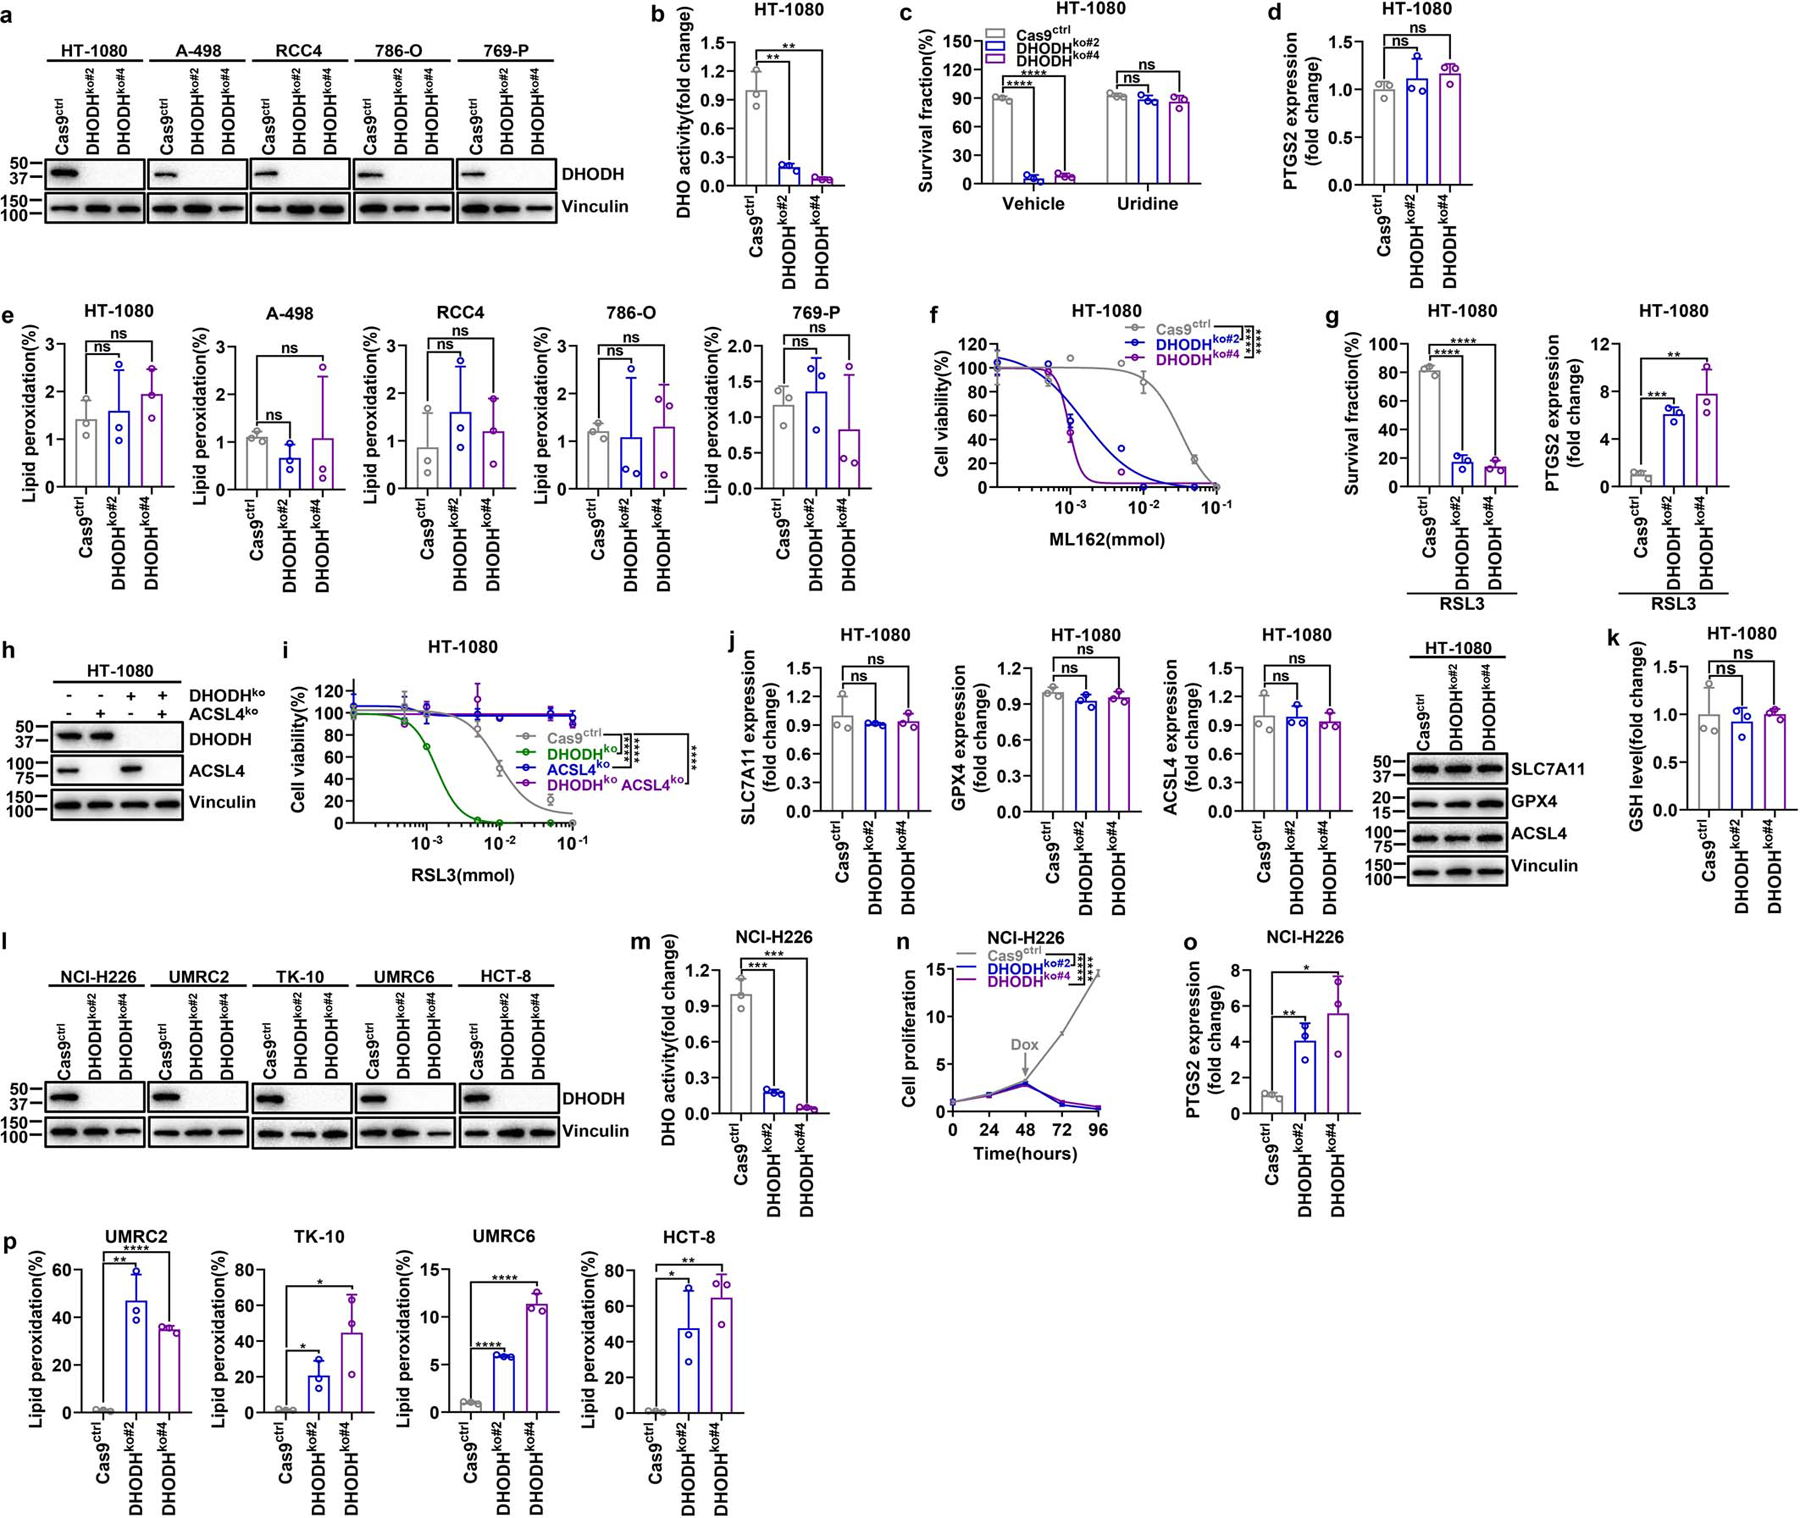
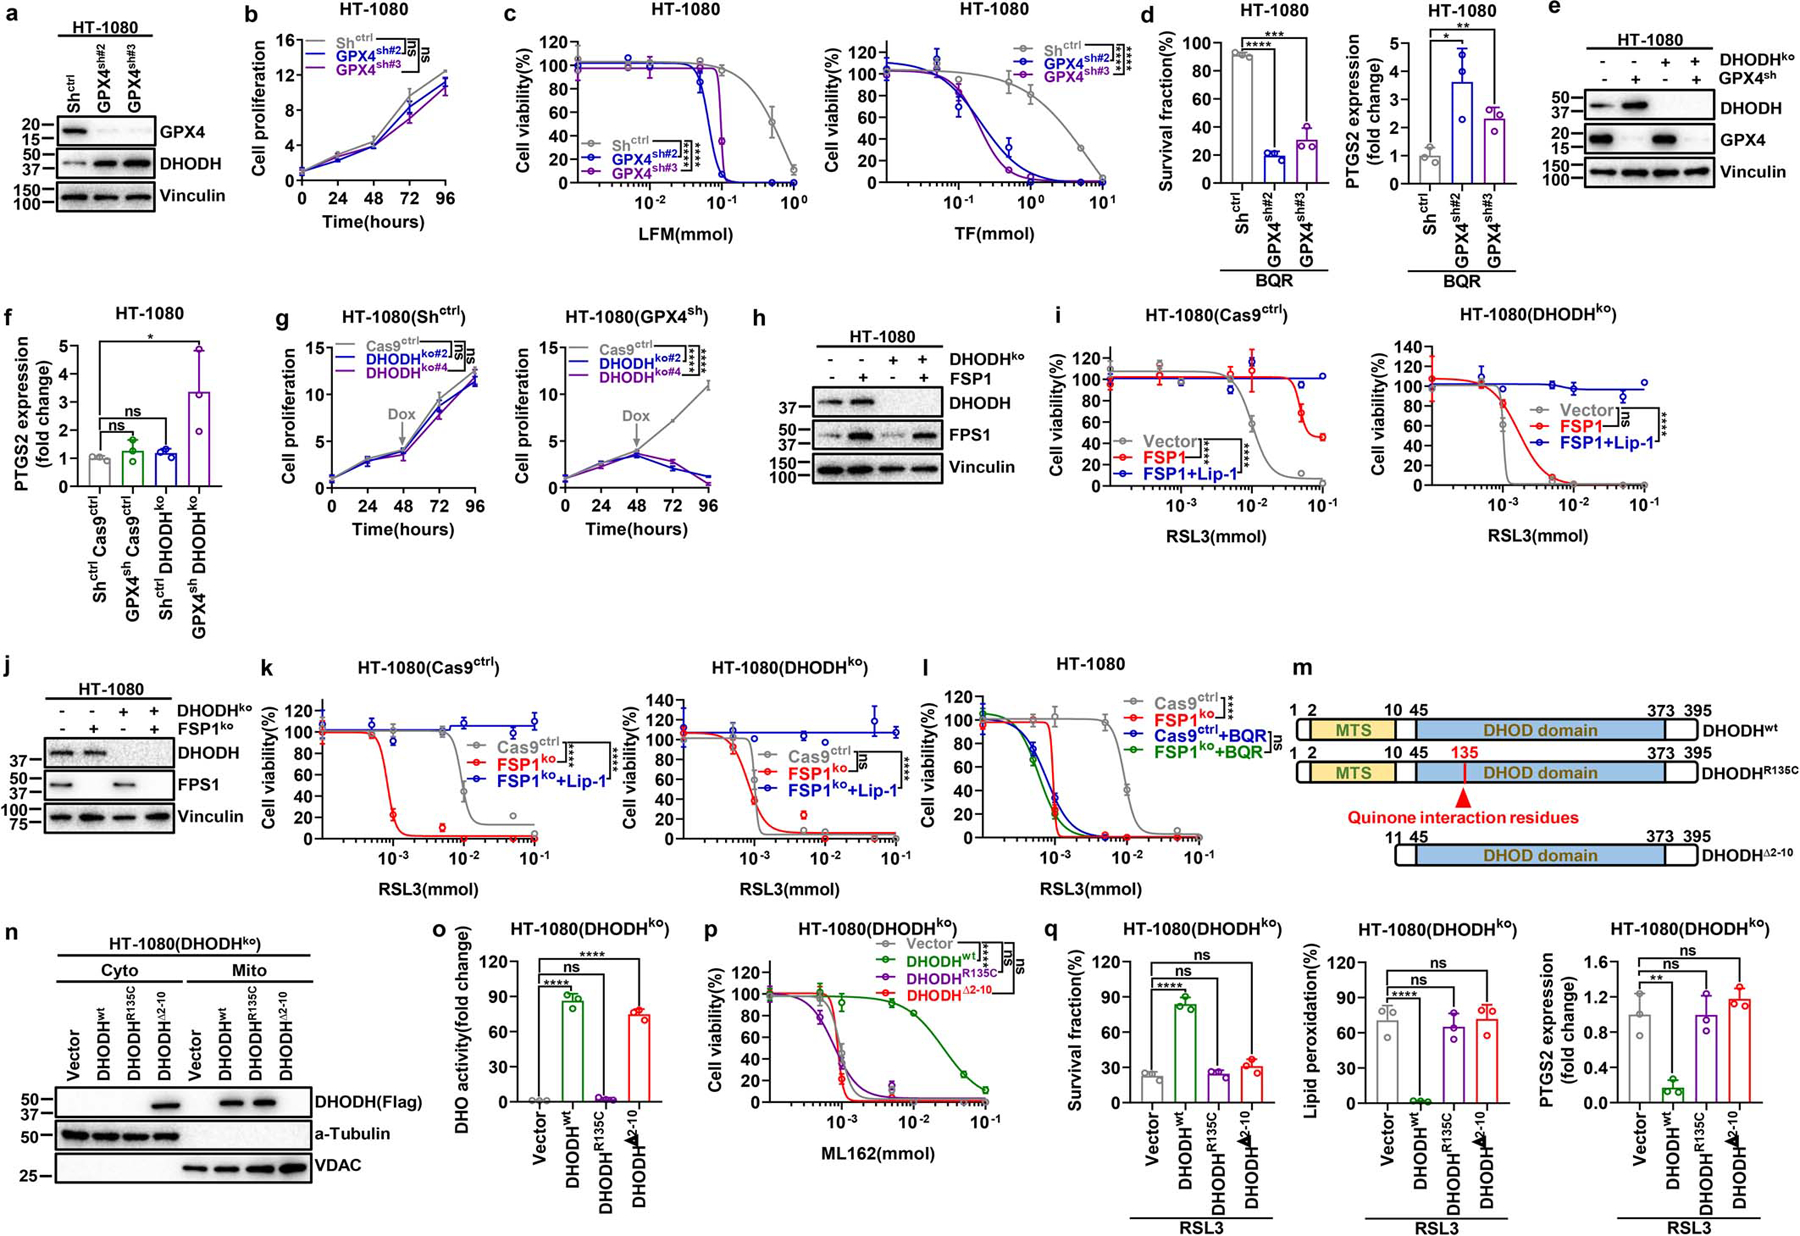
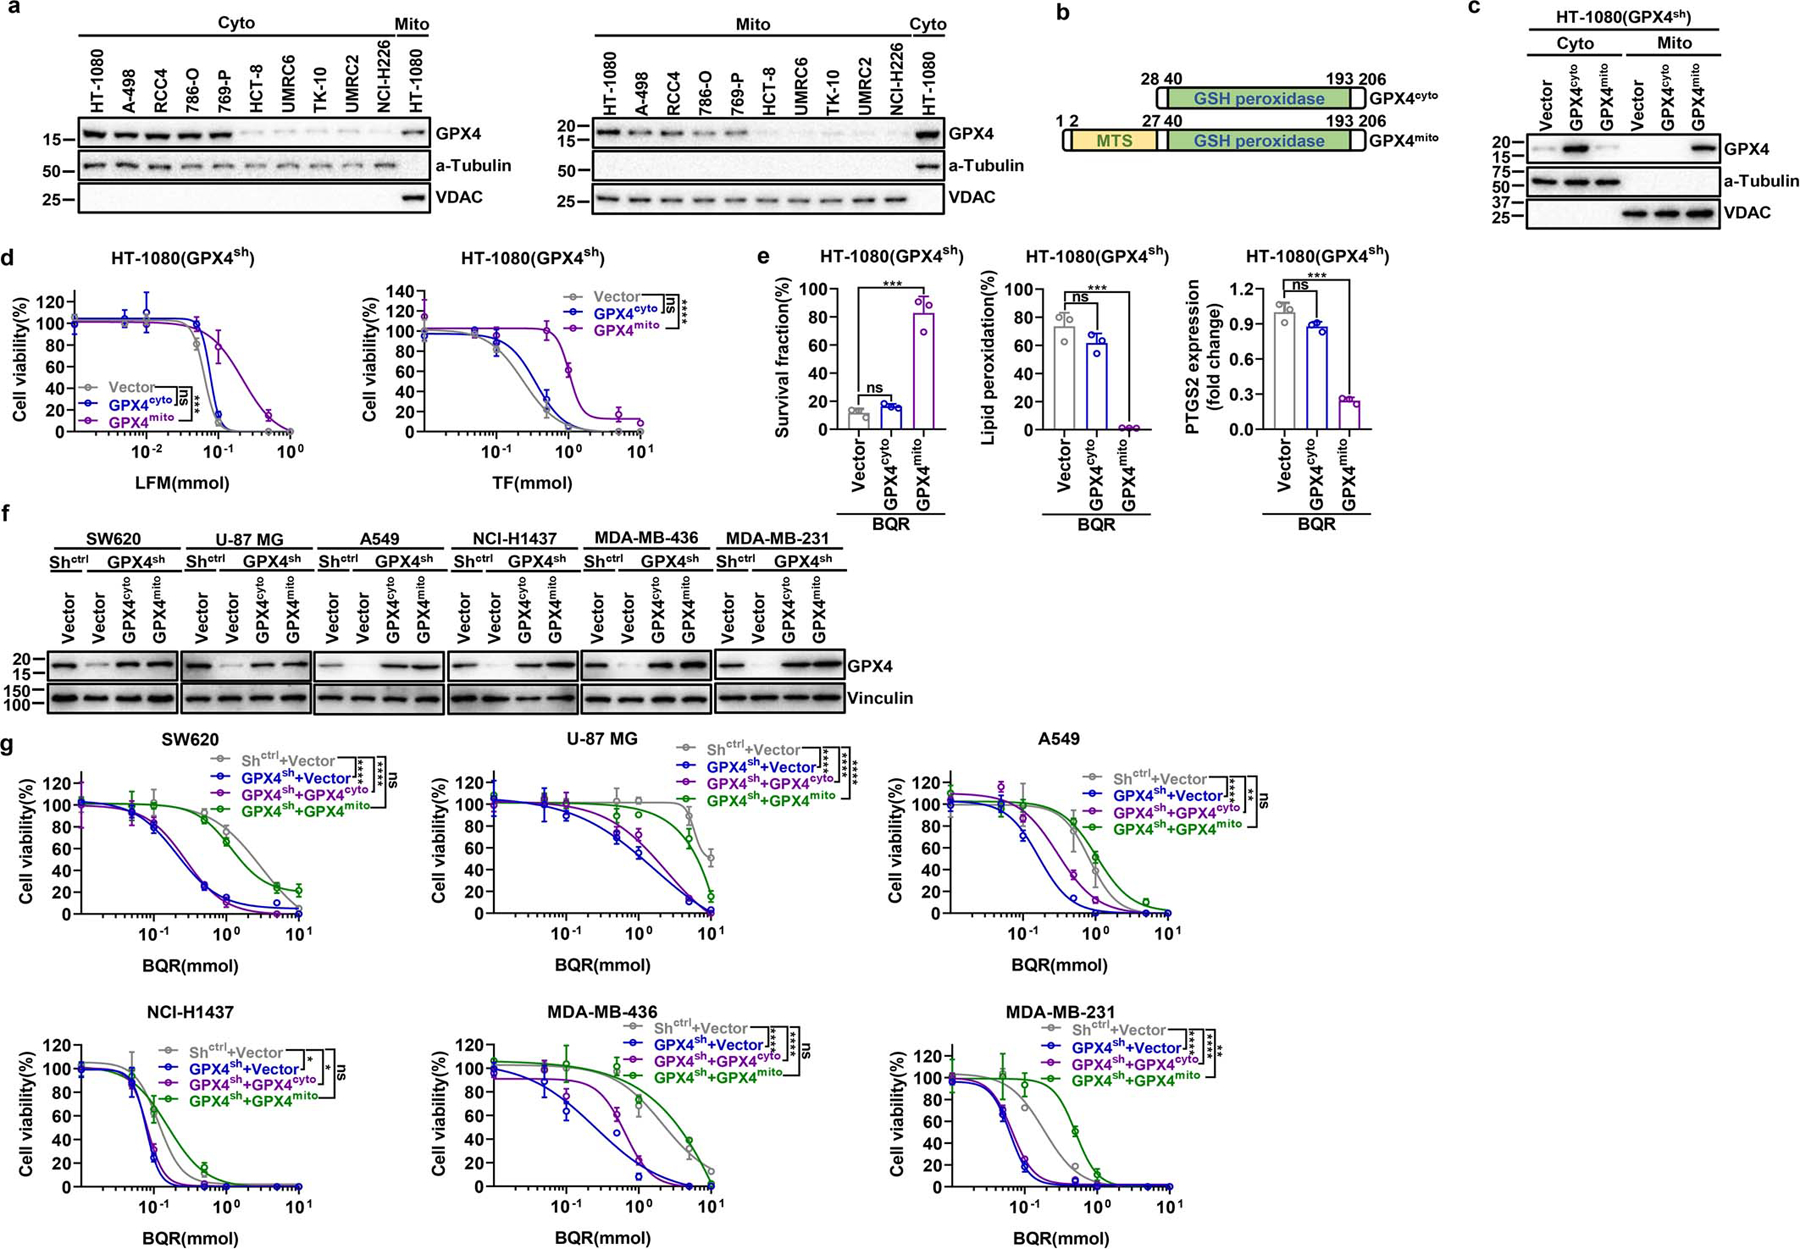
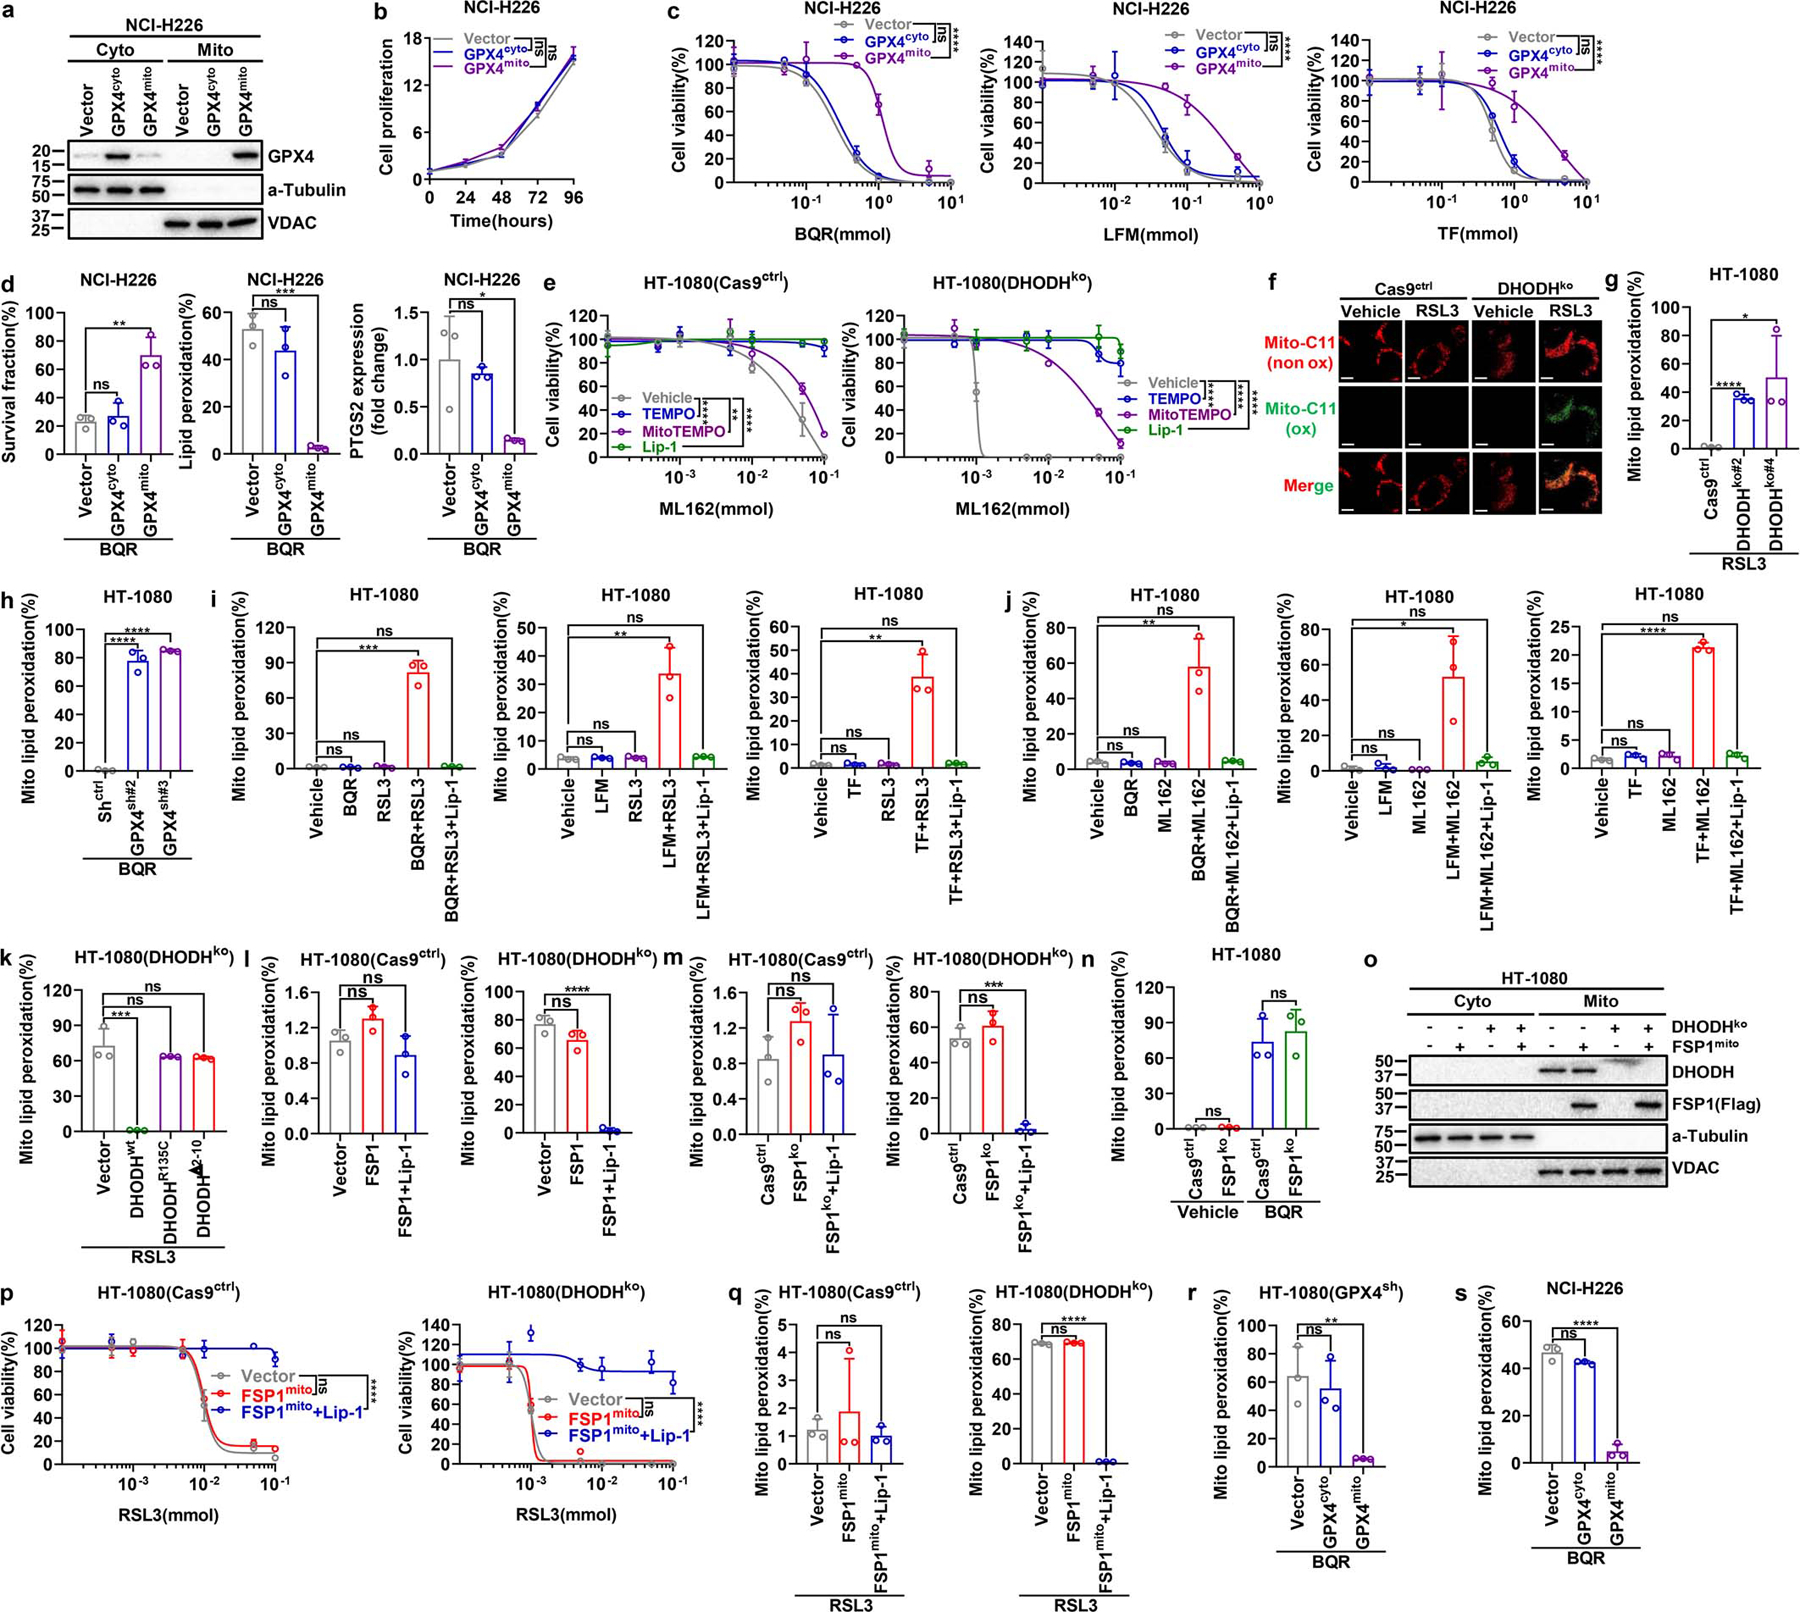
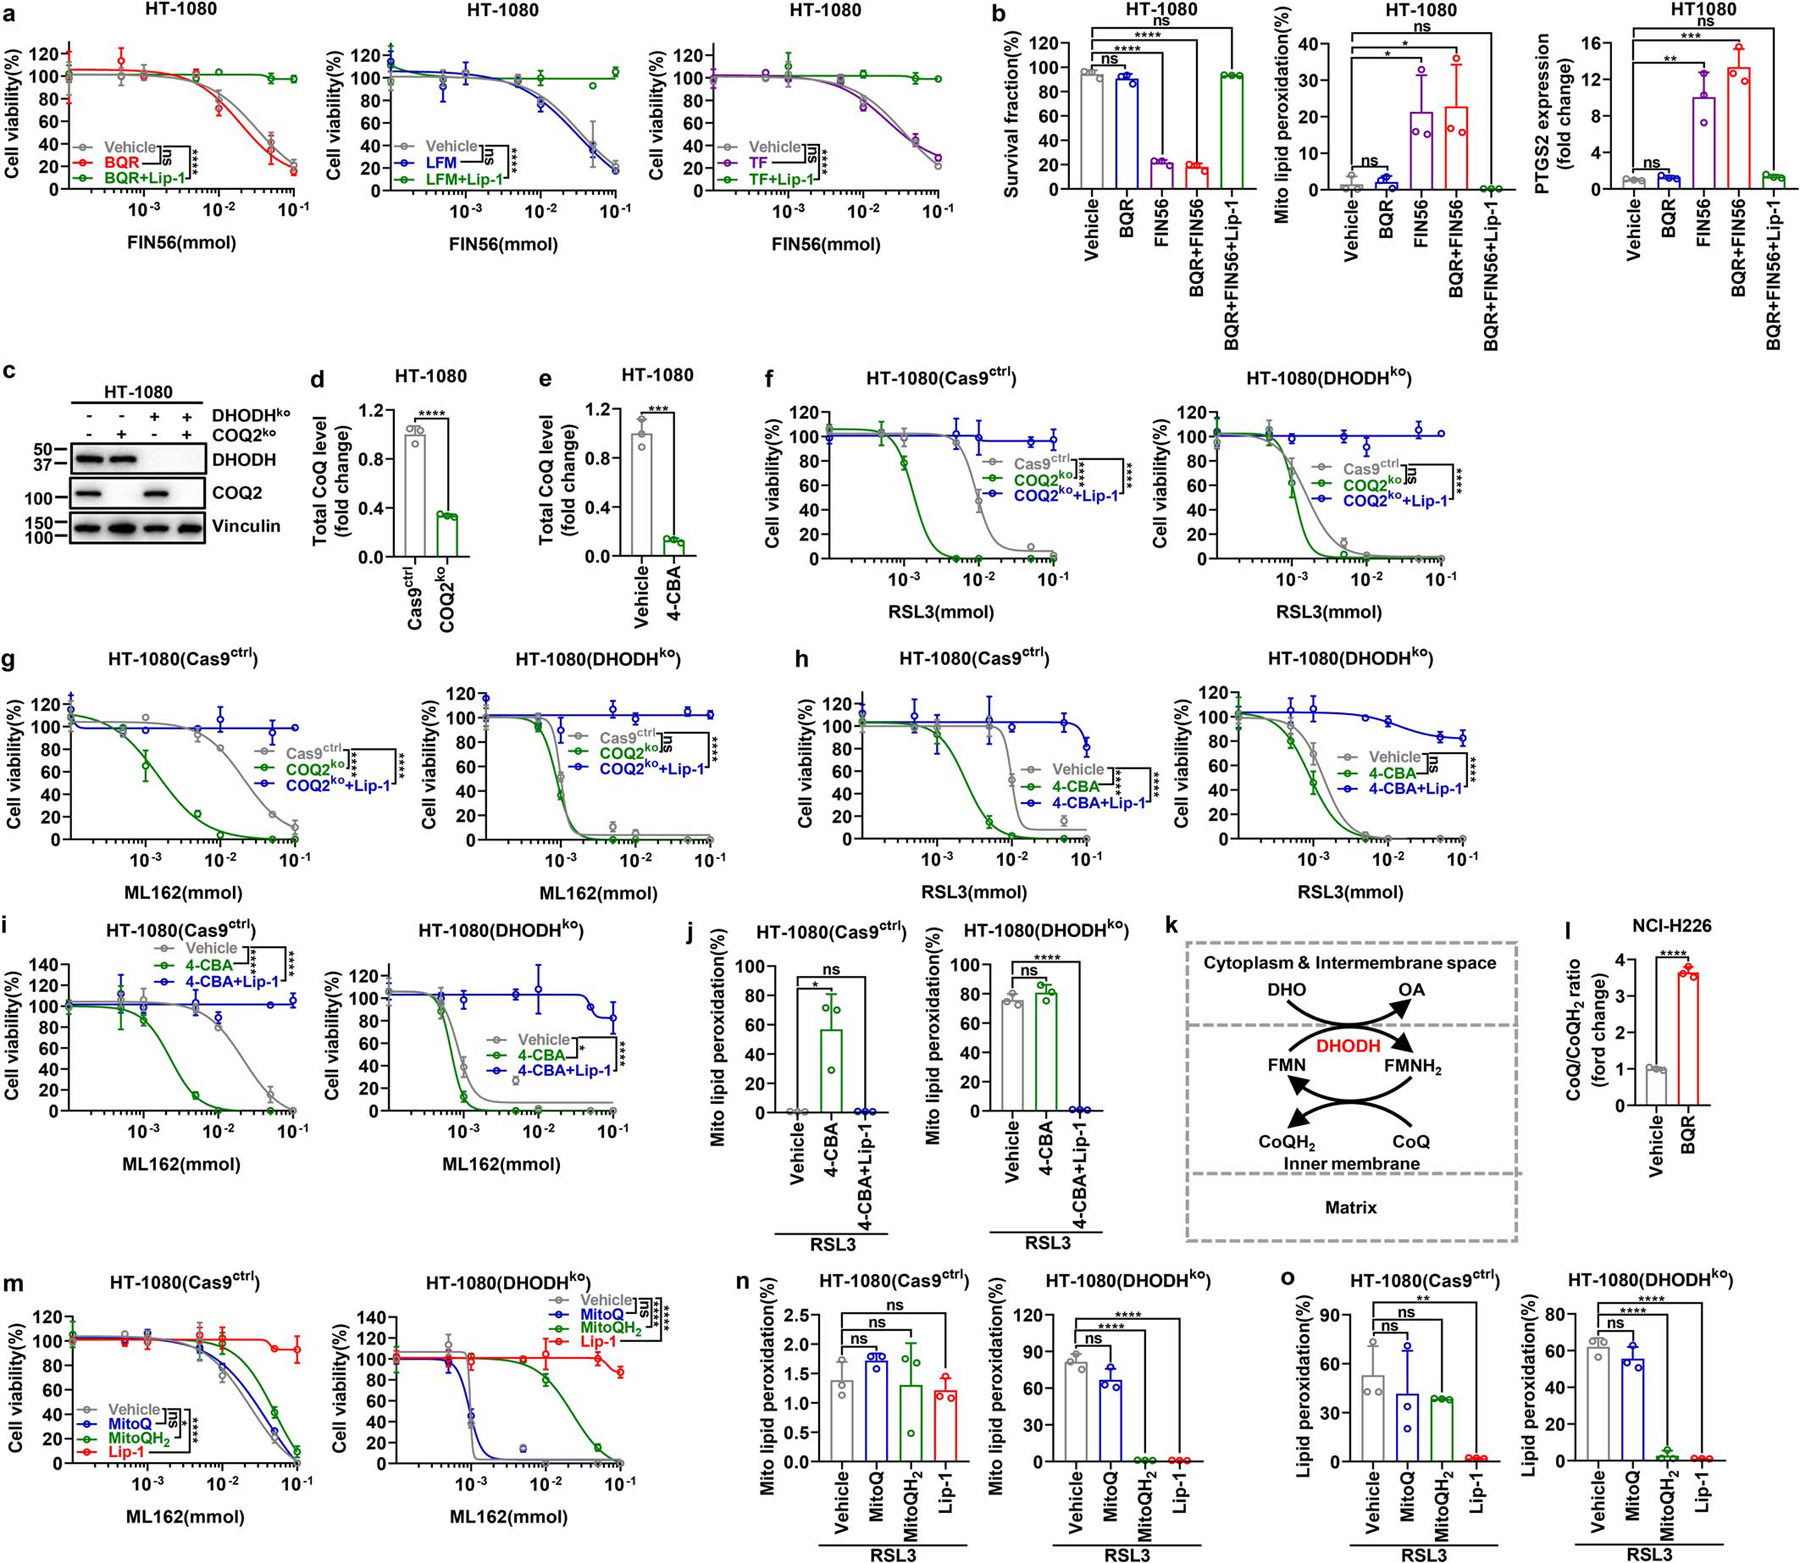
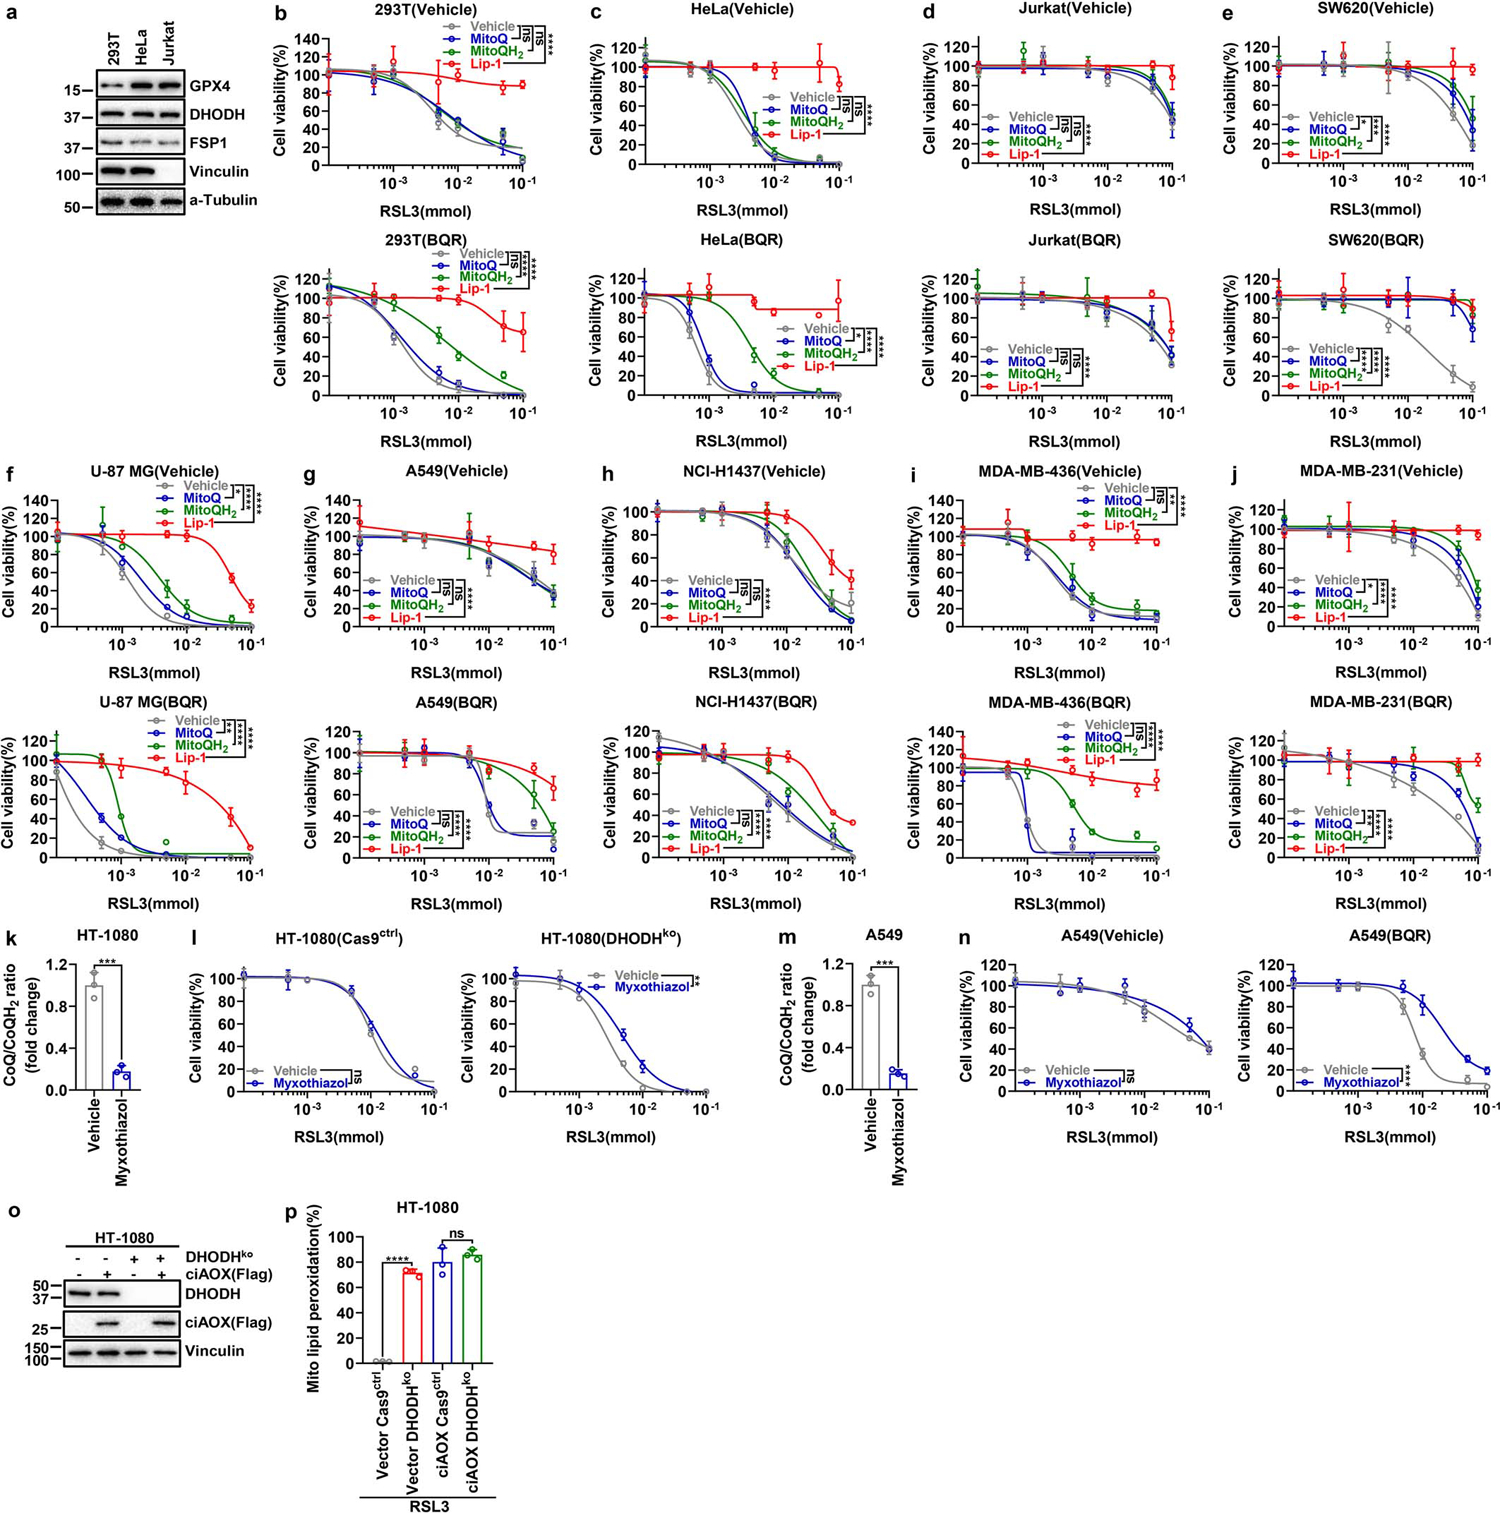
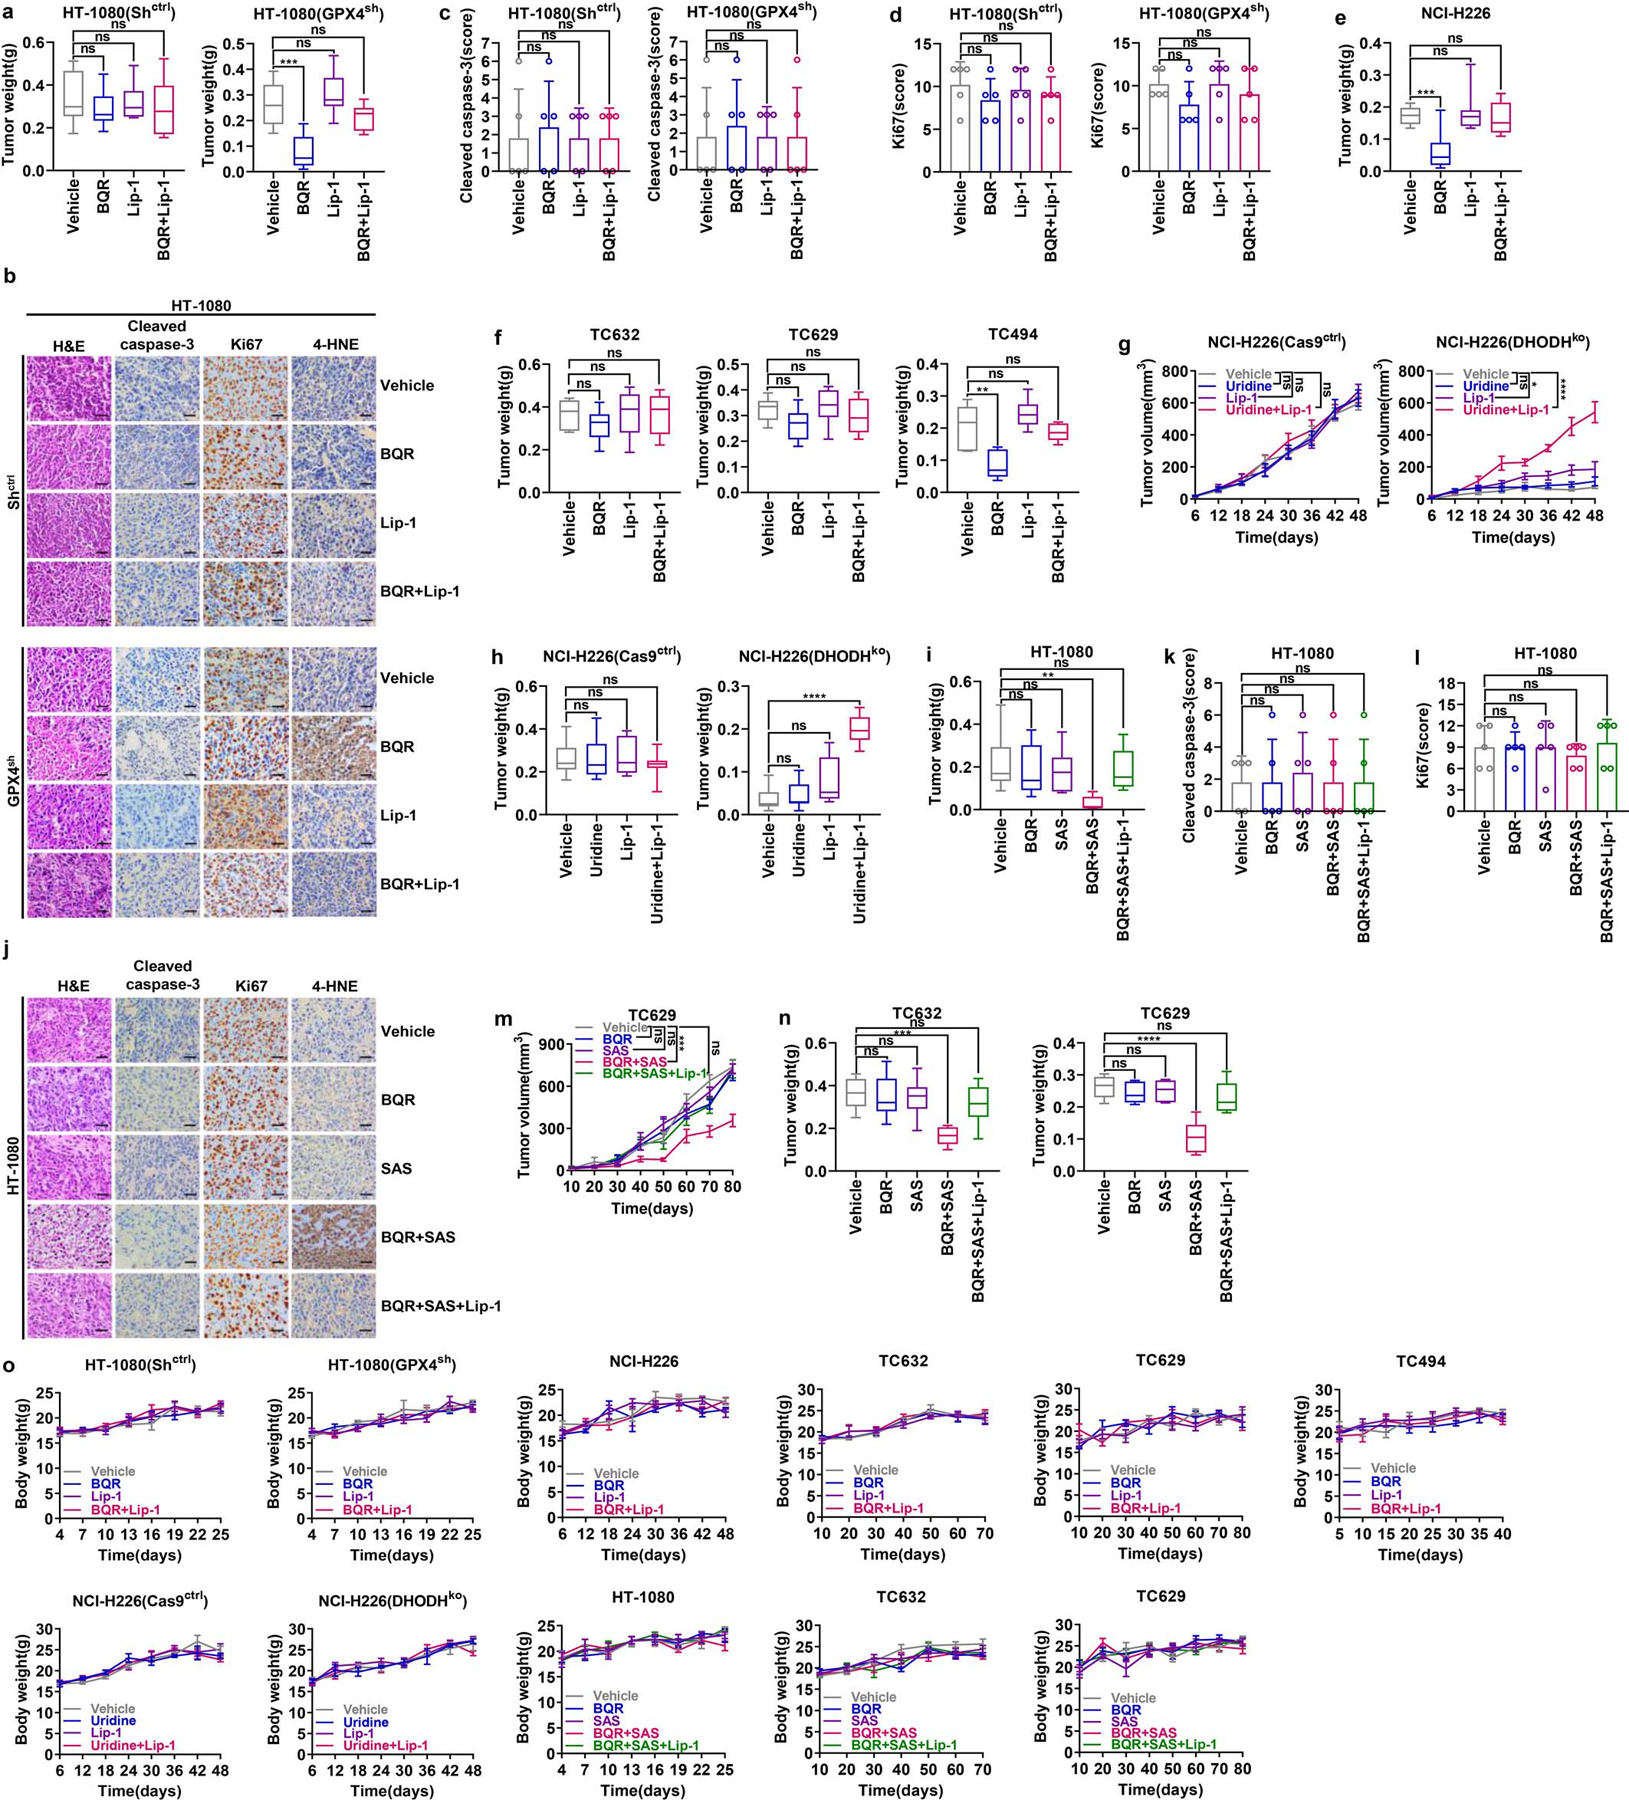
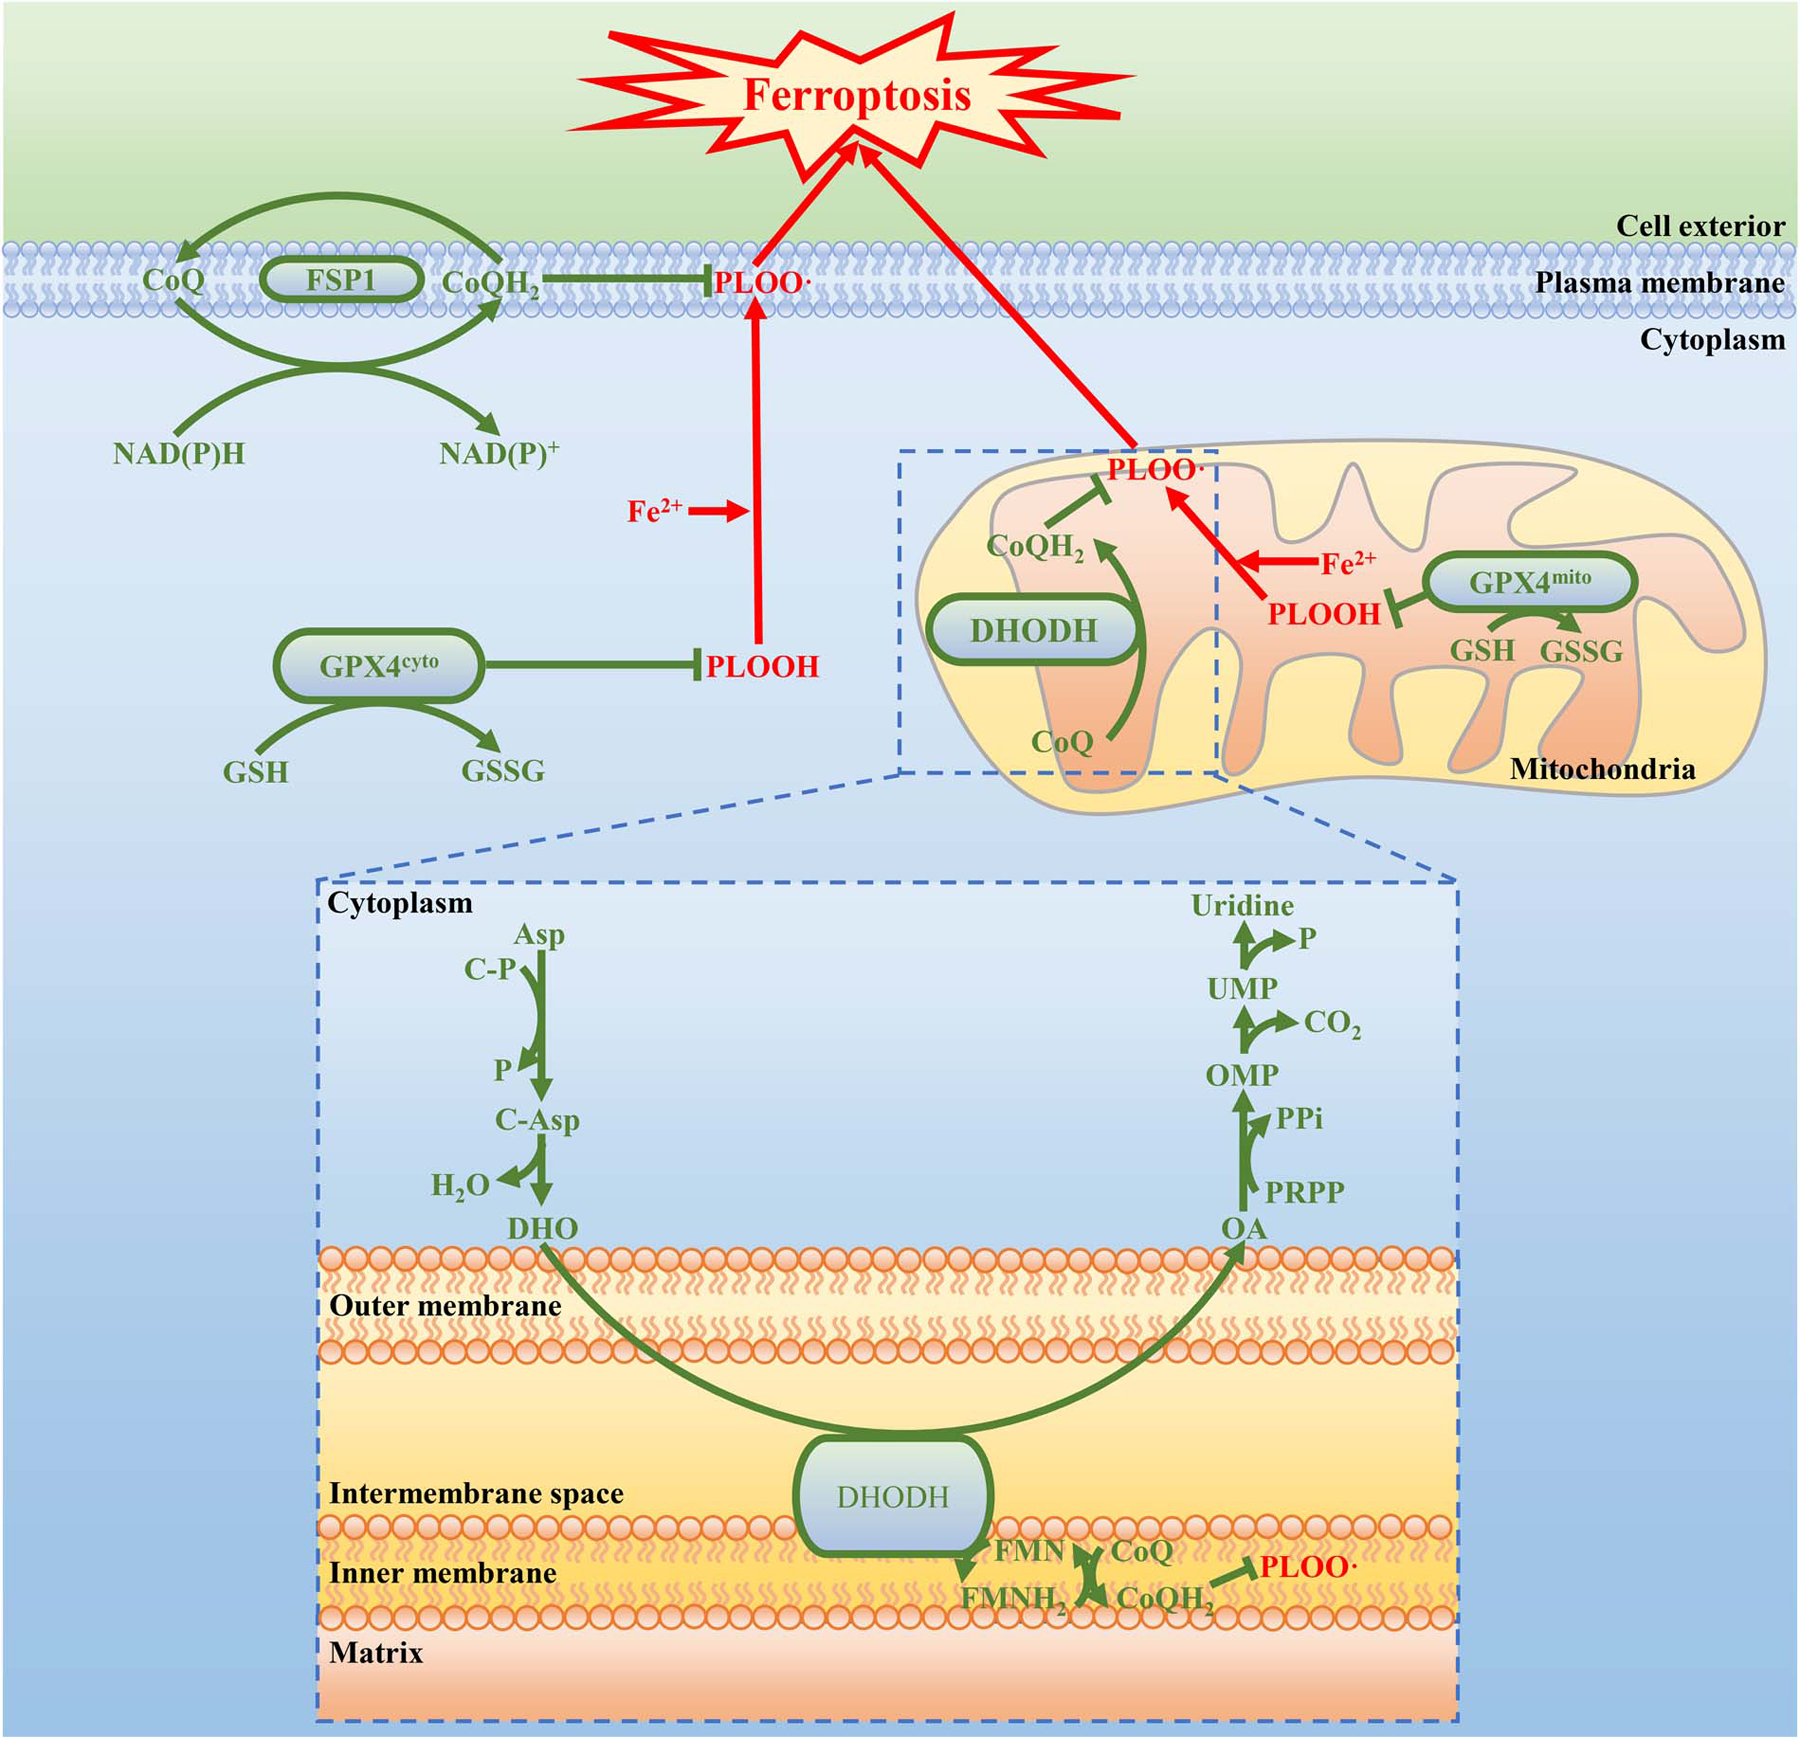
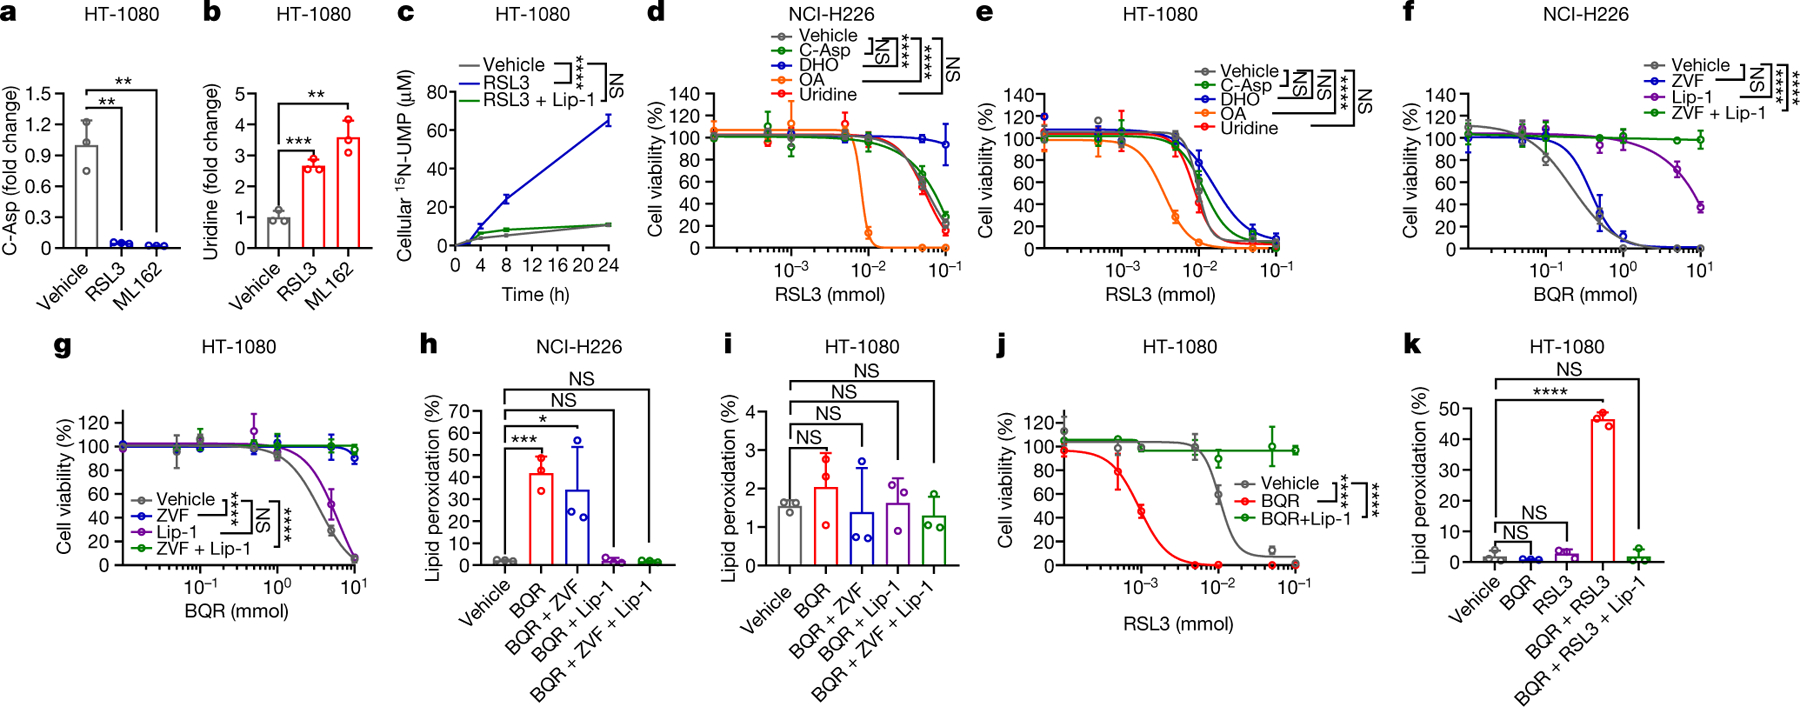
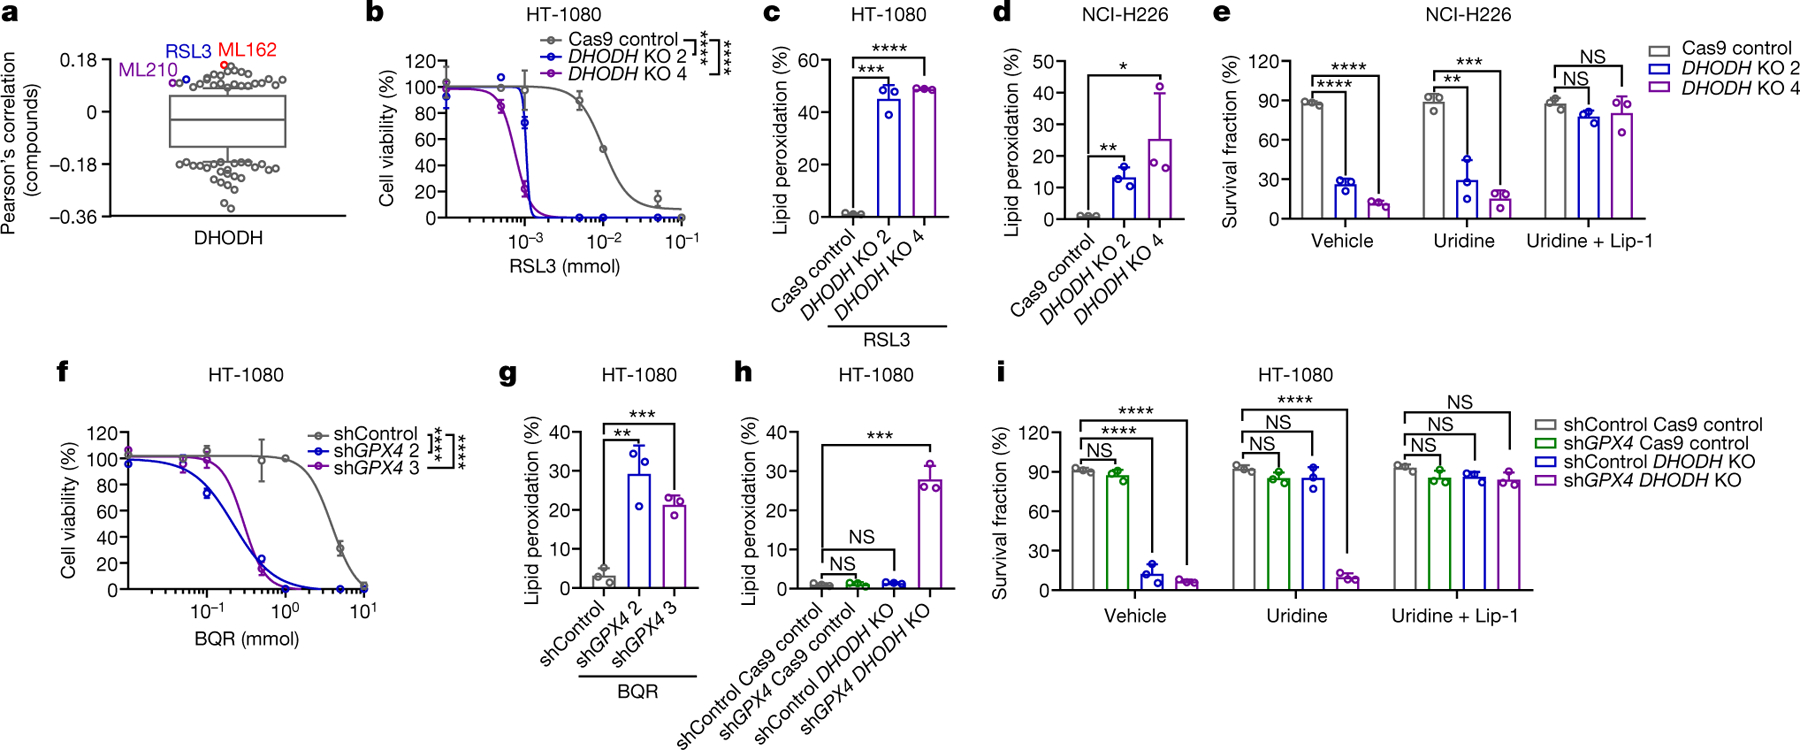
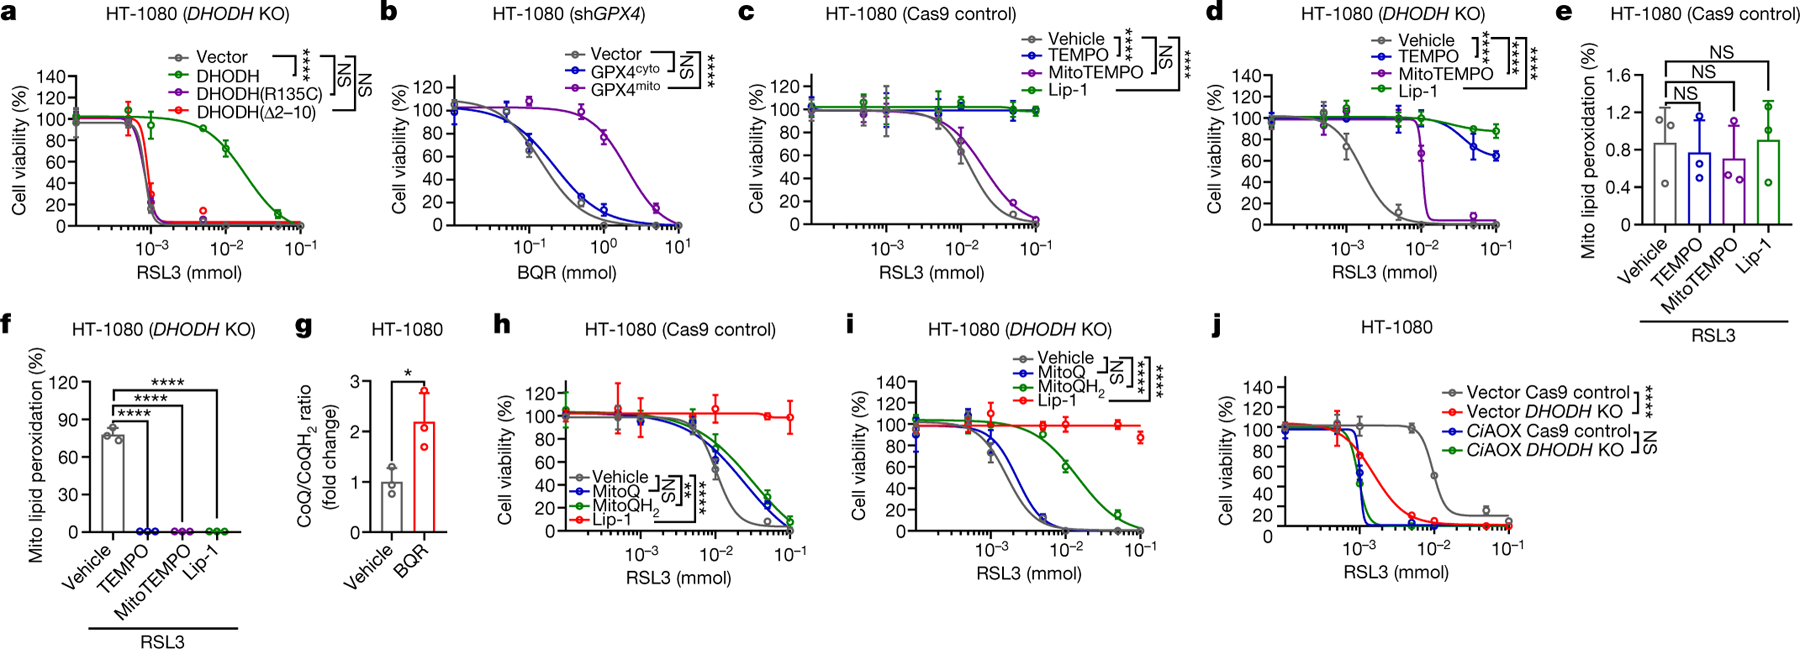
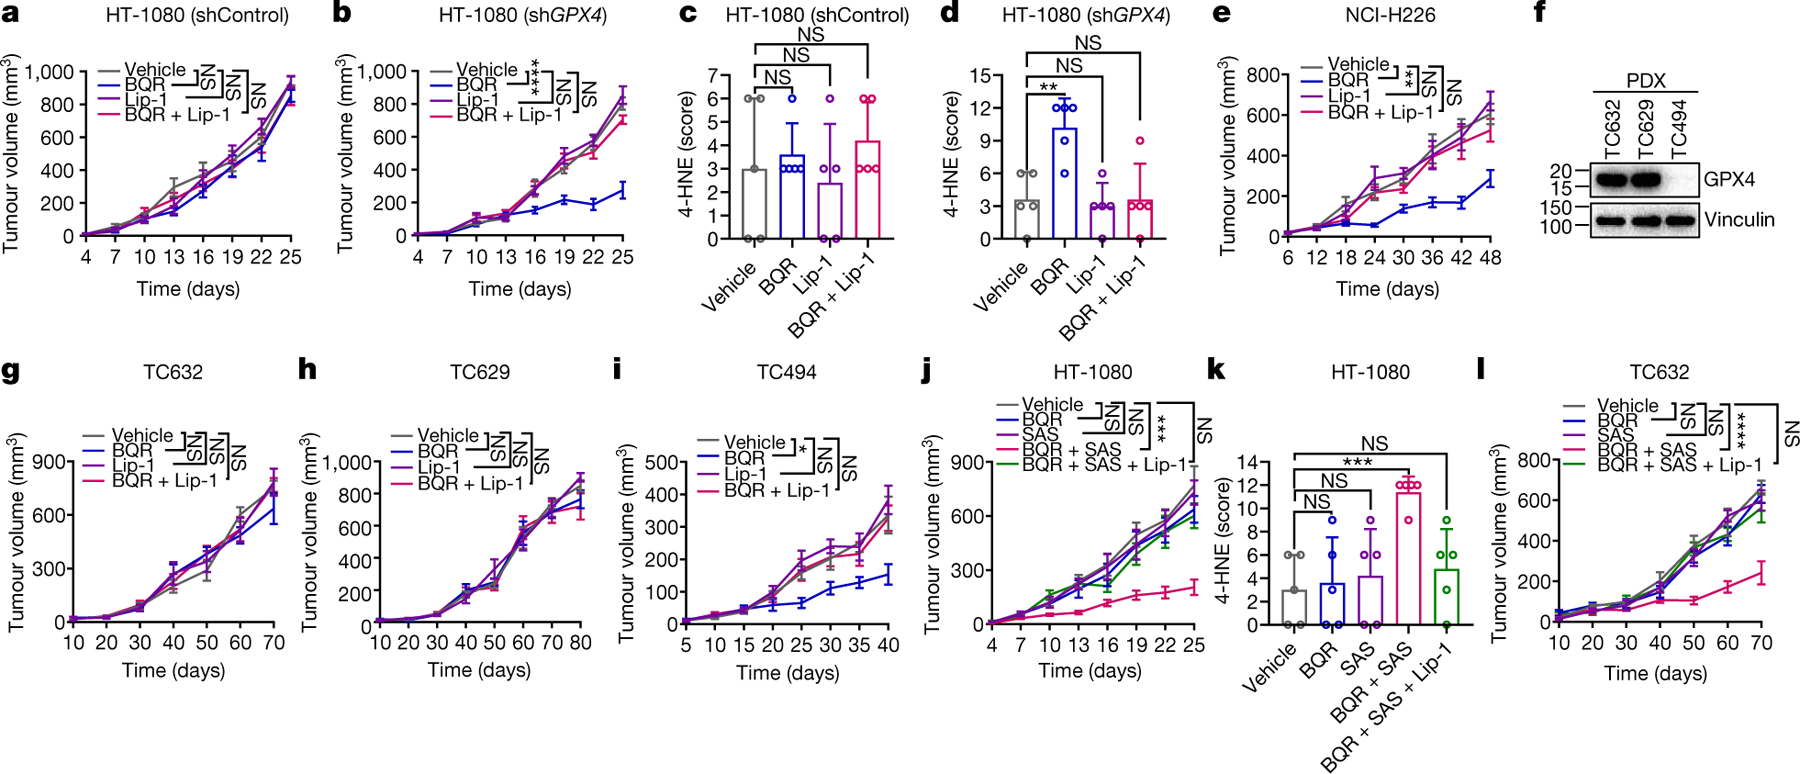
Ferroptosis, a form of regulated cell death that is induced by excessive lipid peroxidation, is a key tumour suppression mechanism1-4. Glutathione peroxidase 4 (GPX4)5,6 and ferroptosis suppressor protein 1 (FSP1)7,8 constitute two major ferroptosis defence systems. Here we show that treatment of cancer cells with GPX4 inhibitors results in acute depletion of N-carbamoyl-L-aspartate, a pyrimidine biosynthesis intermediate, with concomitant accumulation of uridine. Supplementation with dihydroorotate or orotate-the substrate and product of dihydroorotate dehydrogenase (DHODH)-attenuates or potentiates ferroptosis induced by inhibition of GPX4, respectively, and these effects are particularly pronounced in cancer cells with low expression of GPX4 (GPX4low). Inactivation of DHODH induces extensive mitochondrial lipid peroxidation and ferroptosis in GPX4low cancer cells, and synergizes with ferroptosis inducers to induce these effects in GPX4high cancer cells. Mechanistically, DHODH operates in parallel to mitochondrial GPX4 (but independently of cytosolic GPX4 or FSP1) to inhibit ferroptosis in the mitochondrial inner membrane by reducing ubiquinone to ubiquinol (a radical-trapping antioxidant with anti-ferroptosis activity). The DHODH inhibitor brequinar selectively suppresses GPX4low tumour growth by inducing ferroptosis, whereas combined treatment with brequinar and sulfasalazine, an FDA-approved drug with ferroptosis-inducing activity, synergistically induces ferroptosis and suppresses GPX4high tumour growth. Our results identify a DHODH-mediated ferroptosis defence mechanism in mitochondria and suggest a therapeutic strategy of targeting ferroptosis in cancer treatment.


Conflict of interest statement

Competing interests K.O. and M.V.P. are full-time employees of Kadmon Corporation, LLC. B.G, K.O., and M.C. have filed a patent application relating to the use of DHODH inhibitors to target ferroptosis in cancer therapy. Other authors declare no competing financial interests.

Figures

Extended Data Fig. 1.
Extended Data Fig. 1.. Pharmacologic inhibition of GPX4 affects intermediate levels in the de novo pyrimidine biosynthesis pathway.
a-c, Volcano plots comparing metabolomic profiles from HT-1080(a), A-498 (b) or RCC4 (c) cells treated with vehicle and the same cells treated with RSL3 (10 μM) or ML162 (10 μM) for 2 hours. d, e, Bar graph showing the fold changes in C-Asp and uridine induced by RSL3 (10 μM) or ML162 (10 μM) treatment for 2 hours compared with vehicle treatment in A-498 (d) or RCC4 (e) cells. f, Simplified schematic of de novo pyrimidine biosynthesis pathway. g, Bar graph showing the fold changes in intracellular DHO or OA levels upon treatment with vehicle, DHO (100 μM) or OA (100 μM), respectively, for 48 hours in NCI-H226 cells. h, Bar graph showing the fold changes in intracellular C-Asp levels upon treatment with vehicle or C-Asp (100 μM) for 48 hours in NCI-H226 cells. i, DHO activity measurement in HT-1080 cells treated with RSL3 (10 μM) for 2 hours, following pretreatment with vehicle, OA (100 μM) for 24 hours, or Lip-1 (10 μM) for 48 hours. j, GPX4 protein levels in different cell lines were determined by western blotting. k, Cell viability measurement in TK-10, UMRC2, A-498 or RCC4 cells treated with different doses of RSL3 for 4 hours, following pretreatment with vehicle, C-Asp (100 μM), DHO (100 μM), OA (100 μM), or uridine (50 μM) for 48 hours. l, Cell viability measurement in SW620, U-87 MG, A549, NCI-H1437, MDA-MB-436 or MDA-MB-231 cells treated with different doses of RSL3 for 4 hours, following pretreatment with vehicle, DHO (100 μM) or OA (100 μM) for 48 hours. m, GPX4, DHODH, and FSP1 protein levels in different cancer cell lines were determined by western blotting. n, Cell viability measurement in GPX4high (HT-1080, A-498, RCC4, 786-O, and 769-P) and GPX4low (HCT-8, UMRC6, TK-10, UMRC2, and NCI-H226) cells treated with different doses of DHODH inhibitors BQR, LFM, or TF for 4 hours. Data are presented as mean values +/− SD, n = 3 independent repeats (a-e, g-i, k, l, n). Statistical analysis was performed using unpaired, two-tailed t-test. Western blot is representative of two biological replicates (j, m). *P < 0.05, **P < 0.01, ***P < 0.001, ****P < 0.0001. Asp, aspartate; C-P, carbamoyl phosphate; P, phosphate; C-Asp, N-Carbamoyl-L-aspartate; DHO, dihydroorotate; FMN, flavin mononucleotide; FMNH2, reduced flavin mononucleotide; OA, orotate; PRPP, phosphoribosyl pyrophosphate; PPi, inorganic pyrophosphate; OMP, orotidine 5'-monophosphate; CO2, carbon dioxide; UMP, uridine 5'-monophosphate; BQR, brequinar; LFM, leflunomide; TF, teriflunomide.
Extended Data Fig. 2.
Extended Data Fig. 2.. The effect of DHODH inhibitors on inducing ferroptosis in different cancer cells with differential expression of GPX4.
a, b, Measurement of cell survival fraction and PTGS2 mRNA levels in NCI-H226 (a) or HT-1080 (b) cells upon treatment with BQR (500 μM for NCI-H226 cells; 5 mM for HT-1080 cells), following pretreatment with vehicle, ZVF (10 μM), and/or Lip-1 (10 μM) for 24 hours. c, Cell viability measurement in HT-1080 cells treated with different doses of RSL3 and co-treatment with LFM (100 μM) or TF (500 μM) for 4 hours, following pretreatment with vehicle or Lip-1 (10 μM) for 24 hours. d, Cell viability measurement in HT-1080 cells treated with different doses of ML162 and co-treatment with BQR (500 μM), LFM (100 μM), or TF (500 μM) for 4 hours, following pretreatment with vehicle or Lip-1 (10 μM) for 24 hours. e, Measurement of cell survival fraction and PTGS2 mRNA levels in HT-1080 cells upon treatment with RSL3 (1 μM) and/or BQR (500 μM) for 4 hours, following pretreatment with vehicle or Lip-1 (10 μM) for 24 hours. f, Cell viability measurement in HT-1080 cells treated with different doses of SAS and co-treatment with BQR (500 μM), LFM (100 μM) or TF (500 μM) for 4 hours, following pretreatment with vehicle or Lip-1 (10 μM) for 24 hours. g, Cell viability measurement in HT-1080 cells treated with different doses of erastin and co-treatment with BQR (500 μM), LFM (100 μM) or TF (500 μM) for 4 hours, following pretreatment with vehicle or Lip-1 (10 μM) for 24 hours. h, mRNA levels of SLC7A11, GPX4, or ACSL4, as well as their protein levels were measured in HT-1080 cells treated with BQR (500 μM), LFM (100 μM), or TF (500 μM) for 4 hours. i, GSH level measurement in HT-1080 cells upon treatment with BQR (500 μM), LFM (100 μM), or TF (500 μM) for 2 hours. Data are presented as mean values +/− SD, n = 3 independent repeats (a-i). Statistical analysis was performed using unpaired, two-tailed t-test. Western blot is representative of two biological replicates (h). *P < 0.05, **P < 0.01, ***P < 0.001, ****P < 0.0001. BQR, brequinar; LFM, leflunomide; TF, teriflunomide; ZVF, N-benzyloxycarbonyl-val-ala-asp(o-me) fluoromethyl ketone; Lip-1, liproxstatin-1; SAS, sulfasalazine; GSH, glutathione.
Extended Data Fig. 3.
Extended Data Fig. 3.. DHODH deletion sensitizes GPX4high cancer cells to ferroptosis or induces ferroptosis in GPX4low cancer cells.
a, DHODH protein levels in Cas9ctrl and DHODHko GPX4high cancer cell lines. b, DHO activity measurement in Cas9ctrl and DHODHko HT-1080 cells. c, Measurement of cell survival fraction in Cas9ctrl and DHODHko HT-1080 cells upon treatment with vehicle or uridine (50 μM). d, PTGS2 mRNA measurement in Cas9ctrl and DHODHko HT-1080 cells. e, Lipid peroxidation measurement in Cas9ctrl and DHODHko GPX4high cell lines as indicated. f, Cell viability measurement in Cas9ctrl and DHODHko HT-1080 cells treated with different doses of ML162 for 4 hours. g, Measurement of cell survival fraction and PTGS2 mRNA levels in Cas9ctrl and DHODHko HT-1080 cells upon treatment with RSL3 (1 μM) for 4 hours. h, Western blot analysis of DHODH and ACSL4 protein levels in HT-1080 cells with indicated genotypes. i, Cell viability measurement in HT-1080 cells with indicated genotypes treated with different doses of RSL3 for 4 hours. j, Measurement of SLC7A11, GPX4, or ACSL4 mRNA levels as well as their protein levels in Cas9ctrl and DHODHko HT-1080 cells. k, GSH levels measurement in Cas9ctrl and DHODHko HT-1080 cells. l, DHODH protein levels in Cas9ctrl and DHODHko GPX4low cell lines. m, DHO activity measurement in Cas9ctrl and DHODHko NCI-H226 cells. n, Cell proliferation measurement of Cas9ctrl and DHODHko NCI-H226 cells. o, Measurement PTGS2 mRNA levels in Cas9ctrl and DHODHko NCI-H226 cells. p, Lipid peroxidation measurement of Cas9ctrl and DHODHko GPX4low cells. Cells were grown in medium supplemented with Lip-1 (10 μM) (l, m) and/or uridine (50 μM) (a, b, d-p). Data are presented as mean values +/− SD, n = 3 independent repeats (b-g, i-k, m-p). Statistical analysis was performed using unpaired, two-tailed t-test. Western blot is representative of two biological replicates (a, h, j, l). *P < 0.05, **P < 0.01, ***P < 0.001, ****P < 0.0001. CTRP, Cancer Therapeutics Response Portal; DHO, dihydroorotate; GSH, glutathione.
Extended Data Fig. 4.
Extended Data Fig. 4.. Analyses of genetic interactions between DHODH and GPX4 (or FSP1).
a, Western blotting analysis of GPX4 and DHODH protein levels in Shctrl and GPX4sh HT-1080 cells. b, Cell proliferation measurement of Shctrl and GPX4sh HT-1080 cells. c, Cell viability measurement of Shctrl and GPX4sh HT-1080 cells treated with different doses of LFM or TF for 4 hours. d, Measurement of cell survival fraction and PTGS2 mRNA levels in Shctrl and GPX4sh HT-1080 cells upon treatment with BQR (500 μM) for 4 hours. e, Western blot analysis of GPX4 and DHODH protein levels in HT-1080 cells with indicated genotypes. f, Measurement of PTGS2 mRNA levels in HT-1080 cells with indicated genotypes. g, Cell proliferation measurement of DHODHko in Shctrl or GPX4sh HT-1080 cells. h, Western blot analysis of DHODH and FSP1 protein levels in HT-1080 cells with indicated genotypes. i, Cell viability measurement in Cas9ctrl or DHODHko HT-1080 cells with indicated genotypes treated with different doses of RSL3 for 4 hours, following pretreatment with vehicle or Lip-1 (10 μM) for 24 hours. j, Western blot analysis of DHODH and FSP1 protein levels in HT-1080 cells with indicated genotypes. k, Cell viability measurement in Cas9ctrl or DHODHko HT-1080 cells with indicated genotypes treated with different doses of RSL3 for 4 hours, following pretreatment with vehicle or Lip-1 (10 μM) for 24 hours. l, Cell viability measurement in Cas9ctrl or FSP1ko HT-1080 cells treated with vehicle or BQR (500 μM), and different doses of RSL3 for 4 hours. m, Simplified schematic of DHODH protein and its mutants as indicated. n, Western blotting showing DHODH protein levels in cytosolic and mitochondrial fractions from DHODHko HT-1080 cells that express the indicated DHODH constructs. o, DHO activity measurement in DHODHko HT-1080 cells that express the indicated DHODH constructs. p, Cell viability measurement in DHODHko HT-1080 cells that express the indicated DHODH constructs treated with different doses of ML162 for 4 hours. q, Measurement of cell survival fraction, lipid peroxidation and PTGS2 mRNA levels in DHODHko HT-1080 cells that express the indicated DHODH constructs upon treatment with RSL3 (1 μM). Cells were grown in medium supplemented with uridine (50 μM) (e-l, n-q). Data are presented as mean values +/− SD, n = 3 independent repeats (b-d, f, g, i, k, l, o-q). Statistical analysis was performed using unpaired, two-tailed t-test. Western blot is representative of two biological replicates (a, e, h, j, n). *P < 0.05, **P < 0.01, ***P < 0.001, ****P < 0.0001. LFM, leflunomide; TF, teriflunomide; BQR, brequinar; Lip-1, liproxstatin-1; MTS, mitochondrial targeting sequence; DHOD domain, dihydroorotate dehydrogenase domain; Cyto, cytosolic; Mito, mitochondrial.
Extended Data Fig. 5.
Extended Data Fig. 5.. DHODH cooperates with mitochondrial GPX4 to suppress ferroptosis.
a, Western blotting analyzing GPX4 levels in cytosolic and mitochondrial fractions in a panel of cancer cell lines. b, Simplified schematic of cytosolic and mitochondrial GPX4 protein constructs. c, Western blotting showing GPX4 protein levels in cytosolic and mitochondrial fractions from GPX4sh HT-1080 cells that express the indicated GPX4 constructs. d, Cell viability measurement in GPX4sh HT-1080 cells that express the indicated GPX4 constructs treated with different doses of LFM or TF for 4 hours. e, Measurement of cell survival fraction, lipid peroxidation and PTGS2 mRNA levels in GPX4sh HT-1080 cells that express the indicated GPX4 constructs upon treatment with BQR (500 μM). f, Western blotting showing GPX4 protein levels in GPX4sh cells that express the indicated GPX4 constructs in a variety of cell lines. g, Cell viability measurement in various GPX4sh cells that express the indicated GPX4 constructs treated with different doses of BQR for 4 hours. Data are presented as mean values +/− SD, n = 3 independent repeats (d, e, g). Statistical analysis was performed using unpaired, two-tailed t-test. Western blot is representative of two biological replicates (a, c, f). *P < 0.05, **P < 0.01, ***P < 0.001, ****P < 0.0001. Cyto, cytosolic; Mito, mitochondrial; MTS, mitochondrial targeting sequence; GSH peroxidase, glutathione peroxidase; LFM, leflunomide; TF, teriflunomide; BQR, brequinar.
Extended Data Fig. 6.
Extended Data Fig. 6.. Inactivation of DHODH and GPX4 induces mitochondrial lipid peroxidation.
a, Western blot showing GPX4 protein levels in cytosolic and mitochondrial fractions from NCI-H226 cells that express the indicated GPX4 constructs. b, Cell proliferation measurement of NCI-H226 cells that express the indicated GPX4 constructs. c, Cell viability measurement in NCI-H226 cells that express the indicated GPX4 constructs treated with different doses of BQR, LFM or TF for 4 hours. d, Measurement of cell survival fraction, lipid peroxidation and PTGS2 mRNA levels in NCI-H226 cells that express the indicated GPX4 constructs upon treatment with BQR (500 μM). e, Cell viability measurement in Cas9ctrl or DHODHko HT-1080 cells treated with different doses of ML162 for 4 hours, following pretreatment with vehicle, TEMPO (10 μM), MitoTEMPO (10 μM), or Lip-1 (10 μM) for 24 hours. f, Cas9ctrl or DHODHko HT-1080 cells were treated with RSL3 (1 μM) for 2 hours, then stained with mito-BODIPY. Oxidized mito-BODIPY (Green) indicates mitochondrial lipid peroxidation (Scale bar = 5 μM). g, Mitochondrial lipid peroxidation measurement in Cas9ctrl or DHODHko HT-1080 cells upon treatment with RSL3 (1 μM) for 2 hours. h, Mitochondrial lipid peroxidation measurement in Shctrl or GPX4sh HT-1080 cells upon treatment with BQR (500 μM) for 2 hours. i, Mitochondrial lipid peroxidation measurement of HT-1080 cells upon treatment with RSL3 (1 μM) and/or BQR (500 μM), LFM (100 μM), or TF (500 μM) for 2 hours, following pretreatment with vehicle or Lip-1 (10 μM) for 24 hours. j, Mitochondrial lipid peroxidation measurement of HT-1080 cells upon treatment with ML162 (1 μM) and/or BQR (500 μM), LFM (100 μM), or TF (500 μM) for 2 hours, following pretreatment with vehicle or Lip-1 (10 μM) for 24 hours. k, Mitochondrial lipid peroxidation measurement of DHODHko HT-1080 cells that express the indicated DHODH constructs upon treatment with RSL3 (1 μM) for 2 hours. l, m, Mitochondrial lipid peroxidation measurement in Cas9ctrl or DHODHko HT-1080 cells with indicated genotypes upon treatment with RSL3 (1 μM) for 2 hours, following pretreatment with vehicle or Lip-1 (10 μM) for 24 hours. n, Mitochondrial lipid peroxidation measurement in Cas9ctrl or FSP1ko HT-1080 cells upon treatment with RSL3 (1 μM) and/or BQR (500 μM) for 2 hours. o, Western blot analysis of DHODH and FSP1 protein levels in cytosolic (cyto) and mitochondrial (mito) fractions of HT-1080 cells with indicated genotypes. p, Cell viability measurement in Cas9ctrl or DHODHko HT-1080 cells with indicated genotypes treated with different doses of RSL3 for 4 hours, following pretreatment with vehicle or Lip-1 (10 μM) for 24 hours. q, Mitochondrial lipid peroxidation measurement in Cas9ctrl or DHODHko HT-1080 cells with indicated genotypes upon treatment with RSL3 (1 μM) for 2 hours, following pretreatment with vehicle or Lip-1 (10 μM) for 24 hours. r, Mitochondrial lipid peroxidation measurement of GPX4sh HT-1080 cells that express the indicated GPX4 constructs upon treatment with BQR (500 μM) for 2 hours. s, Mitochondrial lipid peroxidation measurement of NCI-H226 cells that express the indicated GPX4 constructs upon treatment with BQR (500 μM) for 2 hours. Cells were grown in medium supplemented with uridine (50 μM) (e-g, k-q). Data are presented as mean values +/− SD, n = 3 independent repeats (b-e, g-n, p-s). Statistical analysis was performed using unpaired, two-tailed t-test. Western blot is representative of two biological replicates (a, o). Images are representative of at least n = 5 imaged cells (f). *P < 0.05, **P < 0.01, ***P < 0.001, ****P < 0.0001. Cyto, cytosolic; Mito, mitochondrial; BQR, brequinar; LFM, leflunomide; TF, teriflunomide; BQR, brequinar; TEMPO, 2,2,6,6-tetramethyl-1-piperidinyloxy; MitoTEMPO, 2-(2,2,6,6-tetramethylpiperidin-1-oxyl-4-ylamino)-2-oxoethyl) triphenylphosphonium chloride; Lip-1, liproxstatin-1; Mito-C11, fluorescent mitochondria-targeted lipid peroxidation probe.
Extended Data Fig. 7.
Extended Data Fig. 7.. DHODH regulation of ferroptosis relates to its function to reduce CoQ to CoQH2 in mitochondria.
a, Cell viability measurement in HT-1080 cells treated with different doses of FIN56 and co-treatment with BQR (500 μM), LFM (100 μM) or TF (500 μM) for 4 hours, following pretreatment with vehicle or Lip-1 (10 μM) for 24 hours. b, Measurement of cell survival fraction, mitochondrial lipid peroxidation and PTGS2 mRNA levels in HT-1080 cells upon treatment with vehicle, FIN56 (50 μM) and/or BQR (500 μM), following pretreatment with vehicle or Lip-1 (10 μM) for 24 hours. c, Western blot analysis of COQ2 and DHODH protein levels in HT-1080 cells with indicated genotypes. d, Total CoQ measurement in Cas9ctrl or COQ2ko HT-1080 cells. e, Total CoQ measurement in HT-1080 cells that were treated with vehicle or 4-CBA (5 mM) for 24 hours. f, Cell viability measurement in Cas9ctrl or DHODHko HT-1080 cells with indicated genotypes treated with different doses of RSL3 for 4 hours, following pretreatment with vehicle or Lip-1 (10 μM) for 24 hours. g, Cell viability measurement in Cas9ctrl and DHODHko HT-1080 cells with indicated genotypes treated with different doses of ML162 for 4 hours, following pretreatment with vehicle or Lip-1 (10 μM) for 24 hours. h, Cell viability measurement in Cas9ctrl or DHODHko HT-1080 cells treated with different doses of RSL3 for 4 hours, following pretreatment with vehicle, 4-CBA (5 mM), or 4-CBA (5 mM) + Lip-1 (10 μM) for 24 hours. i, Cell viability measurement in Cas9ctrl and DHODHko HT-1080 cells treated with different doses of ML162 for 4 hours, following pretreatment with vehicle, 4-CBA (5 mM) and Lip-1 (10 μM) for 24 hours. j, Mitochondrial lipid peroxidation measurement in Cas9ctrl or DHODHko HT-1080 cells upon treatment with RSL3 (1 μM), following pretreatment with vehicle, 4-CBA (5 mM), or 4-CBA (5 mM) + Lip-1 (10 μM) for 24 hours. k, Simplified schematic showing how DHODH couples the oxidation of DHO to OA to the reduction of CoQ to CoQH2 in the mitochondrial inner membrane. l, CoQ/CoQH2 ratio measurement in NCI-H226 cells that were treated with BQR (1 mM) for 2 hours. m, Cell viability measurement in Cas9ctrl and DHODHko HT-1080 cells treated with different doses of ML162 for 4 hours, following pretreatment with vehicle, MitoQ (10 μM), MitoQH2 (10 μM), or Lip-1 (10 μM) for 24 hours. n, Mitochondrial lipid peroxidation measurement of Cas9ctrl or DHODHko HT-1080 cells upon treatment with RSL3 (1 μM) for 2 hours, following pretreatment with vehicle, MitoQ (10 μM), MitoQH2 (10 μM), or Lip-1 (10 μM) for 24 hours. o, Lipid peroxidation measurement of Cas9ctrl and DHODHko HT-1080 cells upon treatment with RSL3 (1 μM) for 2 hours, following pretreatment with vehicle, MitoQ (10 μM), MitoQH2 (10 μM), or Lip-1 (10 μM) for 24 hours. Cells were grown in medium supplemented with uridine (50 μM) (c, d, f-j, m-o). Data are presented as mean values +/− SD, n = 3 independent repeats (a, b, d-j, l-o). Statistical analysis was performed using unpaired, two-tailed t-test. Western blot is representative of two biological replicates (c). *P < 0.05, **P < 0.01, ***P < 0.001, ****P < 0.0001. BQR, brequinar; LFM, leflunomide; TF, teriflunomide; 4-CBA, 4-Carboxybenzaldehyde; DHO, dihydroorotate; OA, orotate; FMN, oxidized flavin mononucleotide; FMNH2, reduced flavin mononucleotide; CoQH2, reduced coenzyme Q; CoQ, oxidized coenzyme Q; OCR, oxygen consumption rate; MitoQ, [10-(4,5-dimethoxy-2-methyl-3,6-dioxo-1,4-cyclohexadien-1-yl)decyl] triphenyl-phosphonium, monomethanesulfonate; MitoQH2, [10-(2,5-dihydroxy-3,4-dimethoxy-6-methylphenyl)decyl] triphenyl-phosphonium, monomethanesulfonate; Lip-1, liproxstatin-1.
Extended Data Fig. 8.
Extended Data Fig. 8.. The effect of mitoQ and mitoQH2 on RSL3- and BQR-induced ferroptosis in a variety of cell lines.
a, GPX4, DHODH and FSP1 protein levels in indicated cell lines were determined by western blotting. b-j, Cell viability measurement in 293T (b), Hela (c), Jurkat (d), SW620 (e), U-87 MG (f), A549 (g), NCI-H1437 (h), MDA-MB-436 (i), and MDA-MB-231 (j) cells treated with different doses of RSL3 with vehicle or BQR (500 μM) for 4 hours, following pretreatment with vehicle, MitoQ (10 μM), MitoQH2 (10 μM), or Lip-1 (10 μM) for 24 hours. k, CoQ/CoQH2 ratio measurement in HT-1080 cells that were treated with myxothiazol (10 μM) for 2 hours. l, Cell viability measurement in Cas9ctrl and DHODHko HT-1080 cells treated with different doses of RSL3 for 4 hours, following pretreatment with vehicle or myxothiazol (1 μM) for 24 hours. m, CoQ/CoQH2 ratio measurement in A549 cells that were treated with myxothiazol (10 μM) for 2 hours. n, Cell viability measurement in A549 cells treated with different doses of RSL3 with or without BQR (500 μM) for 4 hours, following pretreatment with vehicle or myxothiazol (1 μM) for 24 hours. o, Western blot analysis of DHODH and ciAOX protein levels in HT-1080 cells with indicated genotypes. p, Mitochondrial lipid peroxidation measurement of HT-1080 cells with indicated genotypes upon treatment with RSL3 (1 μM) for 2 hours. Cells were grown in medium supplemented with uridine (50 μM) (l, o, p). Data are presented as mean values +/− SD, n = 3 independent repeats (b-n, p). Statistical analysis was performed using unpaired, two-tailed t-test. Western blot is representative of two biological replicates (a, o). *P < 0.05, **P < 0.01, ***P < 0.001, ****P < 0.0001. MitoQ, [10-(4,5-dimethoxy-2-methyl-3,6-dioxo-1,4-cyclohexadien-1-yl)decyl] triphenyl-phosphonium, monomethanesulfonate; MitoQH2, [10-(2,5-dihydroxy-3,4-dimethoxy-6-methylphenyl)decyl] triphenyl-phosphonium, monomethanesulfonate; Lip-1, liproxstatin-1.
Extended Data Fig. 9.
Extended Data Fig. 9.. DHODH inhibitor selectively suppresses GPX4low tumor growth.
a, Weight measurement of Shctrl and GPX4sh HT-1080 xenograft tumors with the indicated treatments. b-d, Representative immunochemical images from Shctrl and GPX4sh HT-1080 xenograft tumors with the indicated treatments (Scale bar = 20 μM) (b); staining scores of cleaved - caspase 3 (c) and ki67 (d) are also shown. e, Weight measurement of NCI-H226 xenograft tumors with the indicated treatments. f, Weight measurement of TC632, TC629, or TC494 PDXs tumors with the indicated treatments. g, Volumes of Cas9ctrl and DHODHko NCI-H226 xenograft tumors with the indicated treatments at different time points (days). h, Weight measurement of Cas9ctrl and DHODHko NCI-H226 xenograft tumors with the indicated treatments. i, Weight measurement of HT-1080 xenograft tumors with the indicated treatments. j-l, Representative immunochemistry images of HT-1080 xenograft tumors with the indicated treatments (Scale bar = 20 μM) (j); staining scores of cleaved - caspase 3 (k) and ki67 (l) are also shown. m, Volumes of TC629 PDXs tumors with the indicated treatments at different time points (days). n, Weight measurement of TC632 and TC629 PDX tumors with the indicated treatments. o, Mice weight measurement of all cell line xenografts or PDXs with different treatments at different time points (days) as indicated. Box plots indicate median, minima and maxima of the distributions (a, e, f, h, i, n). Data are presented as mean values +/− SD, n = 8 (a, e, g-i), n = 5 (c, d, k, l) or n = 6 independent tumors (f, m, n). n = 4 for nude mice weight and n = 8 for NSG mice weight (o). Statistical analysis was performed using unpaired, two-tailed t-test. Images are representative of n = 5 images (b, j). *P < 0.05, **P < 0.01, ***P < 0.001, ****P < 0.0001. BQR, brequinar; Lip-1, liproxstatin-1; H&E, hematoxylin and eosin; 4-HNE, 4-Hydroxynonenal; SAS, sulfasalazine; PDX, patient-derived xenograft.
Extended Data Fig. 10.
Extended Data Fig. 10.. The working model depicting how GPX4, FSP1, and DHODH suppress ferroptosis at different subcellular compartments.
See discussion in main text for detailed description. PLOOH, phospholipid hydroperoxide; PLOO ·, phospholipid hydroperoxyl radical; GSH, reduced glutathione; GSSH, oxidized glutathione; NAD(P)H, reduced nicotinamide adenine dinucleotide (phosphate); NAD(P)+, oxidized nicotinamide adenine dinucleotide (phosphate); CoQ, oxidized coenzyme Q; CoQH2, reduced coenzyme Q; FMNH2, reduced flavin mononucleotide; FMN, oxidized flavin mononucleotide; Asp, aspartate; C-P, carbamoyl phosphate; P, phosphate; C-Asp, N-Carbamoyl-L-aspartate; DHO, dihydroorotate; OA, orotate; PRPP, phosphoribosyl pyrophosphate; PPi, inorganic pyrophosphate; OMP, orotidine 5’-monophosphate; CO2, carbon dioxide; UMP, uridine 5’-monophosphate..
Fig. 1
Fig. 1. Metabolomics link DHODH to ferroptosis.
a, b, Fold changes in C-Asp (a) and uridine (b) induced by RSL3 (10 μM) or ML162 (10 μM) for 2 hours in HT-1080 cells. c, 15N-UMP levels in HT-1080 cells treated with RSL3 (10 μM) and/or liproxstatin-1 (Lip-1; 10 μM) for 2 hours. d, e, Cell viability in NCI-H226 (d) or HT-1080 cells (e) treated with RSL3 for 4 hours following pretreatment with vehicle, C-Asp (100 μM), DHO (100 μM), OA (100 μM), or uridine (50 μM) for 48 hours. f, g, Cell viability in NCI-H226 (f) or HT-1080 cells (g) treated with brequinar (BQR) for 4 hours following pretreatment with Lip-1 (10 μM) and/or Z-VAD-FMK (ZVF; 10 μM) for 24 hours. h, i, Lipid peroxidation in NCI-H226 (h) or HT-1080 (i) cells treated with BQR (500 μM), following pretreatment with vehicle, ZVF (10 μM), and/or Lip-1 (10 μM) for 24 hours. j, Cell viability in HT-1080 cells treated with RSL3 and BQR (500 μM) for 4 hours. k, Lipid peroxidation in HT-1080 cells treated with RSL3 (1 μM) and/or BQR (500 μM) for 2 hours, following pretreatment with vehicle or Lip-1 (10 μM) for 24 hours. Data are presented as mean values +/− SD, n = 3 independent repeats (a-k). Statistical analysis was performed using unpaired, two-tailed t-test. *P < 0.05, **P < 0.01, ***P < 0.001, ****P < 0.0001.
Fig. 2
Fig. 2. DHODH deletion promotes ferroptosis.
a, High DHODH expression correlates with resistance to GPX4 inhibitors (RSL3, ML162, and ML210) in cancer cells. Plotted data were mined from the CTRP database. Plotted values are Pearson’s correlation coefficients. Box plots indicate median, 10th and 90th percentiles, and minima and maxima of the distributions. b, Cell viability in Cas9ctrl and DHODHko HT-1080 cells treated with RSL3 for 4 hours. c, Lipid peroxidation in Cas9ctrl and DHODHko HT-1080 cells treated with RSL3 (1 μM) for 2 hours. d, Lipid peroxidation in Cas9ctrl and DHODHko NCI-H226 cells. e, Cell survival fraction in Cas9ctrl and DHODHko NCI-H226 cells treted with vehicle, uridine (50 μM), and uridine (50 μM) + Lip-1 (10 μM) for 24 hours. f, Cell viability in Shctrl and GPX4sh HT-1080 cells treated with BQR for 4 hours. g, Lipid peroxidation in Shctrl and GPX4sh HT-1080 cells treated with BQR (500 μM) for 2 hours. h, Lipid peroxidation in HT-1080 cells with indicated genotypes. i, Cell survival fraction in HT-1080 cells with indicated genotypes treated with vehicle, uridine (50 μM), and uridine (50 μM) + Lip-1 (10 μM) for 24 hours. Cells were grown in uridine supplemented medium (50 μM) (b-d, h). Data are presented as mean values +/− SD, n = 3 independent repeats (a-i). Statistical analysis was performed using unpaired, two-tailed t-test. *P < 0.05, **P < 0.01, ***P < 0.001, ****P < 0.0001.
Fig. 3
Fig. 3. DHODH suppresses mitochondrial lipid peroxidation.
a, b, Cell viability in HT-1080 cells with indicated genotypes treated with RSL3 (a) or BQR (b) for 4 hours. c, d, Cell viability in Cas9ctrl (c) or DHODHko (d) HT-1080 cells treated with RSL3 for 4 hours, following pretreatment with vehicle, TEMPO (10 μM), MitoTEMPO (10 μM), or Lip-1 (10 μM) for 24 hours. e, f, Mitochondrial lipid peroxidation in Cas9ctrl (e) or DHODHko (f) HT-1080 cells treated with RSL3 (1 μM) for 2 hours following pretreatment with vehicle, TEMPO (10 μM), MitoTEMPO (10 μM), or Lip-1 (10 μM) for 24 hours. g, CoQ/CoQH2 ratio in HT-1080 cells treated with BQR (1 mM) for 2 hours. h, i, Cell viability in Cas9ctrl (h) or DHODHko (i) HT-1080 cells treated with RSL3 for 4 hours, following pretreatment with vehicle, MitoQ (10 μM), MitoQH2 (10 μM), or Lip-1 (10 μM) for 24 hours. j, Cell viability in HT-1080 cells with indicated genotypes treated with RSL3 for 4 hours. Cells were grown in 50 μM uridine supplemented medium (a, c-f, h-j). Data are presented as mean values +/− SD, n = 3 independent repeats (a-j). Statistical analysis was performed using unpaired, two-tailed t-test. *P < 0.05, **P < 0.01, ***P < 0.001, ****P < 0.0001.
Fig. 4
Fig. 4. DHODH inhibitor treatment suppresses tumor growth through inducing ferroptosis.
a, b, e, g-j, l, Tumor volumes of Shctrl (a) and GPX4sh (b) HT-1080 xenografts, NCI-H226 xenografts (e), TC632 (g, l), TC629 (h) or TC494 (i) PDXs, or HT-1080 xenografts (j) with indicated treatments at different days. c, d, k, Immunochemistry scoring of 4-HNE staining in Shctrl (c) and GPX4sh (d) HT-1080 xenograft tumors, or HT-1080 xenograft tumors (k) with indicated treatments. f, GPX4 protein levels in different PDX models. Data are presented as mean values +/− SD, n = 8 (a, b, e, j), n = 5 (c, d, k) or n = 6 independent tumors (g-i, l). Statistical analysis was performed using unpaired, two-tailed t-test. Western blot is representative of two biological replicates (f). *P < 0.05, **P < 0.01, ***P < 0.001, ****P < 0.0001.

Comment in

References

    1. Dixon SJ et al. Ferroptosis: an iron-dependent form of nonapoptotic cell death. Cell 149, 1060–1072 (2012). - PMC - PubMed
    1. Stockwell BR et al. Ferroptosis: A Regulated Cell Death Nexus Linking Metabolism, Redox Biology, and Disease. Cell 171, 273–285 (2017). - PMC - PubMed
    1. Jiang L et al. Ferroptosis as a p53-mediated activity during tumour suppression. Nature 520, 57–62 (2015). - PMC - PubMed
    1. Zhang Y et al. BAP1 links metabolic regulation of ferroptosis to tumour suppression. Nat Cell Biol 20, 1181–1192 (2018). - PMC - PubMed
    1. Yang WS et al. Regulation of ferroptotic cancer cell death by GPX4. Cell 156, 317–331 (2014). - PMC - PubMed

Publication types

Substances