. 2021 May;593(7860):580-585.
doi: 10.1038/s41586-021-03533-z. Epub 2021 May 12.

Mitochondrial TNAP controls thermogenesis by hydrolysis of phosphocreatine

Affiliations

Mitochondrial TNAP controls thermogenesis by hydrolysis of phosphocreatine

Yizhi Sun et al. Nature. 2021 May.

Abstract

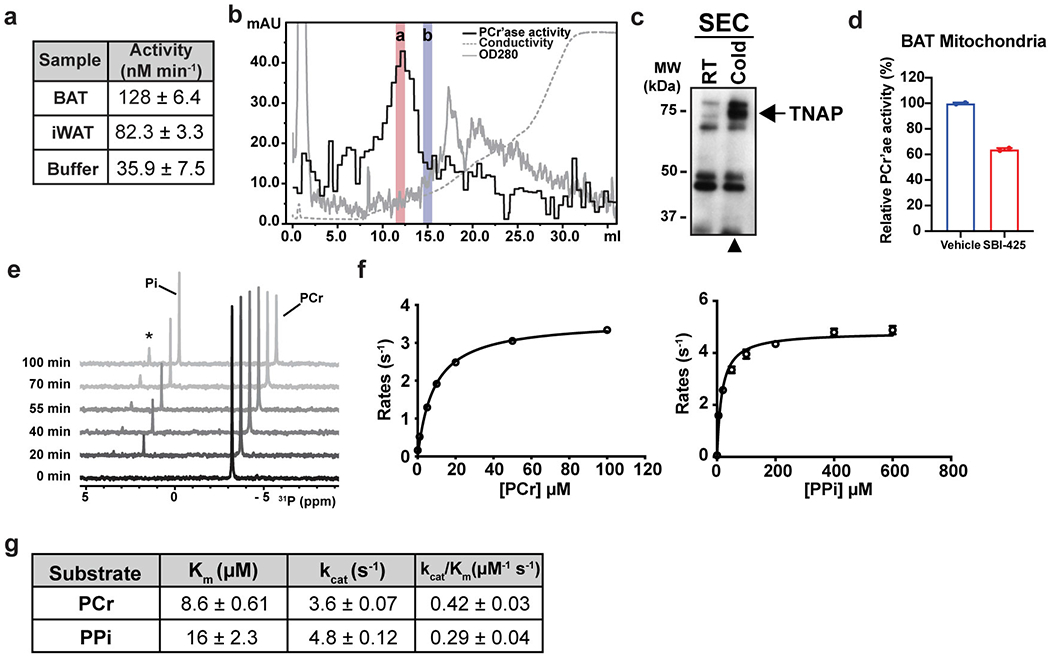
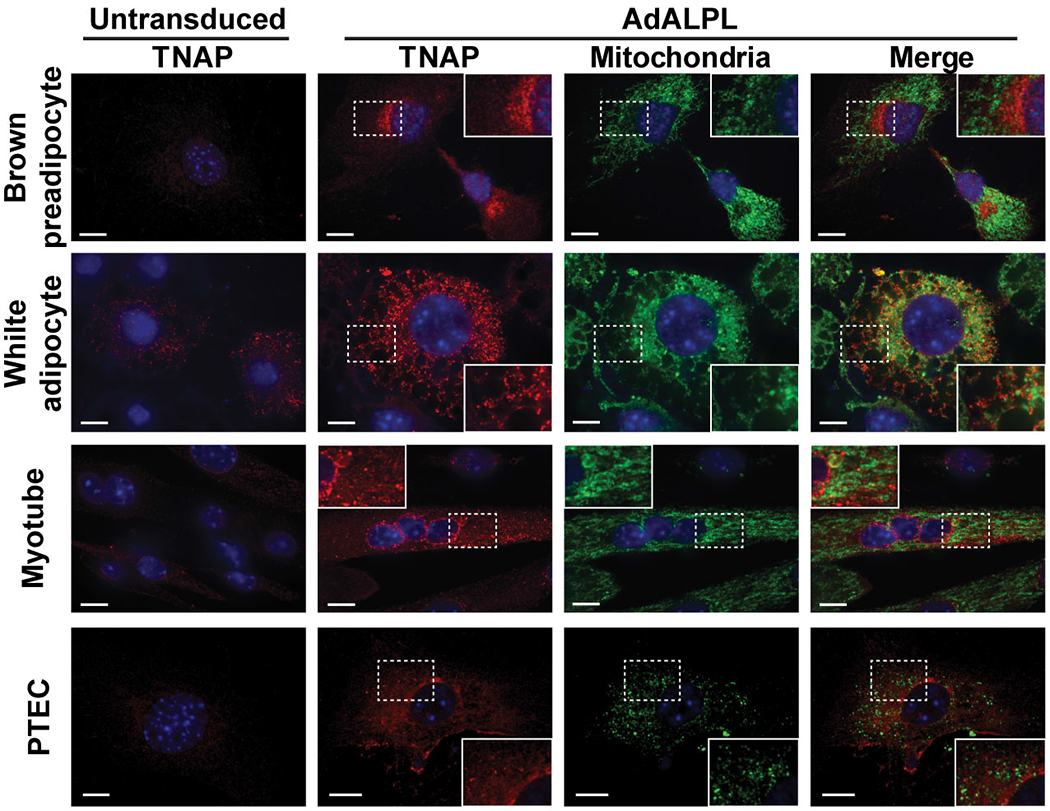
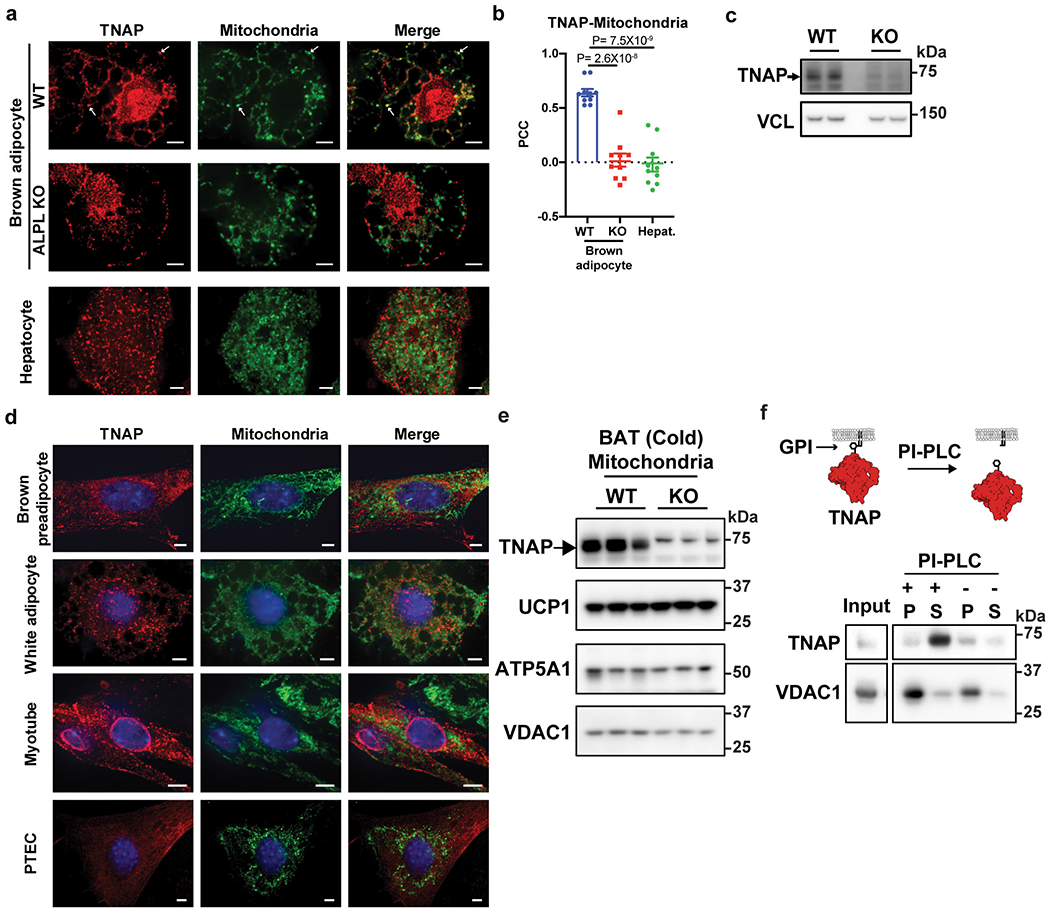
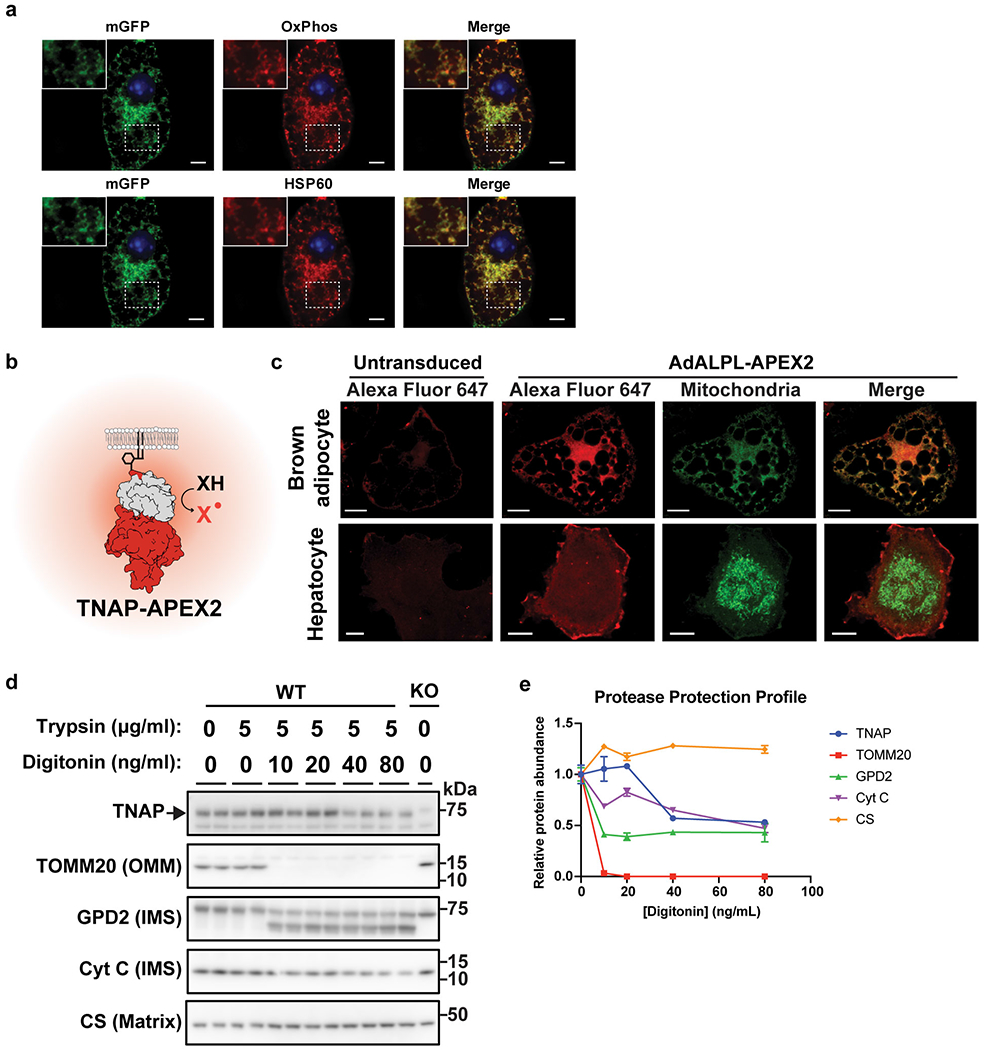
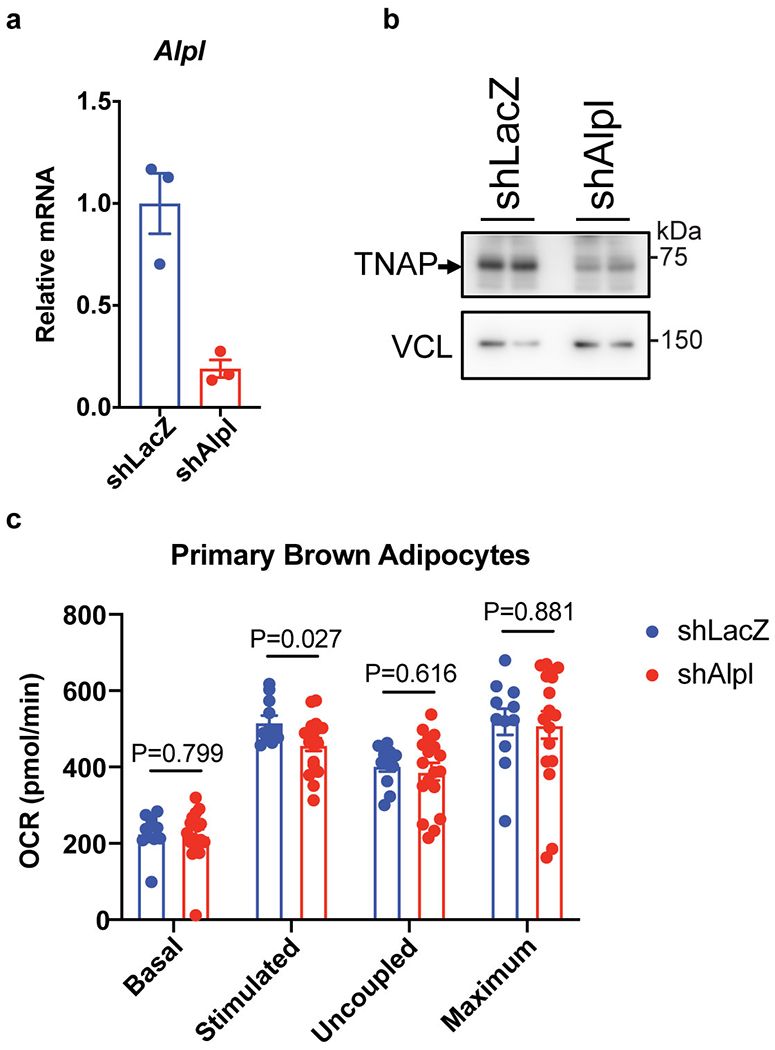
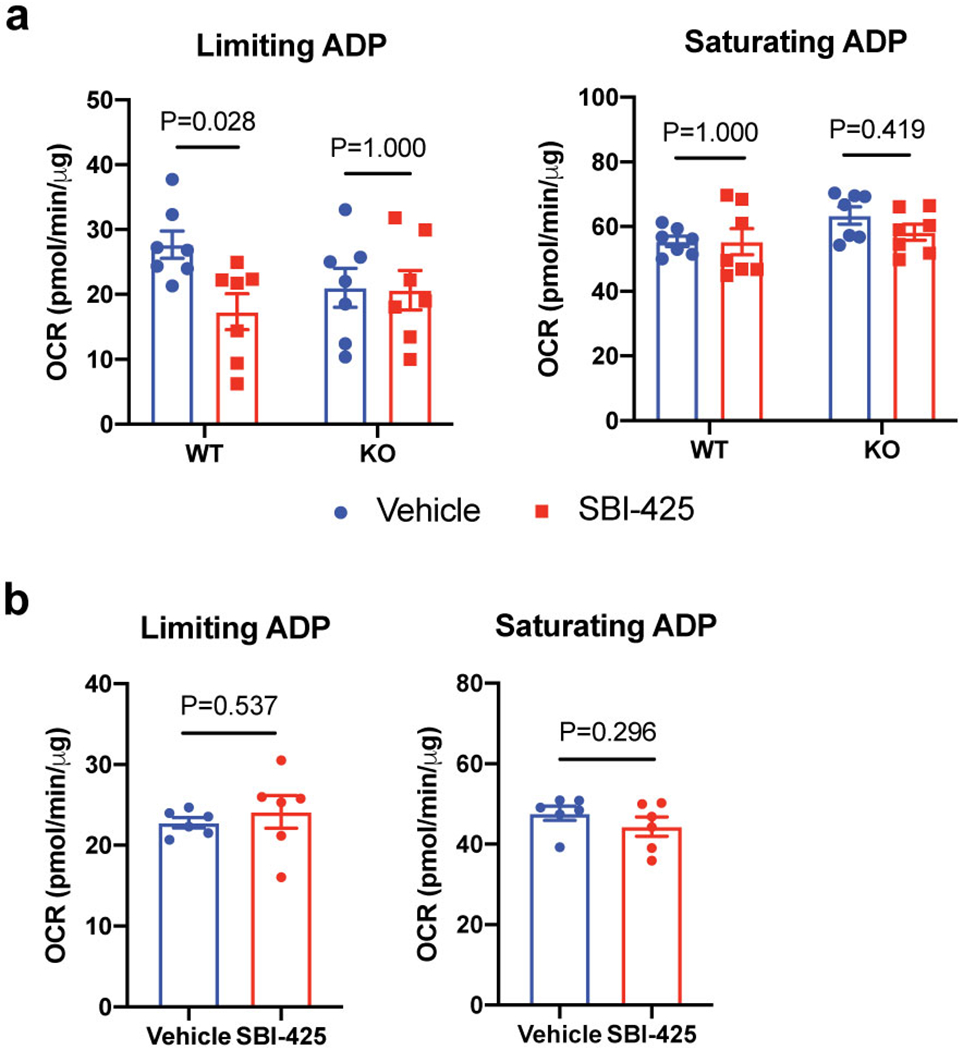
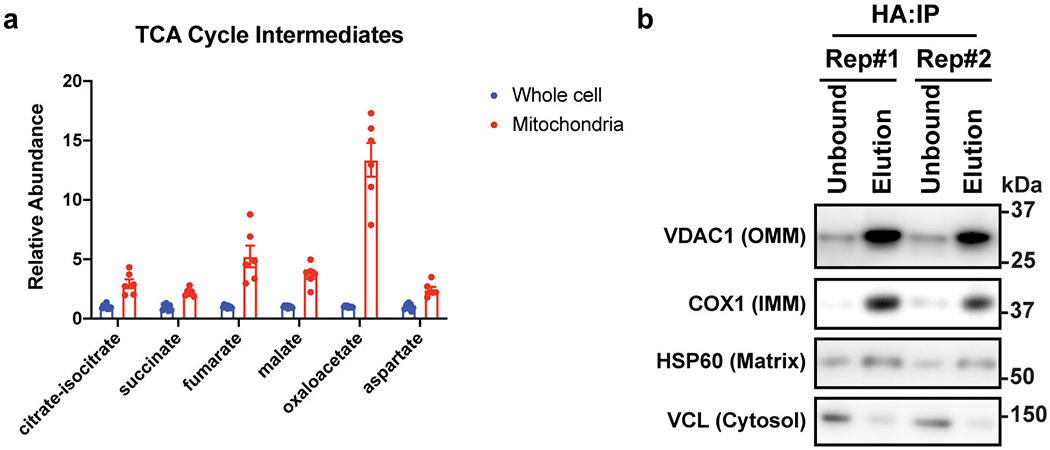
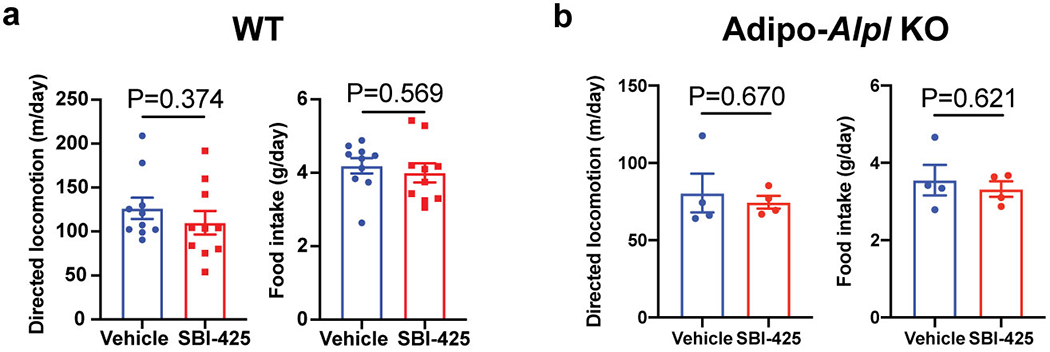
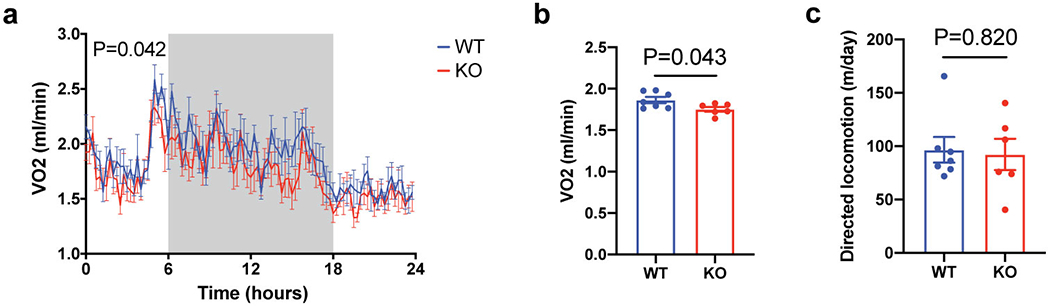
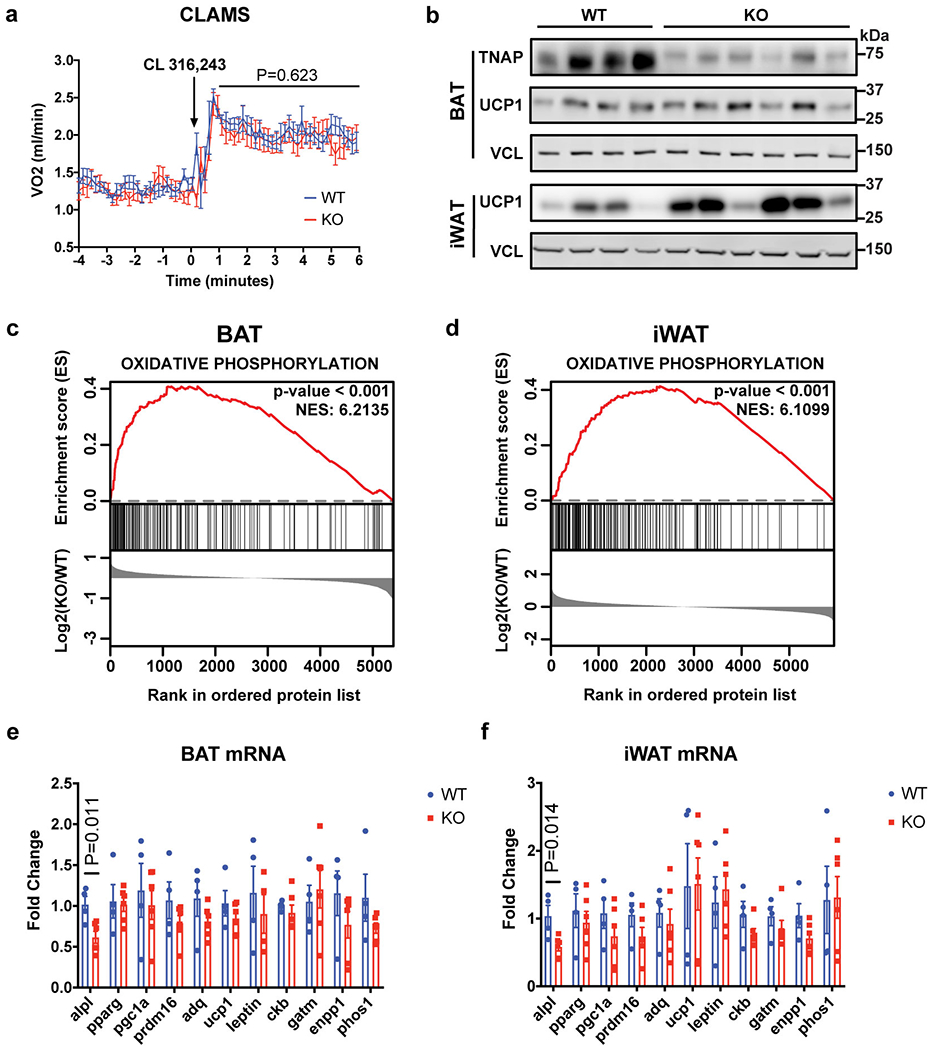
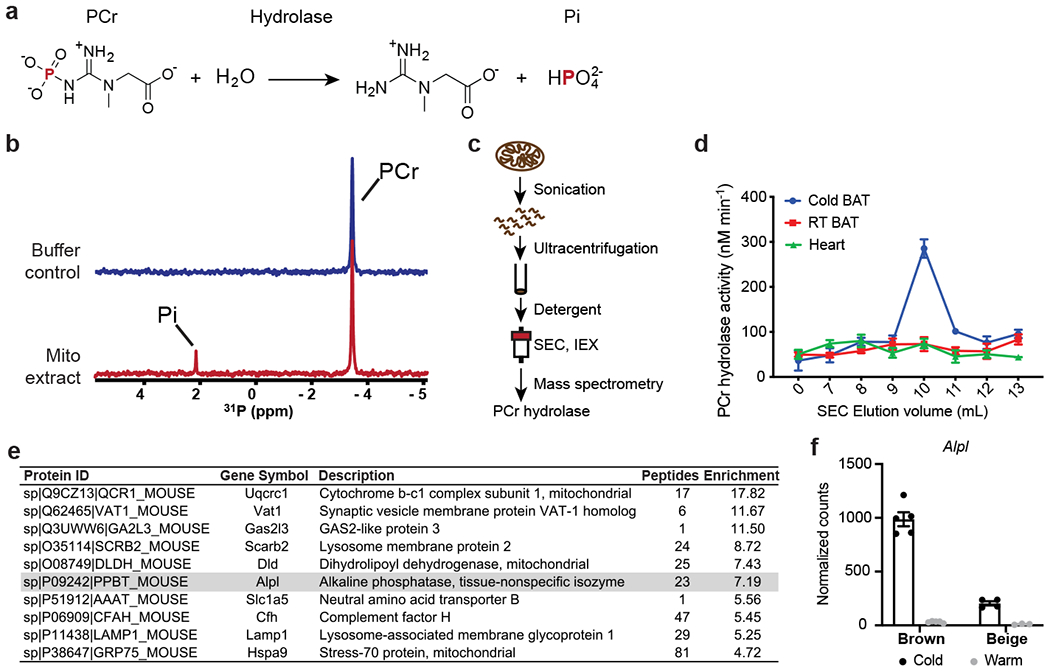
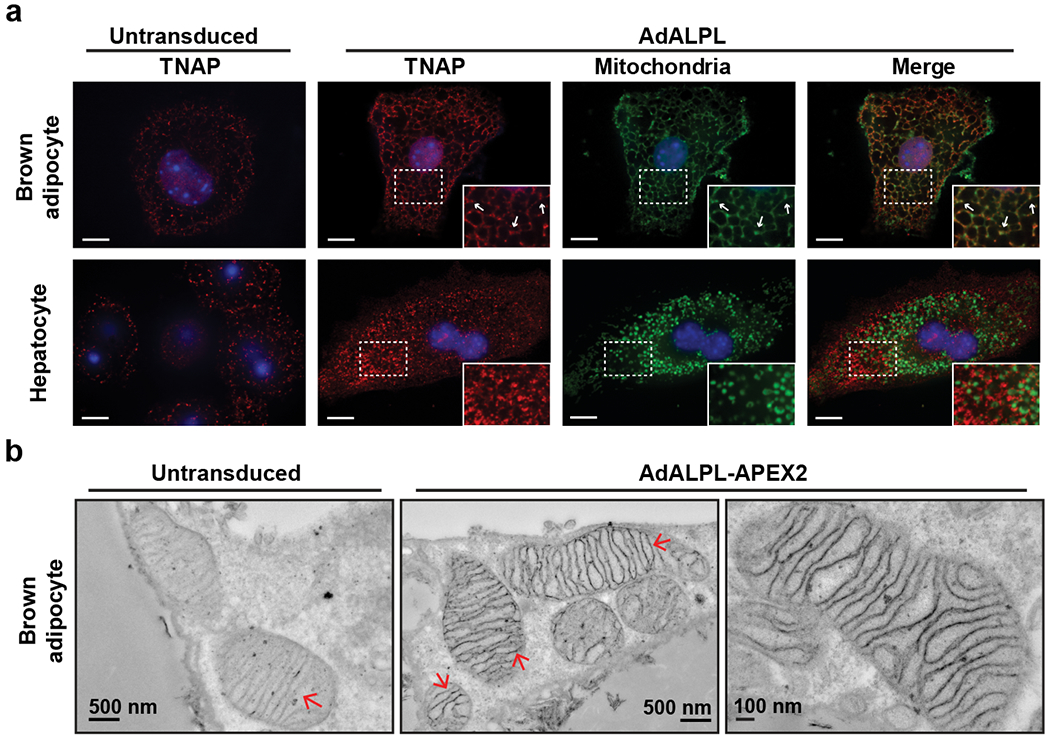
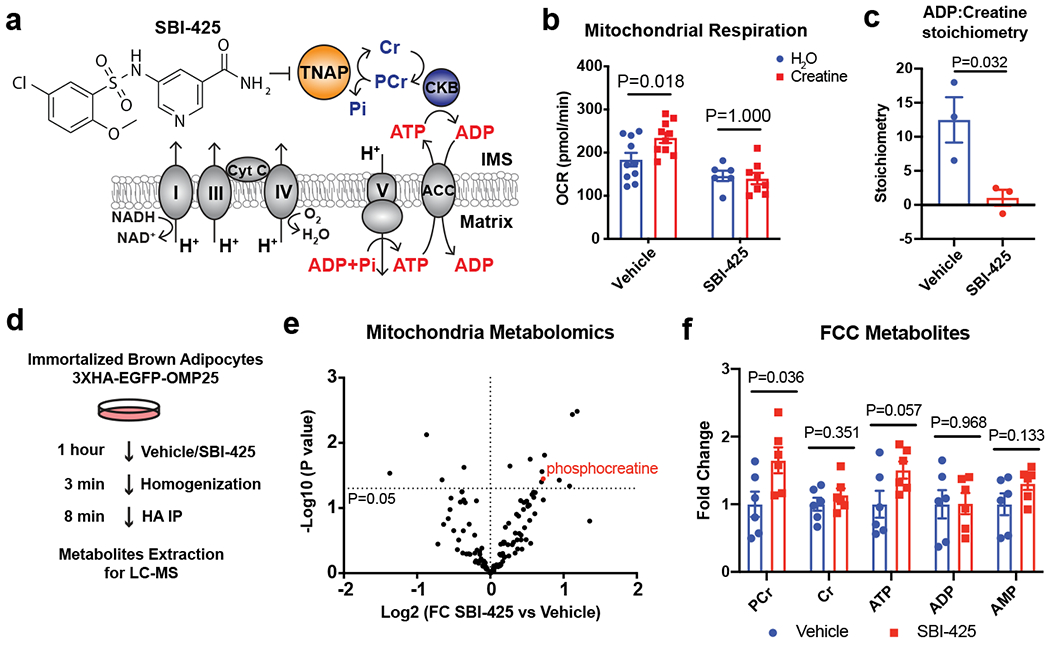
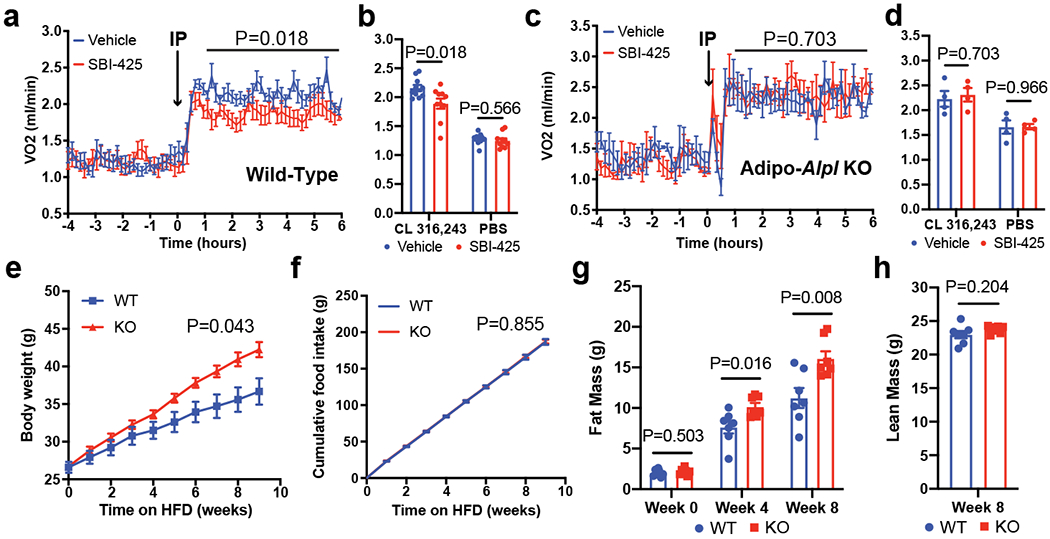
Adaptive thermogenesis has attracted much attention because of its ability to increase systemic energy expenditure and to counter obesity and diabetes1-3. Recent data have indicated that thermogenic fat cells use creatine to stimulate futile substrate cycling, dissipating chemical energy as heat4,5. This model was based on the super-stoichiometric relationship between the amount of creatine added to mitochondria and the quantity of oxygen consumed. Here we provide direct evidence for the molecular basis of this futile creatine cycling activity in mice. Thermogenic fat cells have robust phosphocreatine phosphatase activity, which is attributed to tissue-nonspecific alkaline phosphatase (TNAP). TNAP hydrolyses phosphocreatine to initiate a futile cycle of creatine dephosphorylation and phosphorylation. Unlike in other cells, TNAP in thermogenic fat cells is localized to the mitochondria, where futile creatine cycling occurs. TNAP expression is powerfully induced when mice are exposed to cold conditions, and its inhibition in isolated mitochondria leads to a loss of futile creatine cycling. In addition, genetic ablation of TNAP in adipocytes reduces whole-body energy expenditure and leads to rapid-onset obesity in mice, with no change in movement or feeding behaviour. These data illustrate the critical role of TNAP as a phosphocreatine phosphatase in the futile creatine cycle.


Conflict of interest statement

Competing Interests Statement

The authors declare no competing financial interests.

Figures

Extended Data Figure 1.
Extended Data Figure 1.. PCr’ase activities of thermogenic fat and TNAP.
(a) PCr’ase activities of total mitochondrial protein extracts from different tissues of cold-acclimated mice. BAT, interscapular brown adipose tissue; and iWAT, inguinal white adipose tissue. Mitochondrial protein extract was prepared from tissues excised from 10 mice for BAT or 20 mice for iWAT. Each reaction contains 10 mM of PCr and 0.4 mg/mL of mitochondrial protein extract, except the buffer control. Data are presented as the estimated parameters ± uncertainties. Uncertainties are represented by the standard errors of non-linear regression that fits a straight-line model to the initial linear phase of PCr hydrolysis kinetics measured by 31P NMR over 11 time points for BAT and iWAT and 6 time points for the buffer control (shown in Source Data). (b) Ion-exchange chromatography of the active fraction of SEC. The PCr’ase activity of each fraction was measured by enzyme-coupled assay. The activity of the most active fraction was also verified by 31P NMR. Red and blue bars denote the fractions used for isobaric labeling (TMT) and quantitative mass spectrometric analysis. (c) Western-blot analysis of the active SEC fraction prepared from cold-acclimated mice (Cold), compared with the equivalent fraction prepared from room-temperature housed mice (RT). (d) PCr’ase activities of total mitochondrial protein extracts from BAT of cold-acclimated mice treated with vehicle or SBI-425 (10 μM), measured by 31P NMR. n=2 technical replicates per group. Data are presented as means ± SEM. (e) Stacked traces of 31P NMR spectra recorded at indicated time points, demonstrating the kinetics of PCr hydrolysis catalyzed by recombinant TNAP. The minor peak marked with an asterisk on top is from glycerol-3-phosphate, a side-product of the phospho-transferase activity of TNAP, that transfers the phosphoryl-group from PCr to glycerol present in the reaction buffer. (f) Km curves of hydrolysis of PCr (left) and PPi (right) catalyzed by recombinant TNAP. Activities were measured by the enzyme-coupled assay; n=2 technical replicates. Data are presented as means ± SEM. (g) Comparison of the Michaelis-Menten parameters extrapolated from (f). Data are presented as the estimated parameters ± uncertainties. Uncertainties are represented by standard errors derived from the non-linear regression fit of Michaelis-Menten model to the data in (f).
Extended Data Figure 2.
Extended Data Figure 2.. Mitochondrial localization of ectopically expressed TNAP in non-thermogenic fat cell types.
Confocal fluorescence microscopic images showing subcellular localization of ectopically expressed TNAP in different cell types. PTEC stands for kidney proximal tubule epithelial cells. The insets show a zoomed-in region of the image outlined by a dotted box. Anti-TNAP and anti-HSP60 were used to visualize TNAP and mitochondria, respectively. Scale bar: 10 μm.
Extended Data Figure 3:
Extended Data Figure 3:. Mitochondrial localization of endogenous TNAP in BAT and non-thermogenic fat cells.
(a) Confocal fluorescence images showing subcellular localization of endogenous TNAP in brown adipocytes (upper and middle panels) and hepatocytes (lower panels). Primary brown preadipocytes were prepared from Alpl fl/fl mice, transduced with either AdGFP (WT) or AdCRE (ALPL KO) on day 4 of differentiation, and fixed for imaging on day 8. Arrows denote selected peri-nuclear areas of TNAP signal that colocalize with mitochondria signal. Antibodies for TNAP (Red) and HSP60 (Green) were used to visualize TNAP and mitochondria. Scale bar: 5 μm. (b) Pearson’s Correlation Coefficient (PCC) analysis showing the extent of colocalization of TNAP with mitochondria in indicated cell types; n=10 cells per group; data are presented as means ± SEM; statistical significance was calculated by one-way ANOVA with Bonferroni’s multiple comparisons test. (c) Western-blot analysis on TNAP in WT versus KO cells. Vinculin (VCL) blot was used as a sample preparation control. (d) Confocal fluorescence microscopic images showing subcellular localization of endogenous TNAP in different cell types. PTEC stands for kidney proximal tubule epithelial cells. Anti-TNAP and anti-HSP60 were used to visualize TNAP and mitochondria, respectively. Scale bar: 5 μm. (e) Western-blot analysis on TNAP and mitochondrial markers in mitochondria preparations from BAT of cold-acclimated, WT vs Adipo-Alpl KO mice. Blots were processed in parallel with samples derived from the same experiment. (f) Western-blot analysis of the insoluble fraction of mitochondria extract treated with Phospholipase-C, phosphatidylinositol-specific (PI-PLC), followed by ultracentrifugation, showing that PLC treatment releases TNAP from membranes. P: pellet; and S: supernatant. Mitochondria preparation was fragmented by sonication before treatment. Blots were processed in parallel with samples derived from the same experiment.
Extended Data Figure 4.
Extended Data Figure 4.. Proximity-based fluorescent labeling by TNAP-APEX2 and trypsin protection assay on mitochondria from BAT.
(a) Confocal fluorescence microscopic images of immortalized brown adipocytes showing colocalization of the GFP signal from 3XHA-EGFP-OMP25 construct (mGFP, channel: 488 nm) with different mitochondria markers. Endogenous antibodies, OxPhos (Upper red, channel: 561 nm) and HSP60 (Lower red, channel: 640 nm), were used to visualize mitochondria. The insets show a zoomed-in region of the image outlined by the dotted box. Scale bar: 5 μm. (b) Graphic illustration of how APEX2 reports subcellular localization of TNAP by its peroxidase activity. X stands for either Alexa Fluor 647 conjugated tyramide for confocal or 3,3’-Diaminobenzidine TEM studies. (c) Confocal fluorescence analysis of immortalized brown adipocytes (upper panels) and hepatocytes (lower panels) ectopically expressing a TNAP-APEX2 construct. Cells were fixed and treated with Alexa Fluor 647-Tyramide/H2O2 for proximity-based fluorescent labeling facilitated by the peroxidase activity of APEX2. Stably expressed 3XHA-EGFP-OMP25 was used as mitochondria reporter. Scale bar: 10 μm. (d) Western-blot analysis of the Trypsin protection assay on mitochondria derived from BAT of cold-acclimated mice. TOMM20, GPD2 (glycerol-3-phosphate dehydrogenase), Cyt C (cytochrome c) and CS (citrate synthase) are shown as markers of outer mitochondrial membrane (OMM), intermembrane space (IMS) and mitochondrial matrix. Blots were processed in parallel with samples derived from the same experiment. (e) Relative protein abundances in trypsin-digested mitochondria derived from band intensities of intact protein quantified from (d); n=2 technical replicates. Data are presented as means ± SEM.
Extended Data Figure 5.
Extended Data Figure 5.. Effect of Alpl silencing on cellular respiration.
(a) qRT-PCR of differentiated primary brown preadipocytes treated with shLacZ or shAlpl; n=3 biologically independent samples per group. (b) Western-blot analysis on TNAP in cells treated with shLacZ or shAlpl. Vinculin (VCL) blot was used as a sample processing control. (c) Effect of Alpl knockdown (adenoviral shAlpl) on OCR of primary brown adipocytes. Treatments to initiate different respiration states: Stimulated, norepinephrine; Uncoupled, oligomycin; Maximum, carbonyl cyanide m-chlorophenyl hydrazone; n=11 biologically independent samples for the shLacZ group and 18 biologically independent samples for the shAlpl group. Data are presented as means ± SEM. Statistical significance was calculated by unpaired Student’s two-sided t-test.
Extended Data Figure 6.
Extended Data Figure 6.. Effect of TNAP inhibition on the futile creatine cycle.
(a) Effect of SBI-425 treatment (10 μM) on oxygen consumption rate (OCR) of beige fat-derived mitochondria from WT vs Adipo-Alpl KO mice in the presence of 0.01 mM creatine and 0.1 mM ADP (limiting ADP) or 1 mM ADP (saturating ADP), as measured by a Seahorse XF24 Extracellular Flux Analyzer; n=7 independent measurements per group. (b) Effect of SBI-425 treatment (10 μM) on oxygen consumption rate (OCR) of beige fat-derived mitochondria in the presence of 0.1 mM ADP (limiting ADP) or 1 mM ADP (saturating ADP), but in the absence of creatine, as measured by a Seahorse XF24 Extracellular Flux Analyzer; n=6 independent measurements per group. Data are presented as means ± SEM. Statistical significance was calculated by either two-way ANOVA with Bonferroni’s multiple comparisons test (a) or unpaired Student’s two-sided t-test (b).
Extended Data Figure 7.
Extended Data Figure 7.. Rapid mitochondria purification enriched mitochondrial metabolites and proteins.
(a) Relative abundances of citric acid cycle intermediates in mitochondria vs whole-cell metabolomics; n=6 biologically independent samples. Data are presented as means ± SEM. (b) Western-blot analysis on mitochondrial markers in immunoprecipitated mitochondria for metabolomics study. OMM: outer mitochondrial membrane; IMM: inner mitochondrial membrane. Blots were processed in parallel with samples derived from the same experiment.
Extended Data Figure 8.
Extended Data Figure 8.. Movement and food intake of mice upon SBI-425 treatment.
(a and b) Cumulative movement and food intake of wild-type (a) and Adipo-Alpl KO mice (b) for 24 hours after treatment of SBI-425 versus vehicle; n=10 mice for wild-type and 4 mice for Adipo-Alpl KO. Data are presented as means ± SEM. Statistical significance was calculated by unpaired Student’s two-sided t-test.
Extended Data Figure 9.
Extended Data Figure 9.. Energy expenditure and movement of wild-type versus Adipo-Alpl KO mice upon HFD.
(a) Indirect calorimetric measurement on wild-type vs Adipo-Alpl KO mice that had been on HFD for 4 weeks at 22 °C; n=7 mice for wild-type and 6 mice for Adipo-Alpl KO; the grey area indicates the dark period. (b) Averaged respiration rates over 24 hours as measured in (a); n=7 mice for wild-type and 6 mice for Adipo-Alpl KO. (c) Cumulative movement of mice over 24 hours; n=7 mice for wild-type and 6 mice for Adipo-Alpl KO. Data are presented as means ± SEM. Statistical significance was calculated by either two-way ANOVA (a) or unpaired Student’s two-sided t-test (b and c).
Extended Data Figure 10.
Extended Data Figure 10.. Compensatory thermogenesis in Adipo-Alpl KO mice.
(a) Indirect calorimetric measurement on wild-type versus Adipo-Alpl KO mice kept in metabolic cages at 22 °C, showing stimulation of mice respiration by CL 316,243 administration (1.0 mg/kg). Arrow denotes the time point of drug administration; n=12 mice for wild-type and 9 mice for Adipo-Alpl KO; all mice were pre-treated with CL 316,243 (1.0 mg/kg/day) for 5 days. (b) Western-blot analysis of BAT and iWAT from wild-type or Adipo-Alpl KO mice pre-treated with CL 316,243 (1.0 mg/kg/day) for 5 days. (c and d) Gene set enrichment plot of quantitative mass spectrometric analyses of BAT (c) and iWAT (d) from wild-type or Adipo-Alpl KO mice treated with CL 316,243 (1.0 mg/kg/day) for 5 days; n = 4 mice for wild-type and 6 mice for Adipo-Alpl KO. Enrichment analysis was performed with GSEA 4.1.0,. The hallmark gene sets were surveyed, and oxidative phosphorylation is the top hit for both BAT and iWAT. Family-wise error rate (FWER) p-value was presented for statistical significance (number of permutations=1000) and NES stands for normalized enrichment score (enrichment statistics = “classic”). (e and f) qRT-PCR of BAT (e) and iWAT (f) from wild-type vs Adipo-Alpl KO mice treated with CL 316,243 (1.0 mg/kg/day) for 5 days; n=4 mice for wild-type and 6 mice for Adipo-Alpl KO. Data are presented as means ± SEM. Statistical significance was calculated by either two-way ANOVA (a) or unpaired Student’s two-sided t-test (e and f).
Figure 1.
Figure 1.. Isolation and identification of TNAP as a cold-inducible PCr’ase from mitochondria of thermogenic fat.
(a) Chemical equation for hydrolysis reaction of phosphocreatine, with phosphorus-containing chemical species indicated on top. PCr: phosphocreatine; and Pi: inorganic phosphate. (b) Stacked 1-dimensional traces of 31P NMR frequency-domain spectra showing the occurrence of hydrolysis reaction of phosphocreatine with addition of mitochondrial protein extract (1.0 mg/ml) from brown adipose tissue (BAT) of cold-acclimated mice in 6 hours. All activities shown in rest of the figure were measured by 31P NMR, if not otherwise indicated. (c) Scheme of isolation and identification of PCr phosphatase(s) from sucrose-gradient purified mitochondria preparation from murine tissues. (d) PCr phosphatase activities of different fractions of size-exclusion chromatography. Error bars represent the standard errors of non-linear regression that fits a straight-line model to the initial linear phase of PCr hydrolysis kinetics measured by 31P NMR over 4 time points (shown in Source Data). (e) List of top 10 proteins enriched in the active fraction versus a nearby less active fraction of IEX. TNAP (gene name: Alpl) is highlighted in grey. (f) UCP1-TRAP (Translating Ribosome Affinity Purification) data showing the cold-sensitivity of Alpl expression in brown and beige adipocytes. Data were adapted from Roh, H. C. et al. and normalized with DESeq241; and are presented as means ± SEM; n=5 for cold and warm brown, 4 for cold beige, and 3 for warm beige (all are biologically independent samples).
Figure 2.
Figure 2.. TNAP targets mitochondria in brown adipocytes.
(a) Confocal fluorescence images showing subcellular localization of ectopically expressed TNAP in immortalized brown adipocytes and primary hepatocytes. The insets show an enlarged region of the image outlined by the dotted box. Arrows denote selected signals of TNAP that colocalize with mitochondria signal. Anti-TNAP (Red) and anti-HSP60 (Green) were used to visualize TNAP and mitochondria, respectively. Scale bar: 10 μm. (b) Transmission electron microscope images showing the detailed localization of TNAP-APEX2 in primary mature brown adipocytes. Arrows denote the structures of mitochondrial inner membrane.
Figure 3.
Figure 3.. Ablation of TNAP activity abolishes the futile creatine cycle by hydrolysis of phosphocreatine.
(a) Model of inhibition of FCC by the TNAP-selective inhibitor, SBI-425. (b) Effect of SBI-425 treatment (10 μM) on creatine-dependent stimulation of oxygen consumption rate (OCR) of beige fat-derived mitochondria in the presence of 0.1 mM ADP, as measured by a Seahorse XF24 Extracellular Flux Analyzer; n=10 independent measurements for the vehicle group, 6 independent measurements for the SBI-425 group supplemented with H2O, and 8 independent measurements for the SBI-425 group supplemented with creatine. (c) Calculated ADP:creatine stoichiometry based on the mitochondrial oxygen consumption during futile creatine cycle in presence of 0.01 mM creatine and 0.1 mM ADP, as measured by a Clark-type oxygen electrode; n=3 biologically independent samples per group. (d) Experimental scheme of rapid mitochondrial metabolites extraction from immortalized brown adipocytes for metabolomics profiling. (e) Volcano plot of mitochondrial metabolites of cells treated with SBI-425 (10 μM) vs Vehicle. (f) Changes in mitochondrial levels of major metabolites involved in futile creatine cycle upon SBI-425 treatment; n=6 biologically independent samples. Data are presented as means ± SEM. Statistical significance was calculated by either two-way ANOVA with Bonferroni’s multiple comparisons test (b) or unpaired Student’s two-sided t-test (c, e, and f).
Figure 4.
Figure 4.. Ablation of TNAP in fat represses adaptive thermogenesis and stimulates obesity.
(a) Indirect calorimetric measurement on wild-type mice kept in metabolic cages at 22 °C, showing effect of SBI-425 administration (25 mg/kg/day) on CL 316,243 (1.0 mg/kg/day) stimulated respiration. Arrow denotes the time point of drug administration; n=10 mice per group; all mice were pre-treated with CL 316,243 (1.0 mg/kg/day) for 5 days before SBI-425 administration. (b) Averaged respiration rates measured in (a) over the time span from 1-hour to 6-hour after drug administration along with the administration of either CL 316,243 or PBS; n=10 mice per group. (c) Indirect calorimetric measurement on Adipo-Alpl KO mice kept in metabolic cages at 22 °C, showing effect of SBI-425 administration (25 mg/kg/day) on CL 316,243 (1.0 mg/kg/day) stimulated respiration. Arrow denotes the time point of drug administration; n=4 mice per group; all mice were pre-treated with CL 316,243 (1.0 mg/kg/day) for 5 days before SBI-425 administration. (d) Averaged respiration rates measured in (c) over the time span from 1-hour to 6-hour after drug administration along with the administration of either CL 316,243 or PBS; n=4 mice per group. (e-h) Body mass (e), cumulative food intake (f), fat mass (g) and lean mass (h) of Adipo-Alpl KO mice and their littermate controls over high-fat feeding at 22 °C; n=7 mice per group. Data are presented as means ± SEM. Statistical significance was calculated by either two-way ANOVA (a, c, e, and f) or unpaired Student’s two-sided t-test (b, d, g, and h).

Comment in

References

    1. Rosen ED & Spiegelman BM What we talk about when we talk about fat. Cell 156, 20–44, doi:10.1016/j.cell.2013.12.012 (2014). - DOI - PMC - PubMed
    1. Harms M & Seale P Brown and beige fat: development, function and therapeutic potential. Nat Med 19, 1252–1263, doi:10.1038/nm.3361 (2013). - DOI - PubMed
    1. Carobbio S, Guénantin AC, Samuelson I, Bahri M & Vidal-Puig A Brown and beige fat: From molecules to physiology and pathophysiology. Biochim Biophys Acta Mol Cell Biol Lipids 1864, 37–50, doi:10.1016/j.bbalip.2018.05.013 (2019). - DOI - PubMed
    1. Chouchani ET, Kazak L & Spiegelman BM New Advances in Adaptive Thermogenesis: UCP1 and Beyond. Cell Metab 29, 27–37, doi:10.1016/j.cmet.2018.11.002 (2019). - DOI - PubMed
    1. Kazak L et al. A creatine-driven substrate cycle enhances energy expenditure and thermogenesis in beige fat. Cell 163, 643–655, doi:10.1016/j.cell.2015.09.035 (2015). - DOI - PMC - PubMed

Publication types