. 2021 Apr 26:15:665480.
doi: 10.3389/fnins.2021.665480. eCollection 2021.

Velocity and Pulsatility Measures in the Perforating Arteries of the Basal Ganglia at 3T MRI in Reference to 7T MRI

Affiliations

Velocity and Pulsatility Measures in the Perforating Arteries of the Basal Ganglia at 3T MRI in Reference to 7T MRI

Tine Arts et al. Front Neurosci. .

Abstract

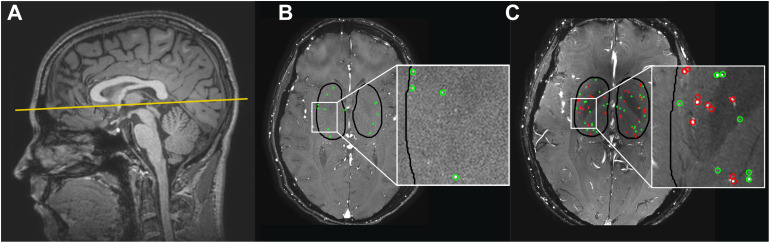
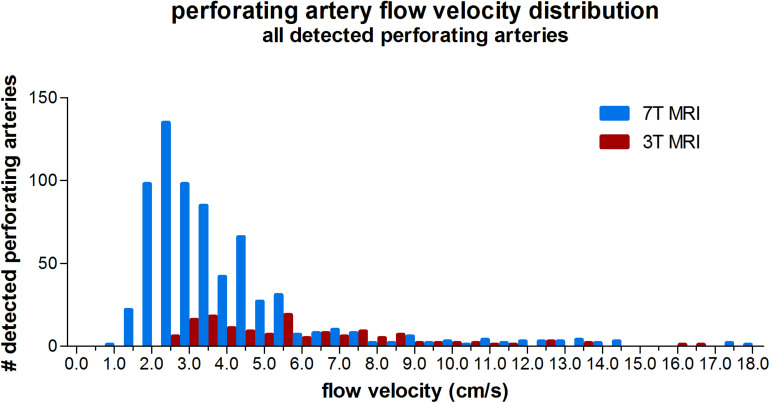
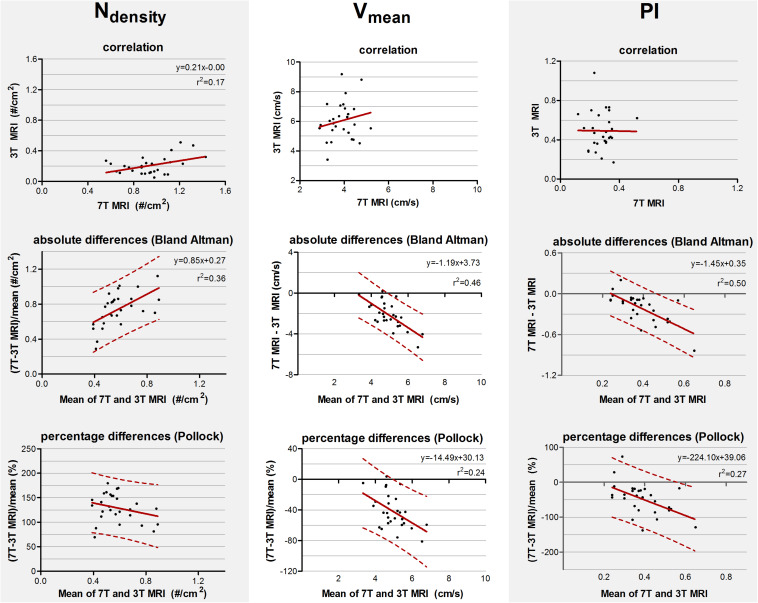
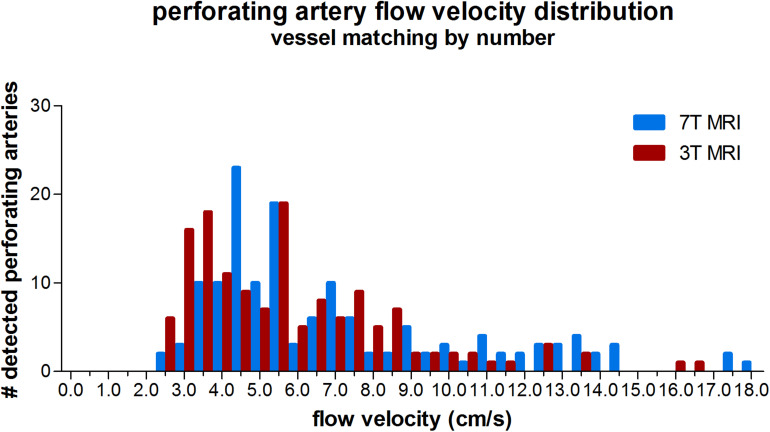
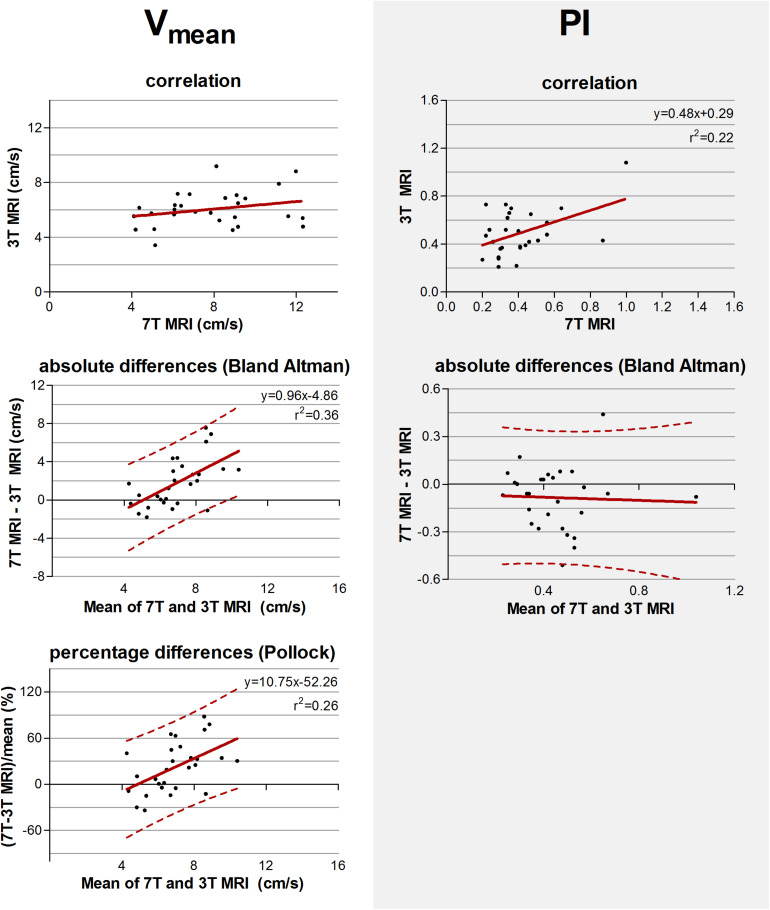
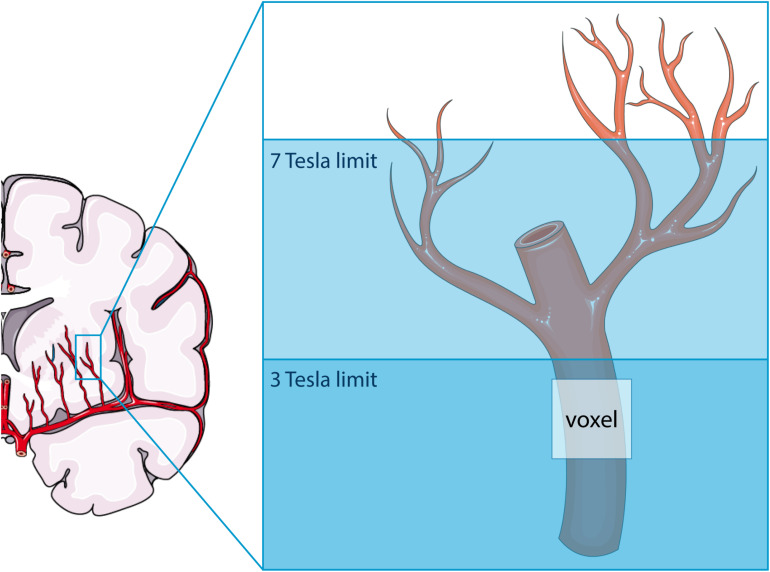
Cerebral perforating artery flow velocity and pulsatility can be measured using 7 tesla (T) MRI. Enabling these flow metrics on more widely available 3T systems would make them more employable. It is currently unknown whether these measurements can be performed at 3T MRI due to the lower signal-to-noise ratio (SNR). Therefore, the aim of this study is to investigate if flow velocity and pulsatility in the perforating arteries of the basal ganglia (BG) can be measured at 3T MRI and assess the agreement with 7T MRI measurements as reference. Twenty-nine subjects were included, of which 14 patients with aortic coarctation [median age 29 years (21-72)] and 15 controls [median age 27 years (22-64)]. Using a cardiac-gated 2D phase-contrast MRI sequence BG perforating arteries were imaged at 3T and 7T MRI and perforating artery density (N density , #/cm2), flow velocity (V mean , cm/s) and pulsatility index (PI) were determined. Agreement between scanner modalities was assessed using correlation and difference plots with linear regression. A p-value ≤ 0.05 indicated statistical significance. It was shown that perforating artery flow velocity and pulsatility can be measured at 3T MRI (N density = 0.21 ± 0.11; V mean = 6.04 ± 1.27; PI = 0.49 ± 0.19), although values differed from 7T MRI measurements (N density = 0.95 ± 0.21; V mean = 3.89 ± 0.56; PI = 0.28 ± 0.08). The number of detected arteries was lower at 3T (5 ± 3) than 7T MRI (24 ± 6), indicating that 3T MRI is on average a factor 4.8 less sensitive to detect cerebral perforating arteries. Comparison with 7T MRI as reference showed some agreement in N density , but little to no agreement for V mean and PI. Equalizing the modalities' sensitivity by comparing the detected arteries on 7T MRI with the highest velocity with all vessels detected on 3T MRI, showed some improvement in agreement for PI, but not for V mean . This study shows that it is possible to measure cerebral perforating artery flow velocity and pulsatility at 3T MRI, although an approximately fivefold sample size is needed at 3T relative to 7T MRI for a given effect size, and the measurements should be performed with equal scanner field strength and protocol.

Keywords: 3 tesla MRI; 7 tesla MRI; flow velocity; perforating arteries; velocity pulsatility.


Conflict of interest statement

The authors declare that the research was conducted in the absence of any commercial or financial relationships that could be construed as a potential conflict of interest.

Figures

FIGURE 1
FIGURE 1
(A) The 2D phase contrast slice in the basal ganglia (BG) is located at the bottom of the corpus callosum (solid line). (B,C) Cerebral perforating arteries detected in the BG with 3 tesla (T) MRI (B) and 7T MRI (C) and included in the analysis are circled in green. Cerebral perforating arteries excluded from analysis due to a non-perpendicular orientation or close proximity to other perforating arteries (<1.2 mm) are circled in red. Note that for this subject all detected vessels at 3T were sufficient for inclusion. Also note the inhomogeneity in the background suppression at 7T (darker central area), which is induced by the well-known inhomogeneity of the radiofrequency B1+ transmit field (resulting in spatially varying flip angle) at 7T MRI (Van De Moortele et al., 2005).
FIGURE 2
FIGURE 2
Histogram showing the velocity distribution of all detected perforating arteries on 3 tesla and 7 tesla MRI of all subjects.
FIGURE 3
FIGURE 3
Top row: Correlation plots of the number of detected perforating arteries/cm2 (Ndensity), the mean blood flow velocity (Vmean) and pulsatility (PI) measured at 3 tesla (T) and 7T MRI. The line resulting from linear regression is given by the solid line. In case of a significant correlation the equation of the regression line is given. Middle and bottom row: difference plots in absolute units (Bland Altman) and in percentage units (Pollock), respectively, for Ndensity, Vmean, and PI. The regression line (i.e., bias) (solid line) and the limits of agreement (dotted lines) are shown. In case of a significant linear regression, the equation of the regression line is presented.
FIGURE 4
FIGURE 4
Histogram showing the velocity distribution of all detected vessels of 3 tesla (T) MRI vs. 7T MRI, where for 7T for each individual only the N vessels with highest velocities were taken (N refers to the number of vessels detected on 3T MRI for a given subject), in order to equalize the sensitivity to detect cerebral perforating arteries for both modalities.
FIGURE 5
FIGURE 5
Top row: Correlation plots of the mean blood flow velocity (Vmean) and pulsatility index (PI) determined of all detected perforating arteries at 3 tesla (T) and of the detected perforating arteries with highest velocities at 7T MRI. The line resulting from linear regression is given by the solid line. In case of a significant correlation the equation of the regression line is given. Middle and bottom row: difference plots in absolute units (Bland Altman) and in percentage units (Pollock), respectively, for Vmean and PI. The regression line (i.e., bias) (solid line) and the limits of agreement (dotted lines) are shown. In case of a significant linear correlation, the equation of the regression line is presented. If proportional bias is absent in the Bland Altman plot, no Pollock plot is shown.
FIGURE 6
FIGURE 6
Schematic representation of the difference in sensitivity between 3 tesla (T) and 7T MRI for assessing flow and pulsatility in the perforating arteries in the basal ganglia. Both modalities can only detect the proverbial tip of the iceberg, albeit that this tip is larger at 7T than at 3T MRI. The voxel shown indicates the presence of partial volume effects, which are thus different between 3T and 7T MRI due to the difference in the proverbial tip of the iceberg. This image was created using Servier Medical Art templates, which are licensed under a Creative Commons Attribution 3.0 Unported License; https://smart.servier.com.

References

    1. Arts T., Siero J. C. W., Biessels G. J., Zwanenburg J. J. M. (2021). Automated assessment of cerebral arterial perforator function on 7T MRI. J. Magn. Reson. Imaging 53 234–241. 10.1002/jmri.27304 - DOI - PMC - PubMed
    1. Bland M. J., Altman G. (1995). Comparing methods of measurement: why plotting difference against standard method is misleading. Lancet 346 1085–1087. 10.1016/s0140-6736(95)91748-9 - DOI - PubMed
    1. Bouvy W. H., Geurts L. J., Kuijf H. J., Luijten P. R., Kappelle L. J., Biessels G. J., et al. (2016). Assessment of blood flow velocity and pulsatility in cerebral perforating arteries with 7-T quantitative flow MRI. NMR Biomed. 29 1295–1304. 10.1002/nbm.3306 - DOI - PMC - PubMed
    1. Geurts L., Biessels G. J., Luijten P., Zwanenburg J. (2018). Better and faster velocity pulsatility assessment in cerebral white matter perforating arteries with 7T quantitative flow MRI through improved slice profile, acquisition scheme, and postprocessing. Magn. Reson. Med. 79 1473–1482. 10.1002/mrm.26821 - DOI - PMC - PubMed
    1. Geurts L. J., Bhogal A. A., Siero J. C. W., Luijten P. R., Biessels G. J., Zwanenburg J. J. M. (2018). Vascular reactivity in small cerebral perforating arteries with 7 T phase contrast MRI – A proof of concept study. Neuroimage 172 470–477. 10.1016/j.neuroimage.2018.01.055 - DOI - PMC - PubMed