. 2021 Feb 6;5(3):pkab015.
doi: 10.1093/jncics/pkab015. eCollection 2021 Jun.

Relation of Quantitative Histologic and Radiologic Breast Tissue Composition Metrics With Invasive Breast Cancer Risk

Affiliations

Relation of Quantitative Histologic and Radiologic Breast Tissue Composition Metrics With Invasive Breast Cancer Risk

Mustapha Abubakar et al. JNCI Cancer Spectr. .

Abstract

Background: Benign breast disease (BBD) is a strong breast cancer risk factor, but identifying patients that might develop invasive breast cancer remains a challenge.

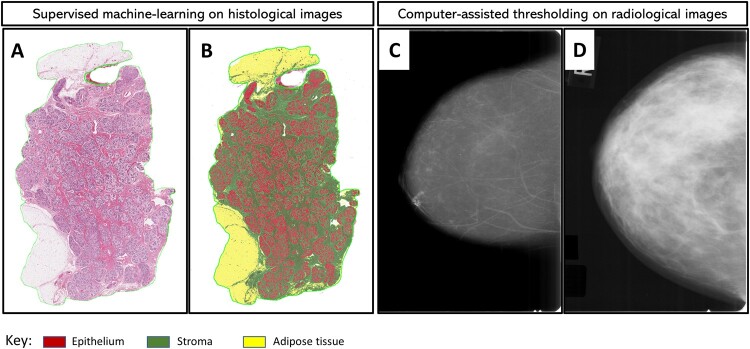
Methods: By applying machine-learning to digitized hematoxylin and eosin-stained biopsies and computer-assisted thresholding to mammograms obtained circa BBD diagnosis, we generated quantitative tissue composition metrics and determined their association with future invasive breast cancer diagnosis. Archival breast biopsies and mammograms were obtained for women (18-86 years of age) in a case-control study, nested within a cohort of 15 395 BBD patients from Kaiser Permanente Northwest (1970-2012), followed through mid-2015. Patients who developed incident invasive breast cancer (ie, cases; n = 514) and those who did not (ie, controls; n = 514) were matched on BBD diagnosis age and plan membership duration. All statistical tests were 2-sided.

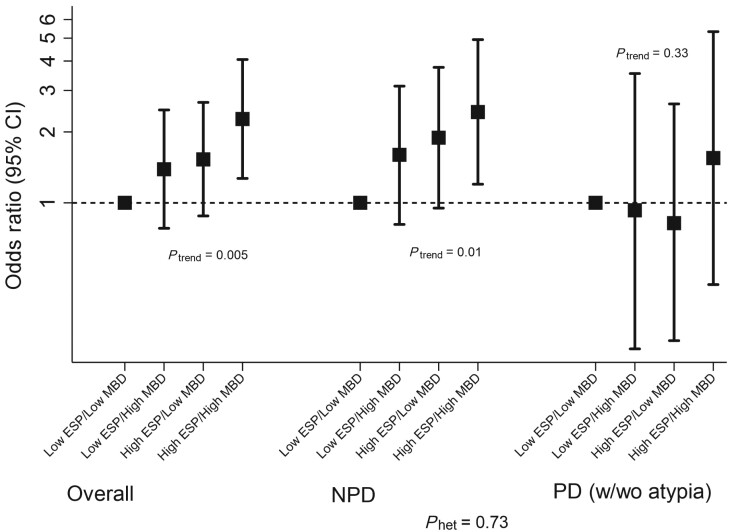
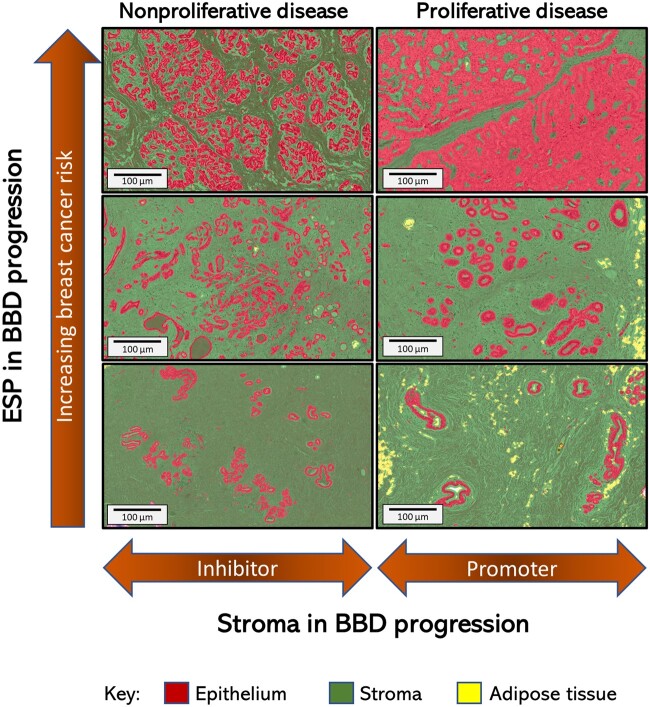
Results: Increasing epithelial area on the BBD biopsy was associated with increasing breast cancer risk (odds ratio [OR]Q4 vs Q1 = 1.85, 95% confidence interval [CI] = 1.13 to 3.04; P trend = .02). Conversely, increasing stroma was associated with decreased risk in nonproliferative, but not proliferative, BBD (P heterogeneity = .002). Increasing epithelium-to-stroma proportion (ORQ4 vs Q1 = 2.06, 95% CI =1.28 to 3.33; P trend = .002) and percent mammographic density (MBD) (ORQ4 vs Q1 = 2.20, 95% CI = 1.20 to 4.03; P trend = .01) were independently and strongly predictive of increased breast cancer risk. In combination, women with high epithelium-to-stroma proportion and high MBD had substantially higher risk than those with low epithelium-to-stroma proportion and low MBD (OR = 2.27, 95% CI = 1.27 to 4.06; P trend = .005), particularly among women with nonproliferative (P trend = .01) vs proliferative (P trend = .33) BBD.

Conclusion: Among BBD patients, increasing epithelium-to-stroma proportion on BBD biopsies and percent MBD at BBD diagnosis were independently and jointly associated with increasing breast cancer risk. These findings were particularly striking for women with nonproliferative disease (comprising approximately 70% of all BBD patients), for whom relevant predictive biomarkers are lacking.


Figures

Figure 1.
Figure 1.
Quantitative assessment of breast tissue composition metrics from digitized histological and radiological images. Supervised machine-learning and computer-assisted thresholding methods were applied to histologic (A and B) and radiologic (C and D) images from women with benign breast disease (BBD), respectively. Diagnostic hematoxylin and eosin (H&E)–stained slides were digitized for image analysis, and mammograms performed around the time of BBD diagnosis (average 1.3 months) were retrieved and digitized for analysis. H&E image analysis was performed using the commercially available Halo version 1.2 Tissue Classifier algorithm (Indica Labs, Albuquerque, NM), which is a random forest algorithm that is specifically designed for the identification and classification of tissue types based on color, texture, and other contextual features. For training purposes, a representative H&E image was randomly selected, and the machine was trained to identify areas of epithelium (red), stroma (green), and adipose tissue (yellow). Panel A is an example of an H&E image before analysis. In panel B, the machine learns by example to accurately classify and quantify epithelial (red), stromal (green), and adipose tissue (yellow) areas. Panels C and D are examples of representative mammograms that were determined to have low (below the median distribution among controls) and high (above the median) percent mammographic breast density based on quantitative assessment using the Cumulus software interface.
Figure 2.
Figure 2.
Histologic and radiologic breast tissue composition metrics by age and case-control status. Locally weighted scatter plot smoothing of log residuals (y-axes) from linear regression models of nondense area (A), dense area (B), percent mammographic breast density (C), epithelium (D), stroma (E), and epithelium-to-stroma proportion (F). The effects of body mass index and benign breast disease histology on breast tissue composition were accounted for by adjusting for these in the linear regression models and plotting the log residuals against age.
Figure 3.
Figure 3.
Joint associations of histologic epithelium-to-stroma proportion (histologic-ESP) and mammographic breast density (MBD) and risk of subsequent breast cancer development among women with benign breast disease (BBD). Histologic-ESP and percent MBD were dichotomized at their median values among controls (ie, 18.2% and 28.4%, respectively). Unconditional logistic regression models were adjusted for age at menarche, parity and age at first live birth, body mass index, menopausal status and menopausal hormone therapy use, bilateral oophorectomy, history of breast cancer in a first-degree relative, BBD histology, extent of lobular involution, and calendar year of BBD diagnosis, as well as matching factors (age at BBD diagnosis and follow-up time from BBD to cancer). Analyses were performed overall (controls/cases, n = 284/280) and among BBD patients with nonproliferative disease (NPD; controls/cases, n = 204/161) and (C) proliferative disease (PD; with (w)/without(wo) atypia); controls/cases, n = 80/119). Detailed odds ratios and related estimates are presented in Table 4. P values for trend (Ptrend) were assessed by modeling the joint ESP-MBD variable as continuous in the multivariable model. P value for heterogeneity (Phet) was obtained by including a multiplicative interaction term between the joint ESP-MBD variable and BBD histology in the overall, fully adjusted, model. All tests were 2-sided. CI = confidence interval.
Figure 4.
Figure 4.
Conceptual model of benign breast disease (BBD) to breast cancer progression incorporating the contributions of histologic changes in epithelium, stroma, and epithelium-to-stroma proportion (ESP) to breast cancer risk. Increasing ESP is displayed vertically, from bottom to top, to correspond to observed association with increasing risk of subsequent breast cancer development in this study (Table 2). The context-dependent role of the stroma to either inhibit or promote tumor formation in the setting of nonproliferative or proliferative disease (Table 2), respectively, is displayed horizontally. In this conceptual model of BBD to breast cancer progression, we propose that the proportion of the epithelial and stromal components of the breast is in a delicate balance during normal homeostasis. Disruption of this balance, either through uncontrolled epithelial proliferation arising from endogenous and/or exogenous factors, lack of age-related epithelial involution, or via exogeneous and/or endogenous causes of stromal depletion, will manifest as increasing histologic-ESP (Supplementary Table 7, available online). High histologic-ESP may, in turn, represent a feature of the breast microenvironment that is conducive to carcinogenesis.

References

    1. Silverstein M. Where’s the outrage? J Am Coll Surg. 2009;208(1):78–79. - PubMed
    1. Gutwein LG, Ang DN, Liu H, et al.Utilization of minimally invasive breast biopsy for the evaluation of suspicious breast lesions. Am J Surg. 2011;202(2):127–132. - PubMed
    1. Dupont WD, Page DL.. Risk factors for breast cancer in women with proliferative breast disease. N Engl J Med. 1985;312(3):146–151. - PubMed
    1. Hartmann LC, Sellers TA, Frost MH, et al.Benign breast disease and the risk of breast cancer. N Engl J Med. 2005;353(3):229–237. - PubMed
    1. Santen RJ, Mansel R.. Benign breast disorders. N Engl J Med. 2005;353(3):275–285. - PubMed

Publication types

MeSH terms

LinkOut - more resources