. 2021 Apr 1;24(4):102386.
doi: 10.1016/j.isci.2021.102386. eCollection 2021 Apr 23.

EEG alterations during wake and sleep in mild cognitive impairment and Alzheimer's disease

Affiliations

EEG alterations during wake and sleep in mild cognitive impairment and Alzheimer's disease

Aurora D'Atri et al. iScience. .

Abstract

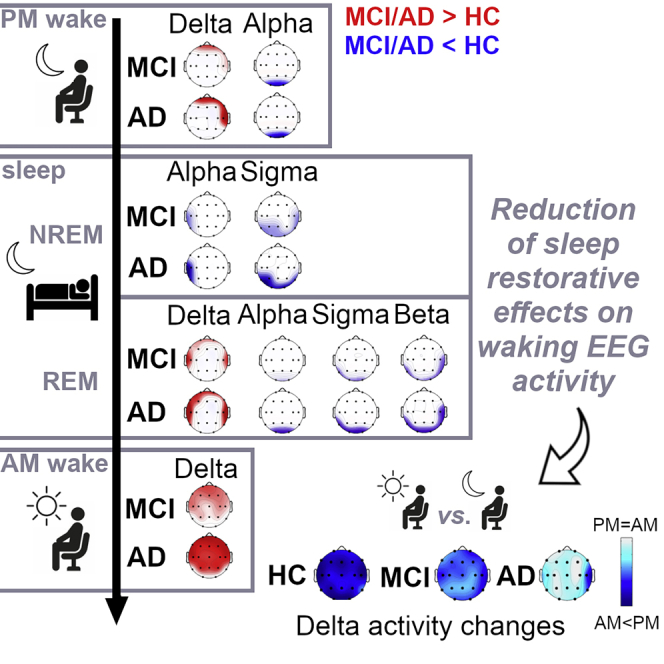
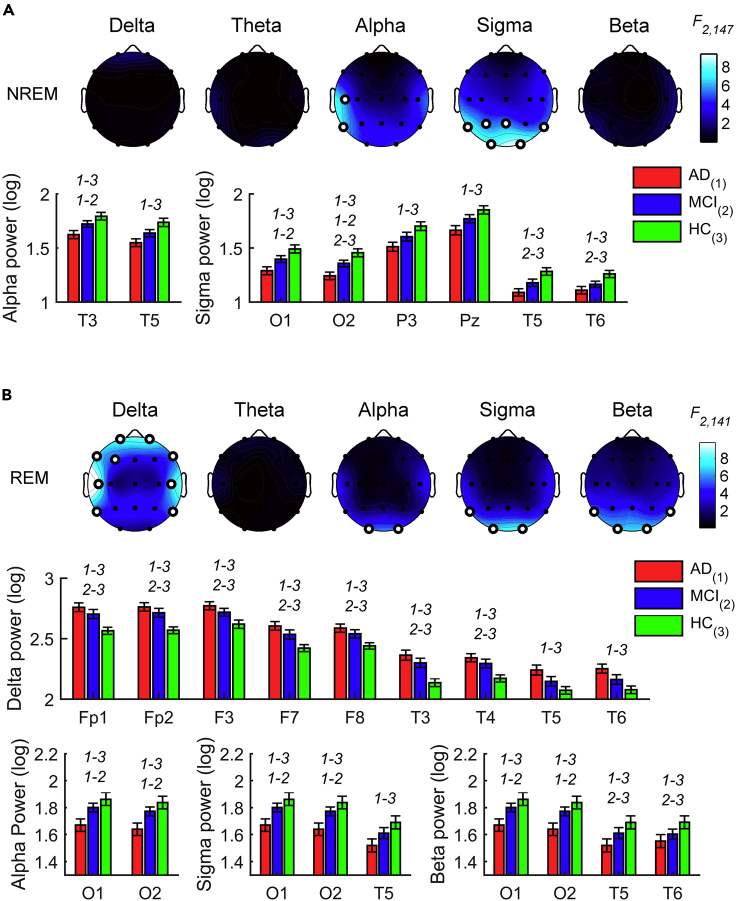
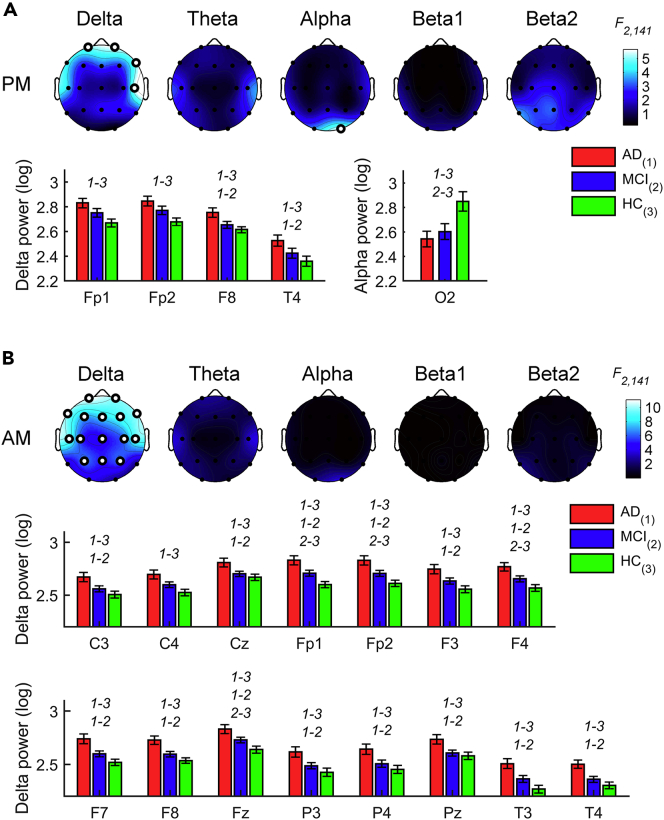
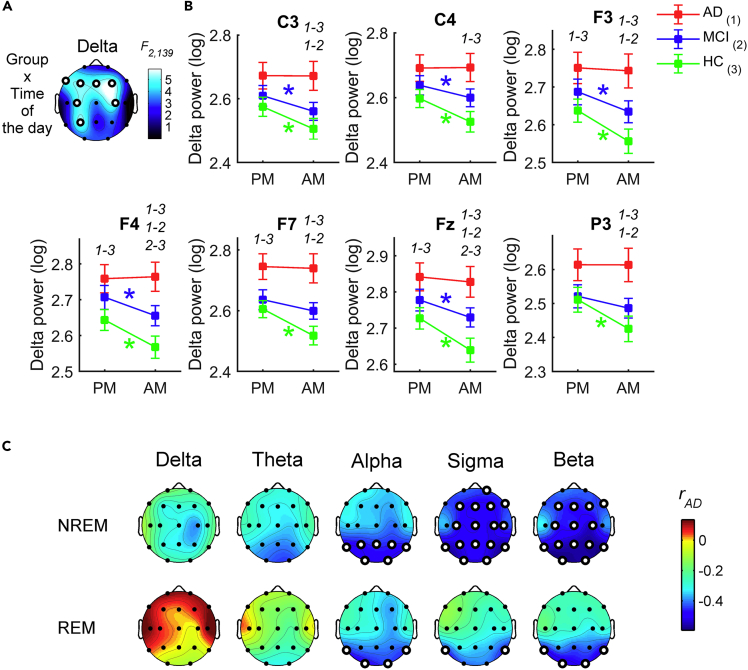
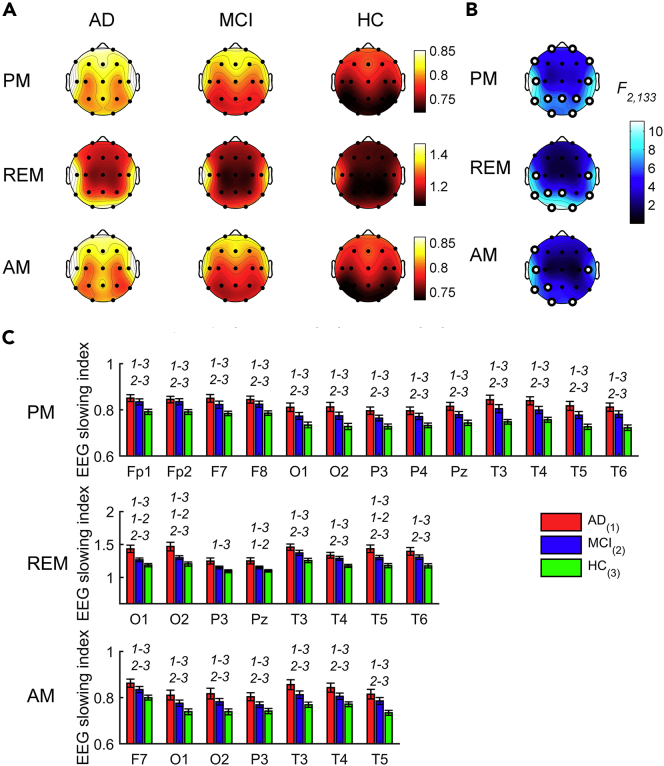
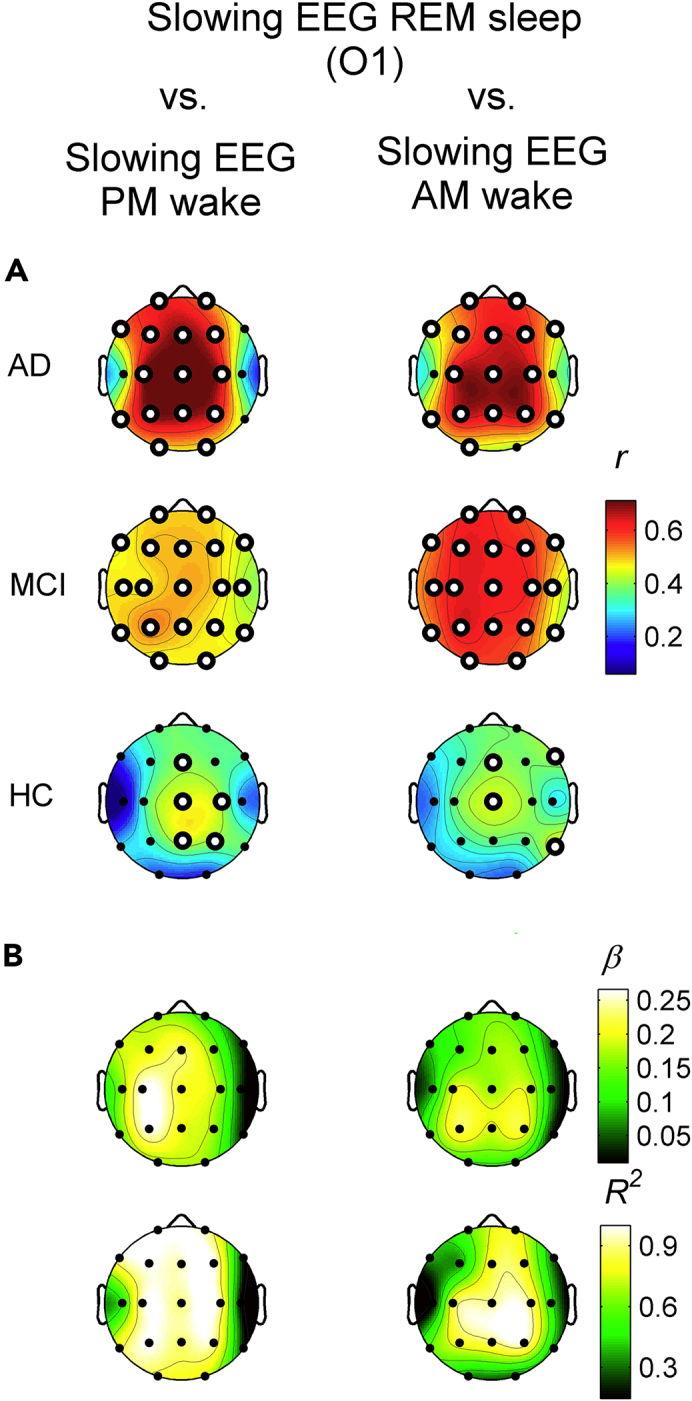
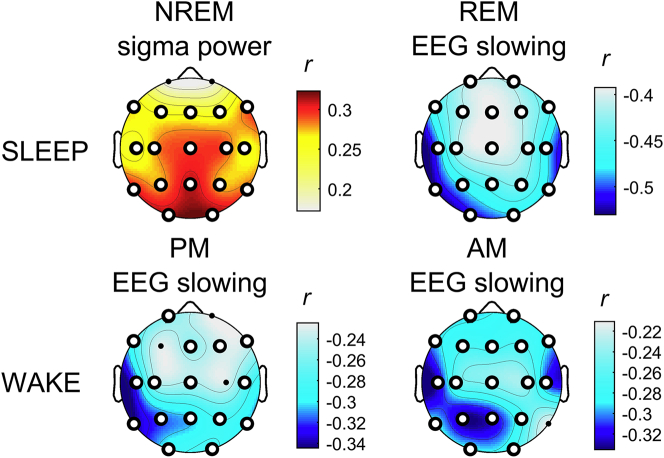
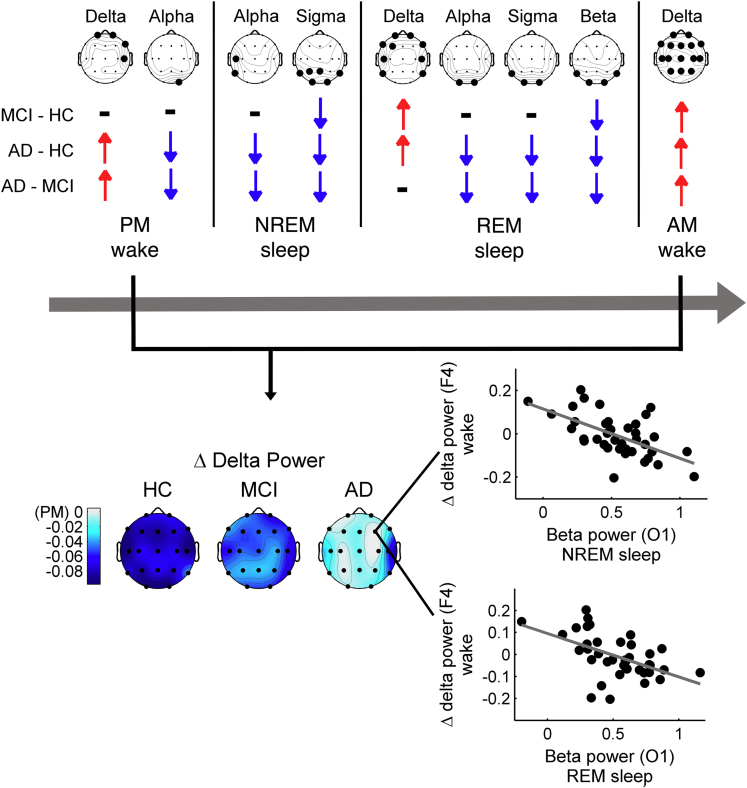
Patients with Alzheimer's disease (AD) undergo a slowing of waking electroencephalographic (EEG) rhythms since prodromal stages, which could be ascribed to poor sleep quality. We examined the relationship between wake and sleep alterations by assessing EEG activity during sleep and (pre-sleep/post-sleep) wakefulness in AD, mild cognitive impairment (MCI) and healthy controls. AD and MCI show high sleep latency and less slow-wave sleep. Reduced sigma activity characterizes non-rapid eye movement (NREM) sleep, reflecting sleep spindles loss. The EEG slowing characterizes REM sleep and wakefulness of AD and MCI, with strong correlations among the two phenomena suggesting common neuropathological mechanisms. Evening-to-morning variations in waking EEG revealed the gradual disappearance in MCI and AD of overnight changes in delta activity, indicating a progressive decay of sleep restorative functions on diurnal activity that correlates with the impairment of sleep high-frequency activity in AD. Our findings support a linkage between wake and sleep alterations, and the importance of sleep-related processes in Alzheimer's disease progression.

Keywords: Chronobiology; Cognitive Neuroscience; Human Physiology.


Conflict of interest statement

The authors declare no competing interests.

Figures

None
Graphical abstract
Figure 1
Figure 1
Sleep EEG alterations in AD, MCI, and HC groups Statistical maps (F-values) of the one-way ANOVAs (AD vs. MCI vs. HC) on the spectral powers during NREM (A) and REM (B) sleep and histograms of spectral power (mean ± SEM) in AD (red), MCI (blue) and HC (green) groups at the cortical sites and frequency bands showing a significant between-groups difference in the one-way ANOVAs. Maps are scaled between minimal and maximal F-values across the statistical comparisons in all frequency bands. White dots represent significant statistical differences, according to the FDR correction (p ≤ 0.0102). y axis of histograms has non-zero origin to magnify standard errors visibility. The groups with significant differences in the post hoc pairwise comparisons by two-tailed unpaired t test (p ≤ 0.05) are reported by numerical code (1: AD, 2: MCI, 3: HC). See also Figure S1 and Table S1.
Figure 2
Figure 2
EEG alterations during evening and morning wakefulness in AD, MCI, and HC groups Statistical maps (F-values) of the one-way ANOVAs (AD vs. MCI vs. HC) on the spectral powers during evening (A) and morning (B) wakefulness and histograms of spectral power (mean ± SEM) in AD (red), MCI (blue) and HC (green) groups at the cortical sites and frequency bands showing a significant between-groups difference in the one-way ANOVAs. Maps are scaled between minimal and maximal F-values across the statistical comparisons in all frequency bands. White dots represent significant statistical differences, according to the FDR correction (p ≤ 0.0102). y axis of histograms has non-zero origin to magnify standard errors visibility. The groups with significant differences in the post hoc pairwise comparisons by two-tailed unpaired t test (p ≤ 0.05) are reported by numerical code (1: AD, 2: MCI, 3: HC). See also Figure S2 and Table S2.
Figure 3
Figure 3
Changes in the waking EEG delta power across a night of sleep in AD, MCI, and HC groups and its relationship with the sleep activity in the AD group (A) Statistical map (F-values) of the Group x Time of day interaction of the mixed-design ANOVAs [between-subjects factor Group: AD vs. MCI vs. HC; within-subject factor Time of day: evening wakefulness (PM) vs. evening wakefulness (AM)] on spectral power in the delta band. White dots represent significant statistical interactions, according to the FDR correction (p ≤ 0.0102). See also Table S3. (B) Spectral power (mean ± SEM) in AD (red), MCI (blue) and HC (green) groups during evening (PM) and morning (AM) wakefulness at the cortical sites showing a significant Group x Time of day interaction in the mixed-design ANOVAs. Colored asterisks represent significant PM vs. AM differences (two-tailed paired t-tests, p ≤ 0.05) in the specific group coded by the asterisk color (red ∗: AD, blue ∗: MCI, green ∗: HC), while the groups with significant differences in the pairwise between-group comparisons (two-tailed unpaired t-tests, p ≤ 0.05) are reported by numerical code (1: AD, 2: MCI, 3: HC). (C) Statistical maps of the (two-sided) Pearson's r correlation coefficients between changes in waking EEG delta power before and after sleep at a representative frontal site (F4) and the EEG spectral power during NREM sleep (first row) and during REM sleep (second row) in AD. The maps are scaled according to minimal and maximal r-values across all frequency bands and sleep stages. White dots represent significant correlations, according the FDR correction (p ≤ 0.0054). MCI and HC did not show significant correlations. See also Table S4.
Figure 4
Figure 4
The EEG slowing during REM sleep and wakefulness in AD, MCI, and HC groups (A) Topographic maps of the EEG slowing index [(delta + theta)/(alpha + sigma + beta)] during evening wakefulness (PM, first row), REM sleep (second row), and morning wakefulness (AM, third row) in AD (first column), MCI (second column) and HC (third column) groups. The topographic maps are scaled between minimal and maximal values of the three groups within each condition. (B) Statistical maps (F-values) of the one-way ANOVAs (AD vs. MCI vs. HC) on the EEG slowing index in each condition. Maps are scaled between minimal and maximal F-values across the statistical comparisons in all conditions. White dots represent significant statistical differences, according to the FDR correction (p ≤ 0.0102). See also Table S5. (C) Histograms of the EEG slowing index (mean ± SEM) in AD (red), MCI (blue) and HC (green) groups at the cortical sites showing a significant between-groups difference in the one-way ANOVAs for each condition. y axis of histograms has non-zero origin to magnify standard errors visibility. The groups with significant differences in the post hoc pairwise comparisons by two-tailed unpaired t test (p ≤ 0.05) are reported by numerical code (1: AD, 2: MCI, 3: HC).
Figure 5
Figure 5
Correlation between the EEG slowing in REM sleep and the EEG slowing in morning and evening wakefulness (A) Statistical maps of the Pearson's r correlation coefficients between the EEG slowing index during REM sleep at one representative occipital site (O1) and the EEG slowing during evening (PM, first column) and morning (AM, second column) wakefulness in AD (first row), MCI (second row) and HC (third row) groups. Maps are scaled between minimal and maximal r-values across the conditions and groups. White dots represent significant correlations, according to the FDR correction (p ≤ 0.0054). See also Table S6. (B) Topographic maps of the angular coefficients (β, first row) and R2 (second row) of the linear regression fits computed on the (z-transformed) correlation coefficients in the three groups (for graphic purposes only) for the evening (first column) and morning (second column) resting state conditions. Maps are scaled between minimal and maximal values across the conditions.
Figure 6
Figure 6
Correlation between the main EEG alterations in AD and MCI and cognitive impairment Statistical maps of the (two-sided) Pearson's r correlation coefficients between the main EEG alterations during sleep (i.e. NREM sleep sigma power and EEG slowing during REM, first row) and wakefulness (evening end morning EEG slowing, second row) and the MMSE scores. The maps are scaled according to the minimal and maximal r-values across the conditions. White dots represent significant correlations, according the FDR correction (p ≤ 0.0054). See also Table S7.
Figure 7
Figure 7
Summary of the topographic and frequency-specific EEG features of cortical activity during wakefulness and sleep in MCI and AD Topography of the frequency-specific significant differences in cortical activity in MCI and AD as compared to HC (one-way ANOVAs, p ≤ 0.0102) during evening wakefulness, NREM and REM sleep, and morning wakefulness (upper). The direction of the difference in the pairwise comparisons is given by the red and blue arrows representing significant increased and decreased cortical activity (two-tails unpaired t-tests, p ≤ 0.05) in MCI and AD compared to HC and in AD compared to MCI, respectively. The gradual disappearance of the changes in delta power between pre-sleep and post-sleep wakefulness EEG from HC to AD condition (bottom) is also shown. The maps represent AM log10(Delta power) – PM log10(Delta power) differences for HC, MCI, and AD groups. The negative values of the blue scale indicates that delta power decreases after sleep. The scatterplots show the linear correlation among this delta power change at a frontal representative site (F4) and the high-frequency activity during NREM and REM sleep at a posterior representative site (O1) in the AD group. F4 and O1 derivations were respectively chosen as representative for delta power changes in waking EEG and posterior beta power activity during sleep since they showed the highest correlation in the analysis reported in Figure 3C.

References

    1. Andrade K.C., Spoormaker V.I., Dresler M., Wehrle R., Holsboer F., Samann P.G., Czisch M. Sleep spindles and hippocampal functional connectivity in human NREM sleep. J. Neurosci. 2011;31:10331–10339. doi: 10.1523/JNEUROSCI.5660-10.2011. - DOI - PMC - PubMed
    1. Babiloni C., Binetti G., Cassetta E., Forno G.D., Percio C. Del, Ferreri F., Ferri R., Frisoni G., Hirata K., Lanuzza B. Sources of cortical rhythms change as a function of cognitive impairment in pathological aging: a multicenter study. Clin. Neurophysiol. 2006;117:252–268. doi: 10.1016/j.clinph.2005.09.019. - DOI - PubMed
    1. Babiloni C., Lizio R., Del Percio C., Marzano N., Soricelli A., Salvatore E., Ferri R., Cosentino F.I.I., Tedeschi G., Montella P. Cortical sources of resting state EEG rhythms are sensitive to the progression of early stage Alzheimer’s disease. J. Alzheimer’s Dis. 2013;34:1015–1035. doi: 10.3233/JAD-121750. - DOI - PubMed
    1. Babiloni C., Lizio R., Marzano N., Capotosto P., Soricelli A., Triggiani A.I., Cordone S., Gesualdo L., Del Percio C. Brain neural synchronization and functional coupling in Alzheimer’s disease as revealed by resting state EEG rhythms. Int. J. Psychophysiol. 2015;103:88–102. doi: 10.1016/j.ijpsycho.2015.02.008. - DOI - PubMed
    1. Babiloni C., Triggiani A.I., Lizio R., Cordone S., Tattoli G., Bevilacqua V., Soricelli A., Ferri R., Nobili F., Gesualdo L. Classification of single normal and Alzheimer’s disease individuals from cortical sources of resting state EEG rhythms. Front. Neurosci. 2016;10:47. doi: 10.3389/fnins.2016.00047. - DOI - PMC - PubMed

LinkOut - more resources