. 2021 Mar 26;3(2):fcab048.
doi: 10.1093/braincomms/fcab048. eCollection 2021.

Early neuroimaging and ultrastructural correlates of injury outcome after neonatal hypoxic-ischaemia

Affiliations

Early neuroimaging and ultrastructural correlates of injury outcome after neonatal hypoxic-ischaemia

Yu-Chieh Jill Kao et al. Brain Commun. .

Erratum in

Abstract

Hypoxic ischaemia encephalopathy is the major cause of brain injury in new-borns. However, to date, useful biomarkers which may be used to early predict neurodevelopmental impairment for proper commencement of hypothermia therapy is still lacking. This study aimed to determine whether the early neuroimaging characteristics and ultrastructural correlates were associated with different injury progressions and brain damage severity outcomes after neonatal hypoxic ischaemia. Longitudinal 7 T MRI was performed within 6 h, 24 h and 7 days after hypoxic ischaemia in rat pups. The brain damage outcome at 7 days post-hypoxic ischaemia assessed using histopathology and MRI were classified as mild, moderate and severe. We found there was a spectrum of different brain damage severity outcomes after the same duration of hypoxic ischaemia. The severity of brain damage determined using MRI correlated well with that assessed by histopathology. Quantitative MRI characteristics denoting water diffusivity in the tissue showed significant differences in the apparent diffusion coefficient deficit volume and deficit ratios within 6 h, at 24 h and 7 days after hypoxic ischaemia among the 3 different outcome groups. The susceptible brain areas to hypoxic ischaemia were revealed by the temporal changes in regional apparent diffusion coefficient values among three outcome groups. Within 6 h post-hypoxic ischaemia, a larger apparent diffusion coefficient deficit volume and deficit ratios and lower apparent diffusion coefficient values were highly associated with adverse brain damage outcome. In the apparent diffusion coefficient deficit areas detected early after hypoxic ischaemia which were highly associated with severe damage outcome, transmission electron microscopy revealed fragmented nuclei; swollen rough endoplasmic reticulum and degenerating mitochondria in the cortex and prominent myelin loss and axon detraction in the white matter. Taken together, different apparent diffusion coefficient patterns obtained early after hypoxic ischaemia are highly associated with different injury progression leading to different brain damage severity outcomes, suggesting the apparent diffusion coefficient characteristics may be applicable to early identify the high-risk neonates for hypothermia therapy.

Keywords: apparent diffusion coefficient; hypoxic-ischaemia; magnetic resonance imaging; rat pups; transmission electric spectroscopy.


Figures

Graphical Abstract
Graphical Abstract
Figure 1
Figure 1
The spectrum of different brain damage severity outcomes after the same duration of HI determined using histopathology and MRI. (A) Different degrees of brain damage outcomes, namely mild, moderate and severe, were observed using the T2-weighted images (upper panel), Nissl-stained histopathology (lower panel) and gross anatomy (right panel) 7 days after the same duration of HI. (B) The ipsilateral cerebral hemispheric volume loss compared with the contralateral cerebral hemisphere by using histopathology was used to represent the spectrum of brain damage severity outcomes after HI. N = 24 for histopathology. (C) A Raster plot of brain damage severity outcome in the relationship between the percentages of hemispheric volume reduction measured by MRI and that by histopathology (IHC). The linear regression line was plotted as the overall regression was significant (P <0.001) determined by using a Spearman’s correlation test. The inset shows the exclusion of the oedema formation region during the calculation of MR-derived brain damage outcomes based on T2-weighted images. Light blue, ipsilateral hemisphere; dark blue, contralateral hemisphere. N = 20 for MRI.
Figure 2
Figure 2
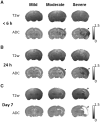
Longitudinal changes in diffusion and T2-weighted MR images at 6 h, 24 h and 7 days after HI in different brain damage severity outcome groups. Representative ADC map and T2-weighted images within 6 h in A, at 24 h in B and 7 days in C after HI in the mild, moderate and severe outcome groups. Although no ADC change was observed in the mild outcome group, the ADC deficit region (black arrowheads) observed in the ipsilateral cerebral cortex and the subcortical area within 6 h after HI, and expanded at 24 h after HI in the moderate and severe outcome groups. A significant reduction of the ipsilateral hemispheric volume was observed at 7 days after HI in the moderate and severe outcome groups. Oedema formation (white arrowheads) was evident in both T2-weighted images and the ADC map at 7 days in the severe outcome group.
Figure 3
Figure 3
The difference of changes in quantitative MRI characteristics after HI among the mild (N = 7), moderate (N = 8) and severe (N = 9) damage outcome groups at each time point after HI. ADC-derived deficit volume in A, mean ADC values in B, ADC-derived deficit ratio in C and D hemispheric volume changes defined using T2-weighted images within 6 h, at 24 h and 7 days after HI in D. The inset images labelled the ADC deficit volume (yellow contour); ADC deficit region (red); ADC-derived deficit ratio: ADC deficit volume (yellow contour)/ipsilateral hemispheric volume (orange contour); hemispheric volume change: The volume in the ipsilateral (orange contour)/contralateral hemispheres (green contour), respectively. The error bars were standard deviation. Significance level (*P <0.05 and **P <0.005) among groups at each time point was determined by using an unpaired 2-way ANOVA with post hoc tests (ADC deficit volume F4,66 = 2.884, P =0.03; ADC values F4,66 = 7.697, P <0.001; ADC deficit ratio F4,66 = 2.799, P =0.03 and hemispheric volume change F4,66 = 48.08, P <0.001).
Figure 4
Figure 4
ROIs analysis of the regional ADC values in different brain areas among the mild (N = 7), moderate (N = 8) and severe (N = 8) damage outcome groups at each time point after HI. The mean ADC values in the ipsilateral cortex in A, thalamus in B, hippocampus in C, striatum in D and corpus callosum in E within 6 h, at 24 h and 7 days after HI. The error bars were standard deviation. Significance level (*P <0.05 and **P <0.005) among groups at each time point was determined by using an unpaired 2-way ANOVA with post hoc tests (the cortex F4,66 = 29.592, P <0.001; the thalamus F4,66 = 2.881, P = 0.03; the hippocampus F4,66 = 6.673, P <0.001; the striatum F4,66 = 1.926, P =0.118 and the corpus callosum F4,66 = 10.590, P <0.001).
Figure 5
Figure 5
Correlation between the MRI characteristics within 6 h after HI and the brain damage severity outcome 7 days after HI. The respective raster plot on the relationship between the ADC-derived deficit volume in A, ADC values in B, ADC-derived deficit ratio in C and cerebral hemispheric volume changes defined using T2-weighted images in D within 6 h after HI versus the cerebral volume loss 7 days after HI. The severity of brain damage was categorized by the percentages of ipsilateral cerebral hemispheric volume loss measured using T2-weighted images at 7 days after HI. The linear regression line was plotted (ADC-derived deficit volume, ADC values, ADC deficit ratios) if the overall regression was significant (P <0.05) determined by using a Pearson’s correlation test.
Figure 6
Figure 6
The ultrastructural characteristics in the cortex (neurons) and white matter (axons and oligodendrocytes) underlying the ADC changes noted early after HI that correlated with different brain damage severity outcomes. The ADC map in the sham control in A and within 6 h after HI that correlated with mild damage in B and severe damage in C outcome groups. The red and blue boxes indicated the sample of TEM in the cortex and white matter, respectively. Transmission electron microscopy showed the neurons in D–F in the cortex, and the myelinated axons in G–I and oligodendrocytes in J–L in the white matter in the sham control, mild and severe outcome groups. Compared with the cortical neurons in the sham control group in D, the neuron showed dilation of rER (black arrowheads) and swollen mitochondria (white arrowheads) in the mild outcome group in E, but massive swelling of rER (black arrowheads) and the degenerated mitochondria (white arrowheads) accompanied with degradation of nucleus in the severe outcome group in F. Compared with the white matter in the sham control group in G, demyelination (black arrows) was noted in the mild in H and severe in I outcome group, whereas prominent axon detraction (white arrows) was only observed in the severe outcome group in I. By contrast, the morphology of oligodendrocyte was similar among the sham control, mild and severe outcome groups in J, K and I. N, the nucleus of the neuron; Axe, axon; O, oligodendrocyte. The scale bar, 1 µm.
Figure 7
Figure 7
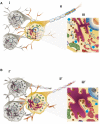
Hypothesis schema showing restricted cellular water diffusion underlying the areas of low ADC values in the cortex and white matter within 6 h after HI. (A) In the intact brain, water molecules are freely diffused in the extracellular (i) and intracellular space (iii), as well as along the myelinated axons in the white matter (ii). (B) Early after HI, cell swelling with decreased extracellular space volume interferes with the water diffusion (i’). In the myelinated axons, the degeneration of myelin and the detraction of axons obstruct diffusion of myelin water (ii’). In addition, aggregation of chromatin in the nucleus and massive swelling of organelles in the cytoplasm may hinder the intracellular free water diffusion (iii’).

References

    1. Douglas-Escobar M, Weiss MD.. Hypoxic-ischemic encephalopathy: A review for the clinician. JAMA Pediatr. 2015;169(4):397–403. - PubMed
    1. Johnston MV, Fatemi A, Wilson MA, et al.Treatment advances in neonatal neuroprotection and neurointensive care. Lancet Neurol. 2011;10(4):372–382. - PMC - PubMed
    1. Natarajan G, Pappas A, Shankaran S.. Outcomes in childhood following therapeutic hypothermia for neonatal hypoxic-ischemic encephalopathy (HIE). Sem Perinatol. 2016;40(8):549–555. - PMC - PubMed
    1. McAdams RM, Juul SE.. Neonatal encephalopathy: Update on therapeutic hypothermia and other novel therapeutics. Clin Perinatol. 2016;43(3):485–500. - PMC - PubMed
    1. Shankaran S.Therapeutic hypothermia for neonatal encephalopathy. Curr Opin Pediatr. 2015;27(2):152–157. - PubMed

LinkOut - more resources