

Machine learning discovery of high-temperature polymers
- PMID: 33982020
- PMCID: PMC8085602
- DOI: 10.1016/j.patter.2021.100225
Machine learning discovery of high-temperature polymers
Abstract
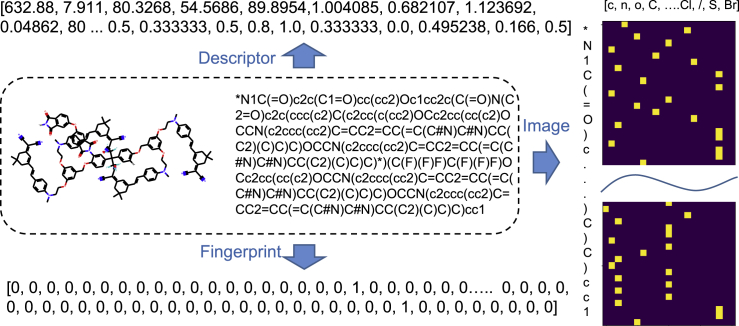
To formulate a machine learning (ML) model to establish the polymer's structure-property correlation for glass transition temperature , we collect a diverse set of nearly 13,000 real homopolymers from the largest polymer database, PoLyInfo. We train the deep neural network (DNN) model with 6,923 experimental values using Morgan fingerprint representations of chemical structures for these polymers. Interestingly, the trained DNN model can reasonably predict the unknown values of polymers with distinct molecular structures, in comparison with molecular dynamics simulations and experimental results. With the validated transferability and generalization ability, the ML model is utilized for high-throughput screening of nearly one million hypothetical polymers. We identify more than 65,000 promising candidates with > 200°C, which is 30 times more than existing known high-temperature polymers (∼2,000 from PoLyInfo). The discovery of this large number of promising candidates will be of significant interest in the development and design of high-temperature polymers.
Keywords: feature representation; glass transition temperature; high-throughput screening; machine learning; polymer.
© 2021 The Authors.
Conflict of interest statement
The authors declare no competing interests.
Figures


Similar articles
-
Predicting Polymers' Glass Transition Temperature by a Chemical Language Processing Model.Polymers (Basel). 2021 Jun 7;13(11):1898. doi: 10.3390/polym13111898. Polymers (Basel). 2021. PMID: 34200505 Free PMC article.
-
PI1M: A Benchmark Database for Polymer Informatics.J Chem Inf Model. 2020 Oct 26;60(10):4684-4690. doi: 10.1021/acs.jcim.0c00726. Epub 2020 Oct 8. J Chem Inf Model. 2020. PMID: 32986418
-
Benchmarking Machine Learning Models for Polymer Informatics: An Example of Glass Transition Temperature.J Chem Inf Model. 2021 Nov 22;61(11):5395-5413. doi: 10.1021/acs.jcim.1c01031. Epub 2021 Oct 18. J Chem Inf Model. 2021. PMID: 34662106
-
Data Integration Using Advances in Machine Learning in Drug Discovery and Molecular Biology.Methods Mol Biol. 2021;2190:167-184. doi: 10.1007/978-1-0716-0826-5_7. Methods Mol Biol. 2021. PMID: 32804365 Review.
-
Computational Discovery of Transition-metal Complexes: From High-throughput Screening to Machine Learning.Chem Rev. 2021 Aug 25;121(16):9927-10000. doi: 10.1021/acs.chemrev.1c00347. Epub 2021 Jul 14. Chem Rev. 2021. PMID: 34260198 Review.
Cited by
-
Low-cost machine learning prediction of excited state properties of iridium-centered phosphors.Chem Sci. 2023 Jan 5;14(6):1419-1433. doi: 10.1039/d2sc06150c. eCollection 2023 Feb 8. Chem Sci. 2023. PMID: 36794185 Free PMC article.
-
A Model Ensemble Approach Enables Data-Driven Property Prediction for Chemically Deconstructable Thermosets in the Low-Data Regime.ACS Cent Sci. 2023 Sep 14;9(9):1810-1819. doi: 10.1021/acscentsci.3c00502. eCollection 2023 Sep 27. ACS Cent Sci. 2023. PMID: 37780353 Free PMC article.
-
Large-Scale Glass-Transition Temperature Prediction with an Equivariant Neural Network for Screening Polymers.ACS Omega. 2024 Jan 26;9(5):5452-5462. doi: 10.1021/acsomega.3c06843. eCollection 2024 Feb 6. ACS Omega. 2024. PMID: 38343992 Free PMC article.
-
Integration of Machine Learning and Coarse-Grained Molecular Simulations for Polymer Materials: Physical Understandings and Molecular Design.Front Chem. 2022 Jan 24;9:820417. doi: 10.3389/fchem.2021.820417. eCollection 2021. Front Chem. 2022. PMID: 35141207 Free PMC article.
-
Prediction and Interpretation of Polymer Properties Using the Graph Convolutional Network.ACS Polym Au. 2022 Jan 21;2(4):213-222. doi: 10.1021/acspolymersau.1c00050. eCollection 2022 Aug 10. ACS Polym Au. 2022. PMID: 36855563 Free PMC article.
References
-
- Hergenrother P.M. The use, design, synthesis, and properties of high performance/high temperature polymers: an overview. High Perform. Polym. 2003;15:3–45.
-
- Meador M.A. Recent advances in the development of processable high-temperature polymers. Annu. Rev. Mater. Sci. 1998;28:599–630.
-
- Mittal K.L. Vol. 3. CRC Press; 2005. (Polyimides and Other High Temperature Polymers: Synthesis, Characterization and Applications).
-
- Sperati C.A., Starkweather H.W. Fortschritte Der Hochpolymeren-Forschung. Springer; 1961. Fluorine-containing polymers. II. Polytetrafluoroethylene; pp. 465–495.
-
- Petrie E. Extreme high temperature thermoplastics: gateway to the future or the same old trail. Pop. Plast. Packag, 2012;57:30–43.
LinkOut - more resources
Full Text Sources
Other Literature Sources
Miscellaneous
