Review
. 2021 Jun 2;32(6):1278-1294.
doi: 10.1021/jasms.1c00099. Epub 2021 May 13.

Novel Strategies to Address the Challenges in Top-Down Proteomics

Affiliations
Review

Novel Strategies to Address the Challenges in Top-Down Proteomics

Jake A Melby et al. J Am Soc Mass Spectrom. .

Abstract

Top-down mass spectrometry (MS)-based proteomics is a powerful technology for comprehensively characterizing proteoforms to decipher post-translational modifications (PTMs) together with genetic variations and alternative splicing isoforms toward a proteome-wide understanding of protein functions. In the past decade, top-down proteomics has experienced rapid growth benefiting from groundbreaking technological advances, which have begun to reveal the potential of top-down proteomics for understanding basic biological functions, unraveling disease mechanisms, and discovering new biomarkers. However, many challenges remain to be comprehensively addressed. In this Account & Perspective, we discuss the major challenges currently facing the top-down proteomics field, particularly in protein solubility, proteome dynamic range, proteome complexity, data analysis, proteoform-function relationship, and analytical throughput for precision medicine. We specifically review the major technology developments addressing these challenges with an emphasis on our research group's efforts, including the development of top-down MS-compatible surfactants for protein solubilization, functionalized nanoparticles for the enrichment of low-abundance proteoforms, strategies for multidimensional chromatography separation of proteins, and a new comprehensive user-friendly software package for top-down proteomics. We have also made efforts to connect proteoforms with biological functions and provide our visions on what the future holds for top-down proteomics.


Conflict of interest statement

The authors declare the following competing financial interest(s): The University of Wisconsin, Madison, has filed a provisional patent application P180335US01, US serial number 62/682,027 (June 7, 2018) on the basis of the photocleavable surfactant work. Y.G., S.J., and K.A.B. are named as inventors on the provisional patent application. The University of Wisconsin, Madison, has filed a provisional patent application serial number 62/949,869 (December 18, 2019) on the basis of the nanoparticles for cardiac troponin enrichment. Y.G., S.J., and D.S.R. are named as the inventors on the provisional patent application. The authors have no other relevant affiliations or financial involvement with any organization or entity with a financial interest in or financial conflict with the subject matter or materials discussed in the manuscript apart from those disclosed.

Figures

Figure 1.
Figure 1.
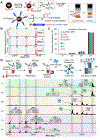
Addressing the challenges in top-down proteomics through novel strategies. Illustration of the current major challenges in top-down proteomics. These challenges include protein solubility, proteome dynamic range, proteome complexity, intact protein data analysis, proteoform–function relationships, and analytical throughput.
Figure 2.
Figure 2.
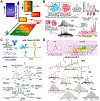
A novel photocleavable surfactant to address protein solubility challenge. (A) Scheme illustrating the use of Azo in solubilizing proteins, followed by rapid degradation with UV irradiation, and MS analysis of the intact proteins. Note that the molecules are not drawn to scale. (B) Degradation of Azo into 4-hexylphenol, 4-hexylbenzene, nitrogen, and hydrogen sulfate under UV irradiation. (C) Synthetic scheme for Azo. (D) UV–Vis spectra of Azo (0.1%) degradation as a function of time, showing that Azo can be rapidly degraded by UV irradiation at ambient temperature. SDS–PAGE analysis (E) and protein assay (F) for the evaluation of effectiveness of surfactant-aided protein extractions (E3) following the initial HEPES buffer extractions (E1 and E2) to deplete the cytosolic proteins from the cardiac tissue. NS, no surfactant (serving as a control). Error bars represent the standard error of measurement for protein assay experiments (n = 3). (G) ESI–MS analysis of ubiquitin with 0.1% surfactant to investigate MS compatibility. The mass spectra were normalized to an intensity of 1.7 × 10⁶. Data are representative of three independent experiments. (H) Scheme for Azo-enabled high-throughput top-down and bottom-up proteomics. Figure adapted from refs and . Copyright 2019 Springer Nature (A–G). Copyright 2020 John Wiley & Sons, Inc. (H).
Figure 3.
Figure 3.
Nanoproteomics enables proteoform-resolved analysis of low-abundance cardiac troponin I in human serum. (A) Silanization of Fe3O4 NPs using an allene carboxamide-based organosilane monomer (BAPTES) for cysteine thiol-specific bioconjugation. The rationally designed NPs are surface functionalized with a 13-mer peptide that has a high affinity for cTnI (NP-Pep) for cTnI enrichment. (B) Top-down MS-based evaluation of cTnI enrichment using three different synthetic batches of NP-Pep showing the reproducible enrichment performance. (C) Evaluation of total cTnI proteoform recovery. The deconvoluted top-down mass spectra corresponding to cTnI proteoforms were used to calculate the relative abundance of each cTnI proteoform when normalizing for total protein amount injected. Proteoform abundance data are representative of n = 6 independent experiments with error bars indicating the standard error of the mean. cTnI relative abundance data. Roman numerals correspond to N-terminally acetylated cTnI proteoforms following Met exclusion: (i) ppcTnI[1–207]; (ii) cTnI; (iii) pcTnI; (iv) ppcTnI; (v) cTnI[1–205]; (vi) pcTnI[1–205]; (vii) cTnI[1–206]; (viii) pcTnI[1–206]. (D) Nanoproteomics assay utilizing NP-Pep for specific enrichment of cTnI from serum and subsequent top-down MS analysis of cTnI proteoforms. cTnI is first spiked into human serum to prepare the loading mixture (L). The NPs are then incubated with the serum loading mixture, the cTnI-bound NPs are magnetically isolated, and the unwanted and nonspecific proteins are removed as flow-through (F). The captured cTnI is then eluted, and the final elution fraction after enrichment is analyzed by top-down LC-MS/MS. The cTnI (~10–20 ng/mL) spiked in the human serum (10 mg) were extracted from various human hearts: (i) and (ii), donor hearts; (iii) and (iv), diseased hearts with dilated cardiomyopathy, (v) and (vi), post-mortem hearts. p, phosphorylation. pp, bisphosphorylation. Figure adapted from ref . Copyright 2020 Springer Nature.
Figure 4.
Figure 4.
Novel separation strategies to address proteome complexity. (A) Comparison of the various protein separation techniques. Ion-exchange chromatography (IEX or IEC), hydrophobic interaction chromatography (HIC), reverse phase chromatography (RPC), size-exclusion chromatography (SEC), and hydrophilic interaction chromatography (HILIC) are shown as representative separation techniques. (B) Overview of the serial size-exclusion chromatography (sSEC) strategy for complex protein mixture separation. (1) Protein mixtures pass through two sSEC columns (1000–500 Å) to separate the proteins by high (1000 Å) and low (500 Å) molecular weights, (2) specific protein fractions are collected, (3) sample fractions are analyzed using online RPC-MS, (4) individual proteins are characterized. Figure adapted from ref . Copyright 2017 American Chemical Society. (C) Online HIC-MS of mAb mixtures on a maXis II Q-TOF mass spectrometer. Mass spectrum of a specific mAb (mAb2) showed the detection of monomers, dimers (30× zoom-in), and trimers (100× zoom-in). A deconvoluted mass spectrum of the mAb2 monomer is shown with annotated glycosylation forms (red triangle, fucose; blue square, GlcNAc; green circle, mannose; yellow circle, galactose); a hollow square represents the loss of one GlcNAc (−203 Da), a hollow triangle represents the preservation of C-terminal Lys on the heavy chain (+128 Da), and an asterisk represents the addition of a hexose (+162 Da). GxF indicates Fc-oligosaccharides terminated by x number of galactoses. Figure adapted from ref . Copyright 2018 American Chemical Society. (D) Illustration of the 3D IEC (or IEX) /HIC/RPC-MS/MS separation strategy. HIC was employed as a second dimension of separation (following IEX) prior to top-down RPC-MS/MS analysis. Online RPC-MS analysis of intact proteins from a HEK293 cell lysate following IEC-HIC fractionations (3DLC approach) with representative RPC/MS results of 3DLC (IEC-HIC-RPC) is shown. Figure adapted from ref . Copyright 2015 American Chemical Society.
Figure 5.
Figure 5.
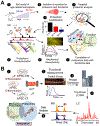
MASH Explorer as a universal software environment for top-down proteomics. (A) Schematic of the various MASH Explorer functions for proteomics data processing. The main functions of MASH Explorer include data import, spectral deconvolution, workflow automation, data validation, protein identification, and graphical output. MASH Explorer utilizes a new data processing module based on the ProteoWizard Library to accept various data input file formats from major instrument vendors (e.g., Thermo, Bruker, and Waters). Raw MS and MS/MS data files are then processed by deconvolution algorithms (i.e., MS-Deconv, TopFD, eTHRASH, pParseTD, Flashdeconv, and UniDec) and database search algorithms (i.e., MS-Align+, TopPIC, pTop, and MSPathFinderT). (B) Illustration of “Discovery mode” for LC-MS/MS data processing. “Discovery mode” can handle batch LC-MS/MS raw data files and includes features such as data import, data processing (deconvolution and database search), and data validation for protein identification. (C) Illustration of the “Targeted Mode” workflow for MASH Explorer. The “Targeted Mode” workflow includes data import, spectral deconvolution to identify and verify isotopic distributions, database search based on identified isotopic distributions, and proteoform characterization by matching identified isotopic distributions to the target proteoform sequence. (D) Cartoon schematic of a “world map” featuring the location distribution of MASH users across the globe. There are currently 2086 active users (March 1, 2021) with ~65% of users from North America, ~18% from Europe, and ~8% from Asia. Figure updated and adapted from ref . Copyright 2020 American Chemical Society.
Figure 6.
Figure 6.
Linking protoeoforms with biological function using top-down proteomics. (A) Integrated approach combining top-down targeted proteomics with mechanical measurements to elucidate the molecular mechanism(s) underlying age-related sarcopenia. This approach includes the following: (1) use of a rat model of age-related sarcopenia; (2) isolation of skeletal muscle for proteomic and mechanical analyses; (3) top-down targeted proteomics for RLC proteoform analysis; (4) MS-based proteoform quantification; (5) MS/MS analysis for the comprehensive characterization of RLC proteoform sequences and PTMs; (6) mechanical measurements on single fibers; and (7) correlation of the targeted proteomics data with functional data to explain the sarcopenic phenotype. mo, month. Figure adapted from ref . Copyright 2016 American Chemical Society. (B) Schematic of integrated functional assessments and the top-down proteomics workflow for the same hiPSC-ECT. (1) hiPSCs are differentiated into CMs and CFs which are used to generate hiPSC-ECTs. (2) Functional assessments are performed on the hiPSC-ECTs to measure the isometric twitch force. (3) Sarcomeric proteins are extracted via a dual extraction method from the functionally tested hiPSC-ECTs. (4) Top-down proteomics is performed on the functionally tested hiPSC-ECTs. (5) Integrated assessment of hiPSC-ECT constructs. Figure adapted from ref . Copyright 2021 American Chemical Society.

References

    1. Smith LM; Kelleher NL Proteoform: A Single Term Describing Protein Complexity. Nat. Methods 2013, 10, 186–187. - PMC - PubMed
    1. Smith LM; Kelleher NL Proteoforms as the next Proteomics Currency: Identifying Precise Molecular Forms of Proteins Can Improve Our Understanding of Function. Science 2018, 359 (6380), 1106–1107. - PMC - PubMed
    1. Aebersold R; Agar JN; Amster IJ; Baker MS; Bertozzi CR; Boja ES; Costello CE; Cravatt BF; Fenselau C; Garcia BA; Ge Y; Gunawardena J; Hendrickson RC; Hergenrother PJ; Huber CG; Ivanov AR; Jensen ON; Jewett MC; Kelleher NL; Kiessling LL; Krogan NJ; Larsen MR; Loo JA; Ogorzalek Loo RR; Lundberg E; MacCoss MJ; Mallick P; Mootha VK; Mrksich M; Muir TW; Patrie SM; Pesavento JJ; Pitteri SJ; Rodriguez H; Saghatelian A; Sandoval W; Schlüter H; Sechi S; Slavoff SA; Smith LM; Snyder MP; Thomas PM; Uhlén M; Van Eyk JE; Vidal M; Walt DR; White FM; Williams ER; Wohlschlager T; Wysocki VH; Yates NA; Young NL; Zhang B How many human proteoforms are there? Nat. Chem. Biol 2018, 14, 206–214. - PMC - PubMed
    1. Cai W; Tucholski TM; Gregorich ZR; Ge Y Top-down Proteomics: Technology Advancements and Applications to Heart Diseases. Expert Rev. Proteomics 2016, 13, 717–730. - PMC - PubMed
    1. Chen B; Brown KA; Lin Z; Ge Y Top-Down Proteomics: Ready for Prime Time? Anal. Chem 2018, 90, 110–127. - PMC - PubMed