. 2021 May 13:10:e64674.
doi: 10.7554/eLife.64674.

Propensity for somatic expansion increases over the course of life in Huntington disease

Affiliations

Propensity for somatic expansion increases over the course of life in Huntington disease

Radhia Kacher et al. Elife. .

Abstract

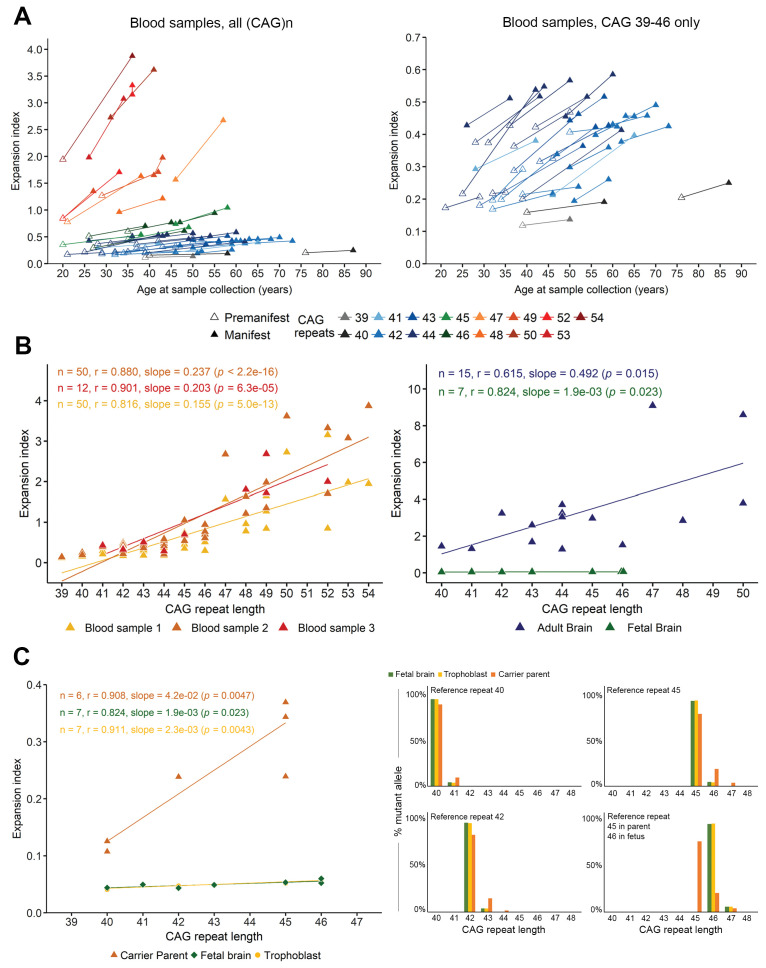
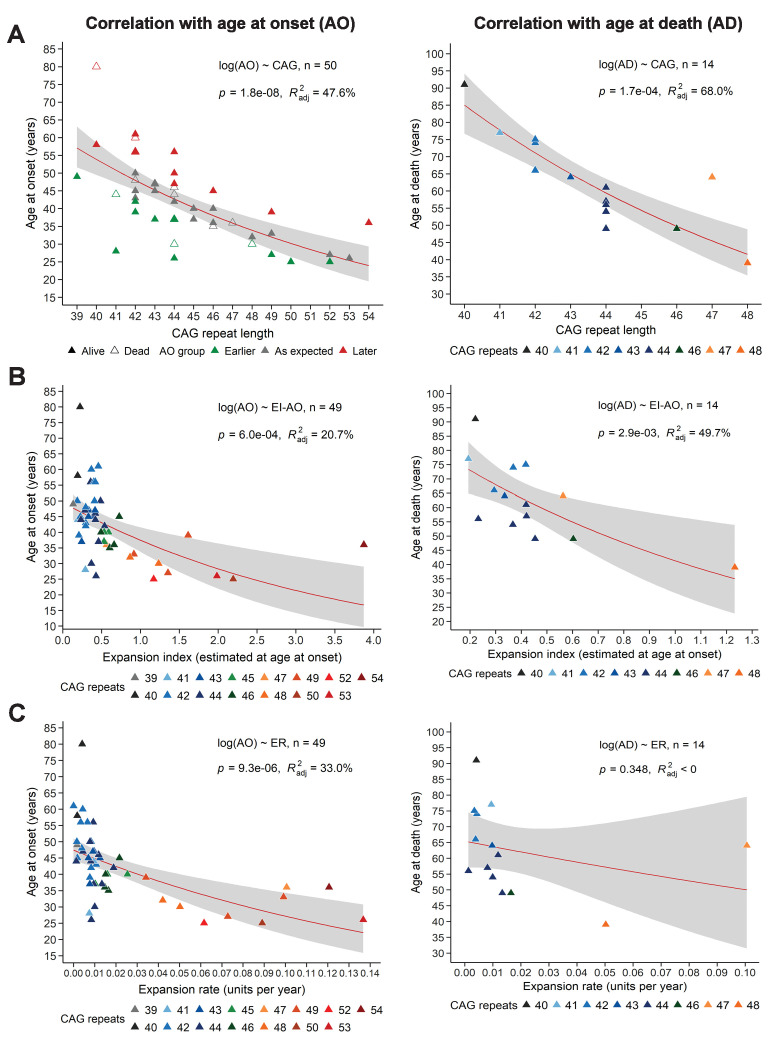
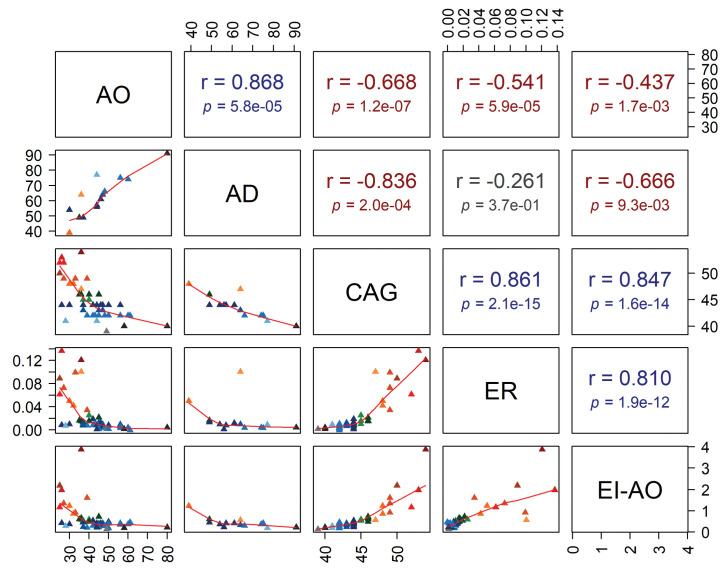
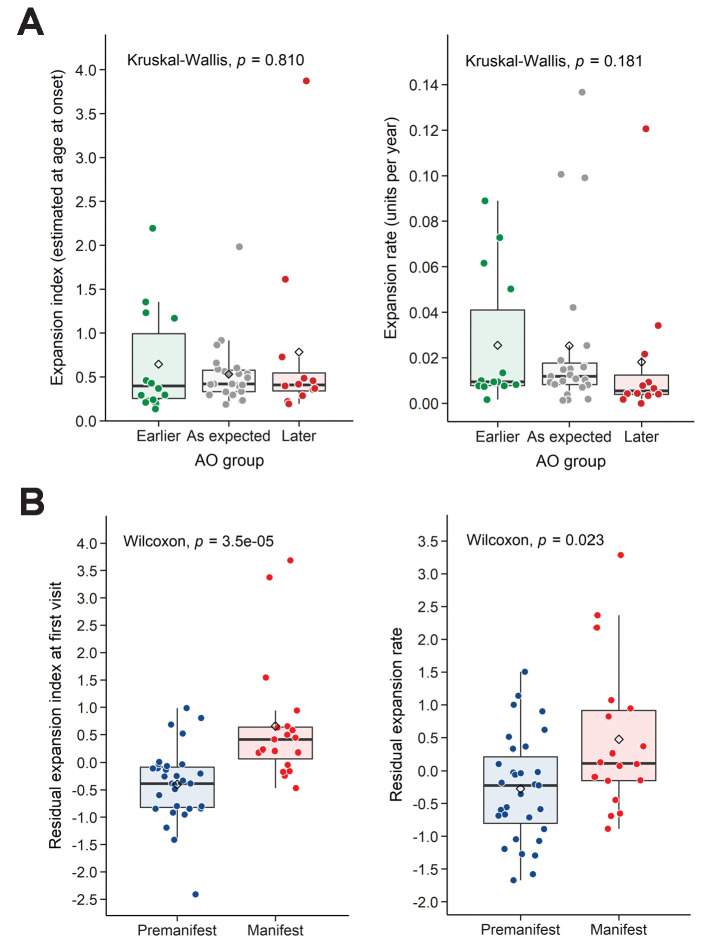
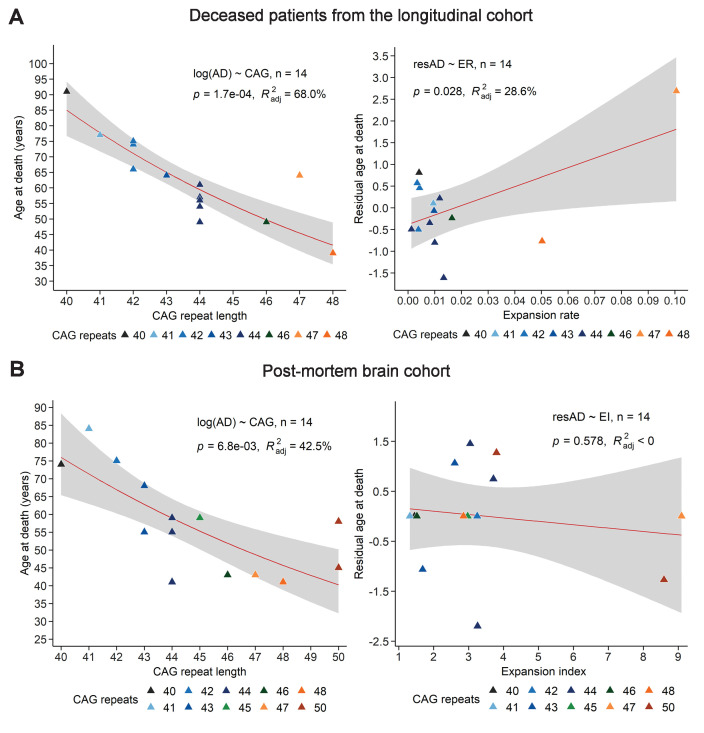
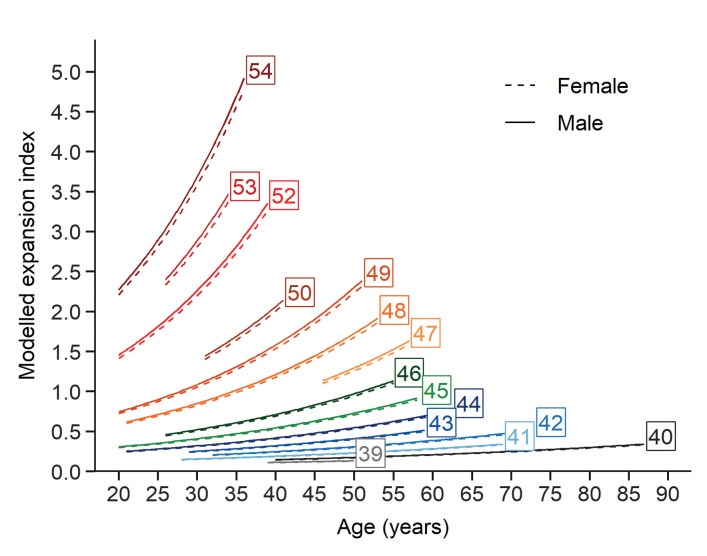
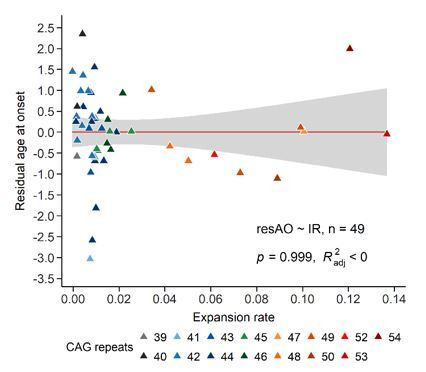
Recent work on Huntington disease (HD) suggests that somatic instability of CAG repeat tracts, which can expand into the hundreds in neurons, explains clinical outcomes better than the length of the inherited allele. Here, we measured somatic expansion in blood samples collected from the same 50 HD mutation carriers over a twenty-year period, along with post-mortem tissue from 15 adults and 7 fetal mutation carriers, to examine somatic expansions at different stages of life. Post-mortem brains, as previously reported, had the greatest expansions, but fetal cortex had virtually none. Somatic instability in blood increased with age, despite blood cells being short-lived compared to neurons, and was driven mostly by CAG repeat length, then by age at sampling and by interaction between these two variables. Expansion rates were higher in symptomatic subjects. These data lend support to a previously proposed computational model of somatic instability-driven disease.

Keywords: CAG expansion; HD mutation carrier; Huntington disease; genetics; genomics; human; human data; longitudinal study; neuroscience; somatic instability.


Conflict of interest statement

RK, FL, SN, CC, AB, SH No competing interests declared, AD serves on the advisory boards of Triplet Therapeutics. and holds partly a Patent B 06291873.5, "Anaplerotic therapy of HD and other polyglutamine diseases."

Figures

Figure 1.
Figure 1.. Somatic instability is negligible during gestation but increases with age.
(A) Left panel: Changes in expansion index (EI) for each Huntington disease (HD) individual, across two or sometimes three visits over multiple years (see Table 5). Different colors indicate different reference (CAG)n at diagnosis (main peak on PCR profile as shown in Figure 1—figure supplement 1). For each value, the disease status is indicated with an empty triangle (premanifest) or filled triangle (manifest; score >5 on the Unified HD Rating Scale total motor score [UHDRS-TMS]). Note that the measurement of the inherited allele remained stable across visits except for patient 44 (Table 2), who went from 54 to 55 (CAG)n at the second sampling, which was taken into account for the EI. Right panel: A closer look at the values clustered at the bottom of the axis in A ((CAG)n 39–46). The EI increases with progression to manifest state even for individuals with relatively small reference repeats. (B) Scatter plot and regression lines show the linear relation between EI and (CAG)n as observed in adult blood from the longitudinal cohort (left panel, n = 50 patients with at least two samples each; of these, 12 had a third sample; yellow: first sample, orange: second sample, and red triangles: third sample) and cortical tissue (right panel, n = 7 fetal brains, green triangles, and n = 15 adult brains, blue triangles). Pearson’s correlation coefficients and estimated regression slopes with p-values, indicated in the upper portion of each graph, reveal a positive linear relation between EI and reference CAG repeat length. (C) EI values from seven fetal samples according to the reference CAG repeat, ranging from 40 to 46 (at 13 weeks gestation). The instability indices of the cortical samples (green) overlap with those of the trophoblast samples (yellow); indices from carrier parents’ blood are in orange (ages 25 to 34 years). Two of the fetuses had the same (CAG)n of 46 and thus overlap on the graph. Left panel: Comparison of brain tissue instability from HD carrier fetuses at 13 weeks (green), to the corresponding trophoblasts sampled for prenatal testing (yellow) and the premanifest carrier parents’ blood (orange). Right panel: The percentage of mutant alleles bearing the different somatic expansions ascertained from the peak heights. Four graphs were plotted for the reference CAGs (40, 42, 45, and 46) determined on the fetal tissues. The parental blood samples show significant somatic expansions, whereas the trophoblast and the developing cortex show very little.
Figure 1—figure supplement 1.
Figure 1—figure supplement 1.. PCR profile and analysis of the CAG repeat length and instability.
(A) PCR profile of a post-mortem brain (from a 74-year-old Huntington disease [HD] individual) with a non-expanded allele of 17 CAG and an expanded allele of 40 CAG. The non-expanded allele consists of one main peak (with a bit of PCR stutter to the left), whereas the expanded allele shows several small peaks to the right of the main peak. The highest peak determines the reference CAG size; the additional peaks correspond to larger expansions and reflect CAG somatic mosaicism. The y axis registers the level of fluorescence for each fragment. (B) Method for calculating the expansion index (EI) and the percentage of mutant alleles. In this study, we considered peaks to represent somatic expansions only if they reached a threshold of at least 3% of the height of the main peak. (C) PCR profile of a HD post-mortem brain from a 8-year-old child carrying an expanded allele of 128 CAG and a non-expanded allele of 30 CAG. Top: Complete PCR profile with the normal allele peak. Bottom: Zoom on the expanded allele.
Figure 2.
Figure 2.. Somatic mosaicism increases in blood and post-mortem cortex over time.
Comparison of mosaicism in cortical tissue from Huntington disease (HD) carrier fetuses at 13 weeks (green), blood samples over time (gold, orange, and red for t1, t2, and t3, respectively) and adult post-mortem cortices (blue). We ascertained the ‘% mutant alleles’ (as in Figure 1C) from the peak heights from PCR profiles obtained on GeneMapper. Three reference CAG lengths (41, 43, or 45 CAG) were chosen from our cohort to illustrate the evolution of instability, and each graph represents one individual patient (from top to bottom): for the fetal samples, patients 2, 4, and 5 (Table 1); for the blood samples, the repeated measures from patients 4, 19, and 34 (Table 2); for the post-mortem samples, patients 2, 5, 10 (Table 3).
Figure 3.
Figure 3.. Somatic expansion correlates with reference CAG repeat length, with age at onset (AO) and age at death (AD).
Scatter plots showing (A) reference CAG repeat length, (B) expansion index (EI) estimated at age at onset (EI-AO) and (C) expansion rate (ER) with respect to AO (left panels) and AD (right panels). p-Values of the slopes and adjusted R-squared for the linear regressions of log(AO) and log(AD) are in the upper right corner of the plots. Red curves denote locally estimated scatterplot smoothing (LOESS) of the data with 95% confidence intervals shaded in gray. (A) Left panel: The reference CAG repeat length explains roughly half the variability in AO (R2adj = 47.6%, p=1.8e-8). HD individuals were classified as having onset earlier than expected (green), as expected (grey), or later than expected (red) according to their distance from the linear predictions given by the CAG repeat (see 'Materials and methods'). Right panel: The reference CAG repeat length explains 68% of the variability in AD (p=1.7e-04). (B) EI-AO explains 20.7% of the variability in AO (p=6.0e-04, left panel) and 49.7% of the variability in AD (p=2.9e-03, right panel). (C) ER explains 33% of the variability in AO (p=9.3e-06, left panel) and does not explain the variability in AD (R2adj < 0, p=0.348, right panel).
Figure 3—figure supplement 1.
Figure 3—figure supplement 1.. Pearson’s correlation analysis.
Correlations between age at onset (AO), age at death (AD) and reference CAG repeat length (CAG) with expansion rate (ER) and expansion index (EI) estimated at age at onset (EI-AO). On the lower left, plots show the relation between the different variables, with a regression line for each scatter plot. On the top right are Pearson’s correlation coefficients with p-values.
Figure 4.
Figure 4.. Residual expansion index (EI) and expansion rate (ER) correlate with disease status.
(A) Boxplots showing the distribution of the EI estimated at age at onset and ER, between the patients’ groups classified in Figure 3A as having earlier-than-expected, expected, or later-than-expected onset. p-Values for the Kruskal-Wallis test are at the top of each plot; thick horizontal lines indicate the median, diamonds indicate the mean. Earlier and later onset patients had similar ERs compared to the as-expected group (p=0.810 and 0.181). (B) Boxplots showing the distribution of the residual EI at the first visit and residual ER, between the patients’ groups classified as premanifest and manifest. p-Values for the Wilcoxon test are at the top of each plot.
Figure 4—figure supplement 1.
Figure 4—figure supplement 1.. Comparison of the relation between age at death, CAG repeat length, and expansion index (EI) as measured in blood samples from deceased longitudinal patients and in post-mortem HD brains.
(A) For the 14 patients from the longitudinal cohort who died during the course of the study, we calculated age at death (AD) relative to CAG repeat length (left) and expansion rate (ER) (right). Data shown with a LOESS curve in red and 95% confidence interval shaded in gray. p-Value of the slope and adjusted R-squared for the linear regressions of log(AD) on CAG repeat length, and residual AD on ER are provided inside the plots. Colors represent different CAG repeat lengths, as indicated by the legend. (B) For the 14 post-mortem brain sample subjects we compared reference (CAG)n to AD, and EI as measured in the frontal cortex to residual age at death. Data are shown with a LOESS curve in red and 95% confidence interval shaded in gray. p-Value of the slope and adjusted R-squared for the linear regressions of log(AD) on CAG repeat length and residual AD on EI are inside the plots. Colors represent different CAG repeat lengths, as indicated.
Figure 5.
Figure 5.. Evolution of somatic expansions in HD patient blood is a function of age, CAG repeat length, and the interaction between age and repeat length.
A linear mixed model was fitted to the longitudinal data using all blood samples collected. The fitted lines show that the predicted somatic expansion increases with age for all reference repeat sizes, most notably at greater reference repeat lengths. The sex of the patients is indicated by solid and dashed lines (male and female respectively). Each curve covers the same age interval observed in our cohort for a given repeat length.
Author response image 1.

References

    1. Andrew SE, Paul Goldberg Y, Kremer B, Telenius H, Theilmann J, Adam S, Starr E, Squitieri F, Lin B, Kalchman MA, Graham RK, Hayden MR. The relationship between trinucleotide (CAG) repeat length and clinical features of Huntington's disease. Nature Genetics. 1993;4:398–403. doi: 10.1038/ng0893-398. - DOI - PubMed
    1. Angeles-López QD, García-Lara L, Aguirre-Pineda N, Castañeda-Arellano R, Elizondo-Azuela G, Pérez-Severiano F, Segovia J. The absence of the aryl hydrocarbon receptor in the R6/1 transgenic mouse model of Huntington's disease improves the neurological phenotype. Behavioural Brain Research. 2021;408:113230. doi: 10.1016/j.bbr.2021.113230. - DOI - PubMed
    1. Barnat M, Capizzi M, Aparicio E, Boluda S, Wennagel D, Kacher R, Kassem R, Lenoir S, Agasse F, Braz BY, Liu J-P, Ighil J, Tessier A, Zeitlin SO, Duyckaerts C, Dommergues M, Durr A, Humbert S. Huntington’s disease alters human neurodevelopment. Science. 2020;369:787–793. doi: 10.1126/science.aax3338. - DOI - PMC - PubMed
    1. Bates D, Mächler M, Bolker B, Walker S. Fitting linear Mixed-Effects models using lme4. Journal of Statistical Software. 2015a;67:1–48. doi: 10.18637/jss.v067.i01. - DOI
    1. Bates GP, Dorsey R, Gusella JF, Hayden MR, Kay C, Leavitt BR, Nance M, Ross CA, Scahill RI, Wetzel R, Wild EJ, Tabrizi SJ. Huntington disease. Nature Reviews Disease Primers. 2015b;1:1–21. doi: 10.1038/nrdp.2015.5. - DOI - PubMed

Publication types

Substances