. 2021 Jul 5;220(7):e202010180.
doi: 10.1083/jcb.202010180. Epub 2021 May 13.

TRIM37 prevents formation of condensate-organized ectopic spindle poles to ensure mitotic fidelity

Affiliations

TRIM37 prevents formation of condensate-organized ectopic spindle poles to ensure mitotic fidelity

Franz Meitinger et al. J Cell Biol. .

Abstract

Centrosomes are composed of a centriolar core surrounded by pericentriolar material that nucleates microtubules. The ubiquitin ligase TRIM37 localizes to centrosomes, but its centrosomal roles are not yet defined. We show that TRIM37 does not control centriole duplication, structure, or the ability of centrioles to form cilia but instead prevents assembly of an ectopic centrobin-scaffolded structured condensate that forms by budding off of centrosomes. In ∼25% of TRIM37-deficient cells, the condensate organizes an ectopic spindle pole, recruiting other centrosomal proteins and acquiring microtubule nucleation capacity during mitotic entry. Ectopic spindle pole-associated transient multipolarity and multipolar segregation in TRIM37-deficient cells are suppressed by removing centrobin, which interacts with and is ubiquitinated by TRIM37. Thus, TRIM37 ensures accurate chromosome segregation by preventing the formation of centrobin-scaffolded condensates that organize ectopic spindle poles. Mutations in TRIM37 cause the disorder mulibrey nanism, and patient-derived cells harbor centrobin condensate-organized ectopic poles, leading us to propose that chromosome missegregation is a pathological mechanism in this disorder.


Figures

Figure 1.
Figure 1.
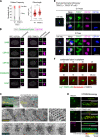
Consequences of TRIM37 loss in interphase RPE1 cells and mulibrey nanism patient-derived fibroblasts. (A) Schematic of TRIM37, which has a RING–B-box–coiled-coil (RBCC) ubiquitin ligase domain. Mutation of catalytic Cys18 to Arg (Ligmut TRIM37) disrupts ligase activity. (B) Expansion microscopy of centrioles colabeled for acetylated tubulin and the distal centriole component CEP290. Normal centrioles at different cell cycle stages and rare aberrant centriolar configurations are shown in TRIM37Δ RPE1 cells. Scale bar, 2 µm. (C) Quantification of mother centriole length from expansion microscopy of the indicated conditions. Error bars represent standard deviation. n, number of centrioles; ns, not significant, based on a t test. (D) Quantification of centriole number for the indicated cell lines following expansion microscopy as in B. Normal G1, S, G2, and M centriolar configurations were counted as “2 (single or duplicated)”. For B–D, cells were expanded twice with similar results; images and quantification of centriole length are from one experiment, and the centriole number data is pooled from both experiments. (E) Analysis of ciliogenesis, assessed by ARL13B labeling, in control RPE1 and TRIM37Δ RPE1 cells. Scale bar, 10 µm. The experiment was performed twice, once in triplicate and once in duplicate, with similar results; ciliation frequency from one experiment is shown here and from the second experiment in Fig. S1 A. (F) Immunostaining of TRIM37Δ and control USP28Δ RPE1 cells for centrobin and PLK4. Scale bars, 5 µm and 1 µm (insets). (G) Quantification of immunofluorescence signals at centrosomes in control USP28Δ cells and at centrosomes and condensates in TRIM37Δ cells. The signal for both centrosomes in a cell was measured together. Values were normalized relative to the mean centrosomal signal in USP28Δ cells; inset in the centrobin graph shows centrosome signals plotted on a different y-axis scale. Mean and 95% confidence interval (CI) are plotted on top of individual values; P value is from an unpaired t test. The condensate signal values plotted here are the same as those shown in Fig. S4 B (−Dox). Experiments in F and G were repeated twice; images and quantification are from one experiment. (H) Immunostaining of control and mulibrey nanism patient-derived fibroblasts. Scale bars, 5 µm and 1 µm (insets). The experiment was performed once; data for each cell line were pooled from three replicate wells imaged in parallel. (I) Localization of mNG-fused TRIM7 (WT or Ligmut) expressed in TRIM37Δ cells. TRIM37 activity reduces its own levels; hence, the signal for WT TRIM37-mNG was enhanced to show centrosomal localization. Scale bars, 5 and 1 µm (insets). The experiment was performed once; an equivalent experiment with similar results was performed using an HA tag shown in (Meitinger et al., 2020). (J) Top: Schematic of condensate observed in TRIM37Δ RPE1 cells and mulibrey nanism patient fibroblasts. Bottom: Summary of the localization of centrosomal components in TRIM37Δ cells; components shown in brackets localize to centriolar satellites. Analysis of CPAP, CEP63, CEP135, PCM1, KIAA0753, and CCDC14 is from Meitinger et al. (2020) and was conducted with PLK4 colabeling. In F, H, and I, centrosomes (white arrowheads) and the condensate (yellow arrows) are indicated, and numbers below images indicate percentage of cells with a condensate.
Figure S1.
Figure S1.
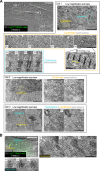
Analysis of TRIM37 localization and additional characterization of phenotypes of TRIM37Δ RPE1 cells. (A) Independent experiment analyzing ciliation frequency (left) and quantification of primary cilium length (right). n, number of cells analyzed; median and 95% CI are shown on top of individual data points in the right graph. The experiment was performed twice, the first experiment in triplicate and the second experiment in duplicate, with similar results; ciliation frequency and cilium length quantified from the second experiment are shown here, and ciliation frequency from the first experiment is shown in Fig. 1 E. (B) Immunofluorescence of centrobin and the indicated centrosomal components in USP28Δ and TRIM37Δ RPE1 cells. Scale bars, 5 µm (1 µm in insets). The experiment was performed once. (C) Expanded view of CLEM analysis of the cell shown in Fig. 2 B. Additional serial sections of the condensate and centrosome, a low-magnification EM view, and a higher-magnification view of the condensate are shown along with replication of the images shown in Fig. 2 B. White scale bar, 20 µm. Black scale bars: low magnification view, 2 µm; condensate and centrosome serial sections, 0.5 µm; zoomed-in view of punctate sheet condensate, 0.1 µm. (D) 3D STORM of condensates labeled with centrobin or PLK4. Reference widefield images are on the left. The STORM images are color coded for depth. Scale bars, 10 µm (widefield), 0.5 µm (STORM). Experiment performed twice with similar results; images are from one experiment. Red arrows indicate that the images on the bottom are higher magnification views of the corresponding regions of the images on top. (E) TRIM37-mNG localization at centrosomes visualized using SIM. CEP152 marks the proximal end of centrioles. CEP164 marks the distal end of the mother centriole. TRIM37 is broadly localized to the centrosome; it does not concentrate in a specific subdomain. Scale bars, 1 µm. The experiment was performed twice with similar results; images are from one experiment. mag, magnification. (F) Rare example of condensate fusion observed by live imaging of Ligmut TRIM37-mNG expressed in TRIM37Δ cells. The fused condensate retains an elongated shape. Scale bar, 5 µm.
Figure 2.
Figure 2.
CLEM of TRIM37Δ cells expressing mNG-fused Ligmut TRIM37. (A) Top left: Overlay of DIC and mNG fluorescence channels for three cells analyzed by serial section EM. Colored boxes in low-magnification (1,900×) views indicate the mNG-labeled condensate and the centrosome. Higher-magnification views (11,000×) of serial sections through the condensates reveal a highly ordered striated structure; a zoomed-in view shows regularly spaced stripes ∼90 nm apart; n, number of measurements. In cell 3, the condensate is associated with a centrosome. (B) Left: DIC-mNG overlay of a cell with a condensate close to a centrosome; this cell is in early mitosis. High-magnification view (11,000×) reveals a sheet-like object composed of hexagonally packed electron-dense puncta; the bottom part of the condensate appears to narrow and transition to the striated pattern seen in A. White scale bars in DIC-mNG overlay images, 20 µm. Black scale bars in EM images: low magnification, 2 µm; condensate and centrosome serial sections, 0.5 µm; zoomed-in view, 0.1 µm. S, section.
Figure 3.
Figure 3.
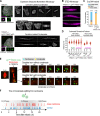
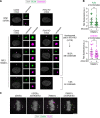
Condensates exhibit two related types of structural organization and form by budding off of centrosomes. (A) Exp-SIM of condensates in TRIM37Δ cells and in TRIM37Δ cells expressing Ligmut TRIM37 immunostained for centrobin. Widefield images are shown on the left; black-and-white images are examples of condensates from different cells. Surface rendering of a condensate in a TRIM37Δ cell is also shown. Scale bars: widefield, 20 µm and 2 µm (panels below image); Exp-SIM, 2 µm. (B) STED microscopy images showing the linear, striated condensates. Scale bars, 0.5 µm. Experiment performed three times with similar results. (C) Quantification of condensate morphologies (see A for example images) from the Exp-SIM analysis. n, number of condensates. The experiment shown in A and C was performed twice with similar results; data shown are from one experiment. (D) Quantification of interstripe or interpuncta distance measured using different methods; n, number of measurements. 10th–90th percentile box-and-whiskers plots with outliers are shown. (E) Live imaging of Ligmut TRIM37-mNG-labeled condensates in a TRIM37Δ cell expressing mRuby-fused MAP4 microtubule-binding domain to label microtubules; the centrosome (cyan arrowhead) and the condensate (yellow arrow) are indicated. Scale bars, 5 µm. Times are in minutes. (F) Summary of timing of condensate splitting from the centrosome in 24 imaged untreated cells (blue arrows) and 23 imaged cells acutely treated with centrinone (red arrows). Time is in hours relative to mitosis of each mother cell. The experiment shown in E and F was performed once; data for each condition was pooled from two replicate wells imaged in parallel.
Figure 4.
Figure 4.
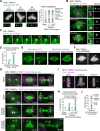
Condensates form ectopic spindle poles during mitosis in TRIM37Δ RPE1 and mulibrey nanism patient cells. (A) Left: Expansion microscopy images of mitotic TRIM37Δ RPE1 cells labeled for acetylated tubulin showing three mitotic configurations. Right: Quantification of mitotic configurations in the indicated cell lines; note that the rarest category, multipolar with a small acetylated tubulin focus, is marked in blue. Scale bars, 20 µm and 2 µm (insets). The experiment was performed three times; quantification was of the pooled data. (B) Images of mitotic cells at different stages stained for microtubules, centrobin, and CEP192; centrosomes (white arrowheads) and condensates (yellow arrows) are marked. Scale bars, 5 µm and 2 µm (insets). (C) Z sections spaced 0.2 µm apart through a metaphase condensate. Scale bar, 2 µm. The experiment in B and C was performed three times. (D) Quantification of condensate-associated ectopic MTOCs in mitotic TRIM37Δ cells. n, number of condensates. (E) Control and mulibrey nanism primary fibroblasts labeled for microtubules and PLK4 (left) or centrobin (right). The condensate (arrows) is marked. Scale bar, 5 µm. Each experiment was performed once. (F) Stills from live imaging analysis of microtubules labeled by expression of mRuby-MAP4-MBD in TRIM37Δ RPE1 cells. Images are of spindles in two different cells. Arrow points to an ectopic spindle pole. Scale bar, 10 µm. The experiment was performed once. (G) Stills from live imaging of TRIM37Δ cells expressing mRuby-MAP4-MBD (pseudocolored green) and WT TRIM37-mNG or Ligmut TRIM37-mNG (pseudocolored magenta). Three observed phenotypes of mitotic TRIM37Δ cells with a Ligmut TRIM37-mNG-labeled condensate (arrows) are shown. Times are in minutes; 0 min is the first time point after nuclear envelope breakdown. Scale bars, 5 µm. (H) Frequency of ectopic spindle poles observed in the indicated conditions analyzed by live imaging of microtubules; cells that exhibited eventual multipolar segregation are indicated. n, number of imaged cells. For G and H, the data from three independent experiments were pooled. (I) Immunostaining of the three configurations observed for mitotic cells with a condensate (arrows) and the normal number of two centrosomes. Scale bar, 5 µm. (J) Relative frequency of the three configurations shown in I. For I and J, the experiment was performed once; data were pooled from seven replicate wells imaged in parallel.
Figure S2.
Figure S2.
Analysis of centrosomal component localization to centrobin condensate-based ectopic spindle poles and microtubule nucleation activity of mitotic condensates following microtubule depolymerization. (A) Analysis of centrosomal component localization in mitotic TRIM37Δ cells with an ectopic condensate-based spindle pole. Scale bars, 5 µm and 1 µm (insets). (B) Microtubule regrowth analysis comparing control RPE1 and TRIM37Δ RPE1 mitotic cells. The protocol used for this analysis is schematized on the top. Cells were plated overnight (ON), chilled on ice for 40 min, and fixed (0 min) or warmed with 37°C medium for 1 min and then fixed (1 min). Example images of prophase and prometaphase/metaphase stage cells for the 0-min and 1-min conditions are shown. In mitotic TRIM37Δ cells, condensates that nucleated microtubules and condensates that did not were both observed; quantification of the ability of condensates in TRIM37Δ cells to nucleate microtubules after 1 min rewarming is plotted below the images. Scale bars, 10 µm and 2 µm (insets). The experiment was performed once.
Figure 5.
Figure 5.
Condensate-based ectopic spindle poles cause chromosome missegregation. (A) Fixed analysis of chromosome segregation in anaphase-to-telophase stage cells. Left: Images of multipolar segregation and lagging chromosomes; the condensate (arrows) is marked. Graph on the right plots the frequency of these events in control and TRIM37Δ RPE1 cells. Scale bar, 5 µm. Pooled data from six independent samples. (B) Analysis of micronuclei frequency. Left: Image of a cell with a micronucleus (arrow). Right: Graph of results from three experiments together with the mean; error bars represent standard deviation, and ntot is the total number of cells scored. Scale bar, 5 µm. (C) FISH analysis of chromosomes 17 and 18 in telophase cells. Left: Example images of different classes of telophase figures observed. Right: Quantification of the different categories. The experiment was performed once. Scale bar, 10 µm.
Figure S3.
Figure S3.
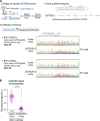
Strategy used to engineer inducible CNTROB knockout and validation of knockout by genotyping and centrosome immunofluorescence. (A) Strategy used to engineer iCNTROB KO in TRIM37Δ and USP28Δ RPE1 cells (i) and details of the CNTROB gRNA, indicating target site in the CNTROB locus (ii). Note that both cell lines have in situ mNG-tagged CEP192. To validate the efficacy of the knockout, tracking of indels by decomposition (TIDE) analysis (Brinkman et al., 2014) was conducted 4 d after induction with 1 µM doxycycline. In both cell lines, ∼80% indels were observed in the induced population. (B) Quantification of centrobin signal at centrosomes 4 d after induction of the knockout. Mean and 95% CI are plotted on top of measurements of individual centrosome pairs (the signal for both centrosomes in a cell was measured together); P value is from an unpaired t test. Experiment performed twice; data shown is from one experiment.
Figure 6.
Figure 6.
Centrobin is required to form the condensate but not centrin-containing foci in TRIM37Δ cells. (A) Localization of centrobin and PLK4 in the indicated conditions; centrosomes (white arrowheads) and condensates (yellow arrow) are indicated. The strategy to inducibly knock out CNTROB (iCNTROB KO) and efficacy of the knockout are shown in Fig. S3 A. Graph on the right plots frequency of condensates with and without addition of doxycycline to induce CNTROB KO. Scale bars, 5 µm and 1 µm (insets). Experiment was performed three times with similar results; data shown are from one experiment. (B) Localization of PLK4 and centrin in the indicated conditions; centrosomes (white arrowheads) and condensates (yellow arrow) are indicated. Graphs below plots the frequency of cells with centrin foci (left) and the number of centrin foci per cell (right). Scale bars, 5 µm and 1 µm (insets). Since iCNTROB KO is not 100% efficient, only cells that lacked centrosomal centrobin were quantified in the (+) condition in A and B. The experiment was performed once. (C) Schematics summarizing independent suppression of the condensate and centrin foci by TRIM37.
Figure S4.
Figure S4.
Analysis of the inducible PLK4 knockout and of centrin in the inducible CNTROB knockout. (A) Immunofluorescence analysis of iPLK4 KO after 4 d induction. At this time point, the majority of cells (73.5% in USP28Δ RPE1 (n = 181) and 71% in TRIM37Δ RPE1 (n = 186) are acentrosomal, indicating loss of PLK4 function. No focal localization of PLK4 or centrobin is observed in acentrosomal USP28Δ RPE1 cells generated by inducible PLK4 knockout. In acentrosomal TRIM37Δ RPE1 cells generated by inducible PLK4 KO, 11.8% have no condensate, whereas the rest have a condensate of varying size that contains both PLK4 and centrobin. Scale bars, 5 µm and 1 µm (insets). (B) Quantification of PLK4 and centrobin signal at condensates that persist after 4-d inducible PLK4 knockout in TRIM37Δ RPE1 cells. All of the analyzed cells were acentrosomal, indicating sufficient loss of PLK4 function to prevent centriole duplication. Mean and 95% CI are plotted on top of the individual values. Both PLK4 and centrobin are reduced at the condensates following PLK4 knockout (P values from unpaired t tests; **, P < 0.01). Note that the control (−Dox) data for condensates are the same as that shown in Fig. 1 G (analysis of this pair of USP28Δ and TRIM37Δ cell lines, ODCL0079 and ODCL0080, is reported in Fig. 1 G without Cas9 induction). The experiment shown in A and B was performed three times with similar results; data shown are from one experiment. (C) Centrin localization in mitotic control USP28Δ and TRIM37Δ cells following inducible knockout of CNTROB. The centrobin condensate is no longer detected in TRIM37Δ cells, but ectopic centrin foci (orange arrows) persist. Note that centrin is also present at centrosomes (white arrowheads). Scale bar, 5 µm. The experiment was performed three times with similar results; data shown are from one experiment.
Figure 7.
Figure 7.
Centrobin removal suppresses ectopic spindle pole formation in TRIM37Δ cells. (A) Images of mitotic cells labeled for microtubules, centrobin, and DNA for the indicated conditions. Scale bar, 5 µm. (B) Quantification of ectopic spindle pole frequency for the indicated conditions. The experiment was performed once. (C) Stills from live imaging of mitotic chromosome dynamics for the indicated conditions; time 0 is nuclear envelope breakdown (NEBD). Transient multipolarity is evident in the chromosome configuration (arrow) in a subset of TRIM37Δ cells. Scale bar, 10 µm. (D) Quantification of transient multipolarity and multipolar segregation (left graph) and of mitotic duration (right graph), defined as the time from NEBD to chromosome decondensation. Mean and 95% CI for mitotic duration are plotted on top of the values for individual cells; P values are from unpaired t tests. The experiment shown in C was performed twice with similar outcomes; data from one experiment are quantified in D. ****, P < 0.0001.
Figure 8.
Figure 8.
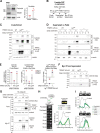
TRIM37 interacts with and ubiquitinates centrobin. (A) Immunoblotting of centrobin in the indicated cell lines. Graph on right plots centrobin levels relative to the mean control value (n = 3). (B) Schematic of coexpression-based analysis of regulation of centrobin by TRIM37 shown in C–G. (C) Immunoblotting of crude extracts with the indicated antibodies. (D) Supernatant (S) and pellet (P) fractions immunoblotted with the indicated antibodies. α-tubulin fractionates into the supernatant, as expected for extracts prepared after cold treatment. Even under the denaturing conditions used, centrobin and Ligmut TRIM37 were not consistently quantitatively recovered from the pellet. (E) Band signal intensity values from two independent experiments of total centrobin in crude extract (left), relative centrobin enrichment in pellet (middle), and relative Ligmut TRIM37 enrichment in pellet; the Ligmut TRIM37 pellet enrichment plot has a logarithmic y axis. Sup, supernatant. (F) Anti-Myc and Anti-FLAG immunoblotting of anti-Myc immunoprecipitates (IP). (G) Centrobin ubiquitination by TRIM37; a plasmid encoding HA-ubiquitin was included in the coexpression. The input shown is the crude extract. (H and I) FRAP analysis of Ligmut TRIM37-mNG localized to condensates in TRIM37Δ cells. In H, multiple time point images and quantification of signal intensity along a 10-pixel-wide line is shown. The intensity value at the left most position before the condensate was used as the background and subtracted; after background subtraction, all pixel values were normalized by dividing by the average prebleach signal. In I, selected images are shown above the linescan plots. Images of the condensates from individual time-lapse movie frames were cropped and rotated before montaging. Scale bars, 1 µm. The experiment was performed five times with similar results; three examples are shown. α-Tubulin serves as a loading control in A, C, D, and G. high exp., higher exposure; low exp., lower exposure.
Figure S5.
Figure S5.
Additional coexpression analysis of centrobin regulation by TRIM37. (A–C) Results of an independent experiment assessing the effect of coexpressing TRIM37 (WT versus Ligmut) and centrobin on centrobin levels (A) and relative solubility (B). In addition, interaction of Ligmut TRIM37 with centrobin was analyzed (C). Quantification of levels and relative solubility is shown in Fig. 8 E. (D) Interaction of WT or Ligmut TRIM37 with centrobin was analyzed in MG132-treated cells using the protocol schematized on the top. Anti-Myc and Anti-FLAG immunoblotting of anti-Myc immunoprecipitates is shown on the bottom. A plasmid encoding HA-ubiquitin was included in the coexpression. α-Tubulin serves as a loading control in A, B, and D.
Figure 9.
Figure 9.
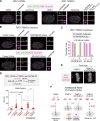
PLK4-scaffolded foci that accelerate acentrosomal mitosis in TRIM37Δ cells are centrobin-independent. (A and B) Immunostaining and fluorescent signal of in situ–tagged CEP192-mNG in USP28Δ and TRIM37Δ RPE1 cells treated with DMSO or centrinone (A) and additionally treated with doxycycline to induce CNTROB or PLK4 knockout (B). Scale bars, 5 µm and 1 µm (insets). (C) Graph of the percentage of cells with condensates and CEP192-PLK4 foci in the indicated conditions. The experiment shown in A and B was performed twice with similar outcomes; data from one experiment are quantified in C. (D) Quantification of mitotic duration, measured as in Fig. 7 D, for the indicated conditions. Mean and 95% CI are plotted on top of the individual values; P values are from t tests. ****, P < 0.0001. The experiment was performed twice with similar outcomes; data from one experiment are quantified. (E) Images of acentrosomal spindles in centrinone-treated TRIM37Δ cells, with and without centrobin. The centrobin-scaffolded condensate (yellow arrow) and the PLK4-scaffolded foci (cyan arrowheads) are marked. Scale bar, 5 µm. The experiment was performed twice with similar outcomes. (F) Schematic summary of analysis of acentrosomal mitosis following centrinone treatment. The PLK4-scaffolded foci, and not the centrobin-scaffolded condensate, improve acentrosomal mitosis following centrinone treatment.
Figure 10.
Figure 10.
Model for TRIM37 function in ensuring accurate chromosome segregation and its relevance to mulibrey nanism. In the absence of TRIM37 activity, an ectopic centrobin-scaffolded condensate and centrin foci are formed. Approximately 25% of centrobin-scaffolded condensates assemble an ectopic spindle pole, resulting in both multipolar segregation and an elevated rate of lagging chromosomes. We propose that these low-frequency segregation errors caused by the centrobin-scaffolded ectopic spindle pole are major contributors to the pathology of mulibrey nanism. The centrin foci observed in TRIM37Δ cells are independent of the centrobin-scaffolded condensate; the functional impact of their formation remains to be elucidated.

References

    1. Avela, K., Lipsanen-Nyman M., Idänheimo N., Seemanová E., Rosengren S., Mäkelä T.P., Perheentupa J., Chapelle A.D., and Lehesjoki A.E.. 2000. Gene encoding a new RING-B-box-Coiled-coil protein is mutated in mulibrey nanism. Nat. Genet. 25:298–301. 10.1038/77053 - DOI - PubMed
    1. Aziz, K., Sieben C.J., Jeganathan K.B., Hamada M., Davies B.A., Velasco R.O.F., Rahman N., Katzmann D.J., and van Deursen J.M.. 2018. Mosaic-variegated aneuploidy syndrome mutation or haploinsufficiency in Cep57 impairs tumor suppression. J. Clin. Invest. 128:3517–3534. 10.1172/JCI120316 - DOI - PMC - PubMed
    1. Balestra, F.R., Strnad P., Flückiger I., and Gönczy P.. 2013. Discovering regulators of centriole biogenesis through siRNA-based functional genomics in human cells. Dev. Cell. 25:555–571. 10.1016/j.devcel.2013.05.016 - DOI - PubMed
    1. Balestra, F.R., Domínguez-Calvo A., Wolf B., Busso C., Buff A., Averink T., Lipsanen-Nyman M., Huertas P., Ríos R.M., and Gönczy P.. 2021. TRIM37 prevents formation of centriolar protein assemblies by regulating Centrobin. eLife. 10:e62640. 10.7554/eLife.62640 - DOI - PMC - PubMed
    1. Banterle, N., and Gönczy P.. 2017. Centriole Biogenesis: From Identifying the Characters to Understanding the Plot. Annu. Rev. Cell Dev. Biol. 33:23–49. 10.1146/annurev-cellbio-100616-060454 - DOI - PubMed

Publication types