

Capturing dynamic relevance in Boolean networks using graph theoretical measures
- PMID: 33983406
- PMCID: PMC8545349
- DOI: 10.1093/bioinformatics/btab277
Capturing dynamic relevance in Boolean networks using graph theoretical measures
Abstract
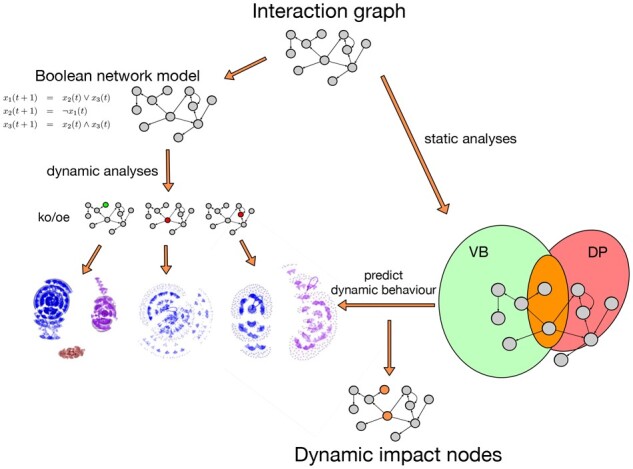
Motivation: Interaction graphs are able to describe regulatory dependencies between compounds without capturing dynamics. In contrast, mathematical models that are based on interaction graphs allow to investigate the dynamics of biological systems. However, since dynamic complexity of these models grows exponentially with their size, exhaustive analyses of the dynamics and consequently screening all possible interventions eventually becomes infeasible. Thus, we designed an approach to identify dynamically relevant compounds based on the static network topology.
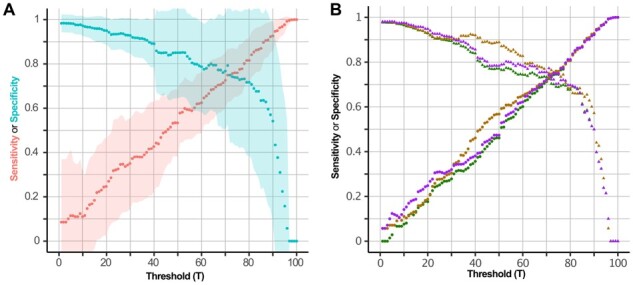
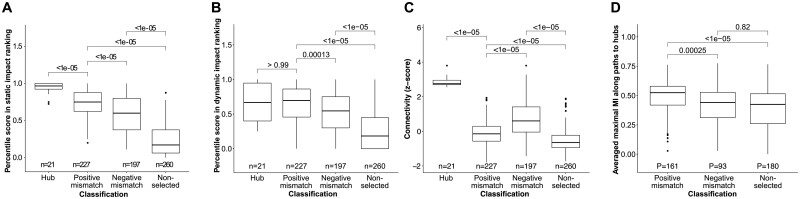
Results: Here, we present a method only based on static properties to identify dynamically influencing nodes. Coupling vertex betweenness and determinative power, we could capture relevant nodes for changing dynamics with an accuracy of 75% in a set of 35 published logical models. Further analyses of the selected compounds' connectivity unravelled a new class of not highly connected nodes with high impact on the networks' dynamics, which we call gatekeepers. We validated our method's working concept on logical models, which can be readily scaled up to complex interaction networks, where dynamic analyses are not even feasible.
Availability and implementation: Code is freely available at https://github.com/sysbio-bioinf/BNStatic.
Supplementary information: Supplementary data are available at Bioinformatics online.
© The Author(s) 2021. Published by Oxford University Press.
Figures
Comment in
-
Response to the letter to the editor: On the feasibility of dynamical analysis of network models of biochemical regulation.Bioinformatics. 2022 Jul 11;38(14):3676. doi: 10.1093/bioinformatics/btac318. Bioinformatics. 2022. PMID: 35554499 Free PMC article. No abstract available.
-
On the feasibility of dynamical analysis of network models of biochemical regulation.Bioinformatics. 2022 Jul 11;38(14):3674-3675. doi: 10.1093/bioinformatics/btac360. Bioinformatics. 2022. PMID: 35640987 Free PMC article. No abstract available.
Similar articles
-
GatekeepR: an R Shiny application for the identification of nodes with high dynamic impact in Boolean networks.Bioinformatics. 2024 Jan 2;40(1):btae007. doi: 10.1093/bioinformatics/btae007. Bioinformatics. 2024. PMID: 38195862 Free PMC article.
-
CANTATA-prediction of missing links in Boolean networks using genetic programming.Bioinformatics. 2022 Oct 31;38(21):4893-4900. doi: 10.1093/bioinformatics/btac623. Bioinformatics. 2022. PMID: 36094334 Free PMC article.
-
ATEN: And/Or tree ensemble for inferring accurate Boolean network topology and dynamics.Bioinformatics. 2020 Jan 15;36(2):578-585. doi: 10.1093/bioinformatics/btz563. Bioinformatics. 2020. PMID: 31368481
-
Logical Reduction of Biological Networks to Their Most Determinative Components.Bull Math Biol. 2016 Jul;78(7):1520-45. doi: 10.1007/s11538-016-0193-x. Epub 2016 Jul 14. Bull Math Biol. 2016. PMID: 27417985 Free PMC article.
-
Unsupervised construction of computational graphs for gene expression data with explicit structural inductive biases.Bioinformatics. 2022 Feb 7;38(5):1320-1327. doi: 10.1093/bioinformatics/btab830. Bioinformatics. 2022. PMID: 34888618 Free PMC article.
Cited by
-
Robust signalling entropy estimation for biological process characterisation.Brief Bioinform. 2025 May 1;26(3):bbaf269. doi: 10.1093/bib/bbaf269. Brief Bioinform. 2025. PMID: 40532109 Free PMC article.
-
GatekeepR: an R Shiny application for the identification of nodes with high dynamic impact in Boolean networks.Bioinformatics. 2024 Jan 2;40(1):btae007. doi: 10.1093/bioinformatics/btae007. Bioinformatics. 2024. PMID: 38195862 Free PMC article.
-
On the feasibility of dynamical analysis of network models of biochemical regulation.Bioinformatics. 2022 Jul 11;38(14):3674-3675. doi: 10.1093/bioinformatics/btac360. Bioinformatics. 2022. PMID: 35640987 Free PMC article. No abstract available.
-
Identification of dynamic driver sets controlling phenotypical landscapes.Comput Struct Biotechnol J. 2022 Apr 2;20:1603-1617. doi: 10.1016/j.csbj.2022.03.034. eCollection 2022. Comput Struct Biotechnol J. 2022. PMID: 35465155 Free PMC article.
References
-
- Chee F., Byron A. (2021) Network analysis of integrin adhesion complexes. In: Vicente-Manzanares, M. (ed.) The Integrin Interactome. Springer, New York, NY, USA, pp. 149–179. - PubMed
Grants and funding
LinkOut - more resources
Full Text Sources
Other Literature Sources
Miscellaneous
