. 2021 Aug 9;218(4):iyab073.
doi: 10.1093/genetics/iyab073.

Specific heparan sulfate modifications stabilize the synaptic organizer MADD-4/Punctin at Caenorhabditis elegans neuromuscular junctions

Affiliations

Specific heparan sulfate modifications stabilize the synaptic organizer MADD-4/Punctin at Caenorhabditis elegans neuromuscular junctions

Mélissa Cizeron et al. Genetics. .

Abstract

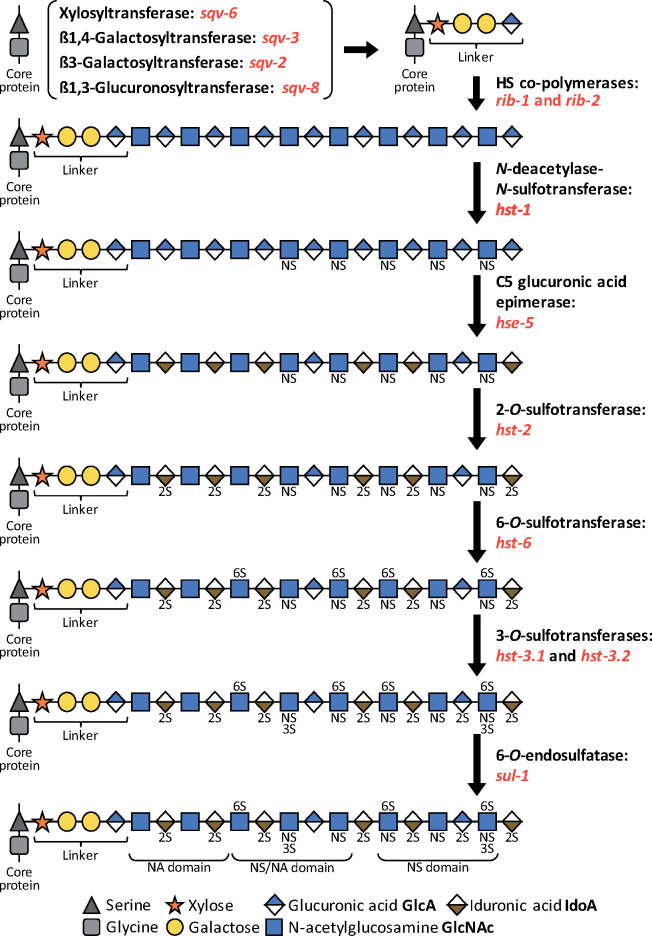
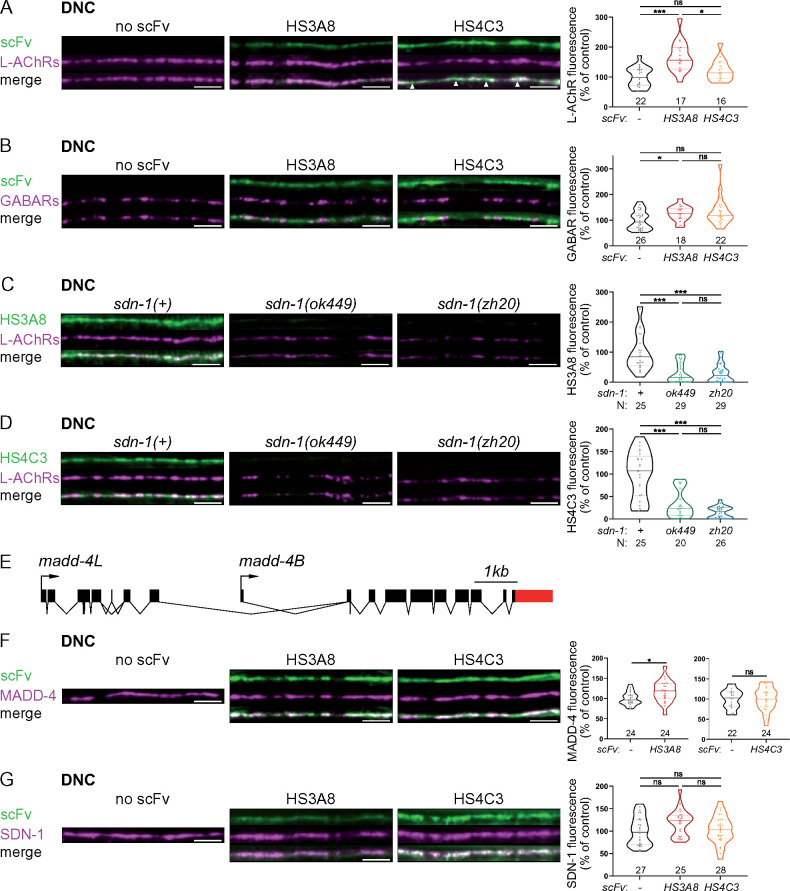
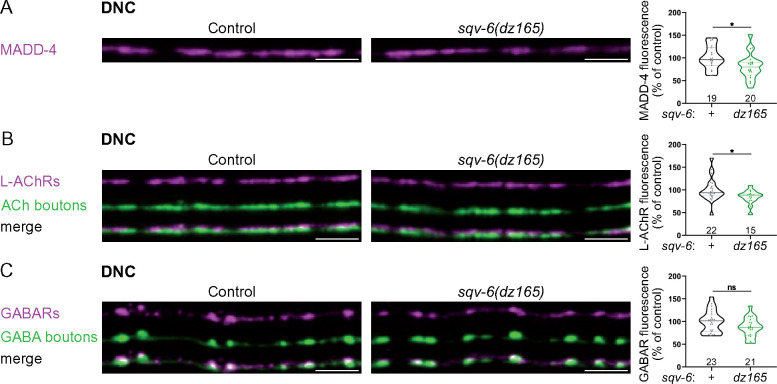
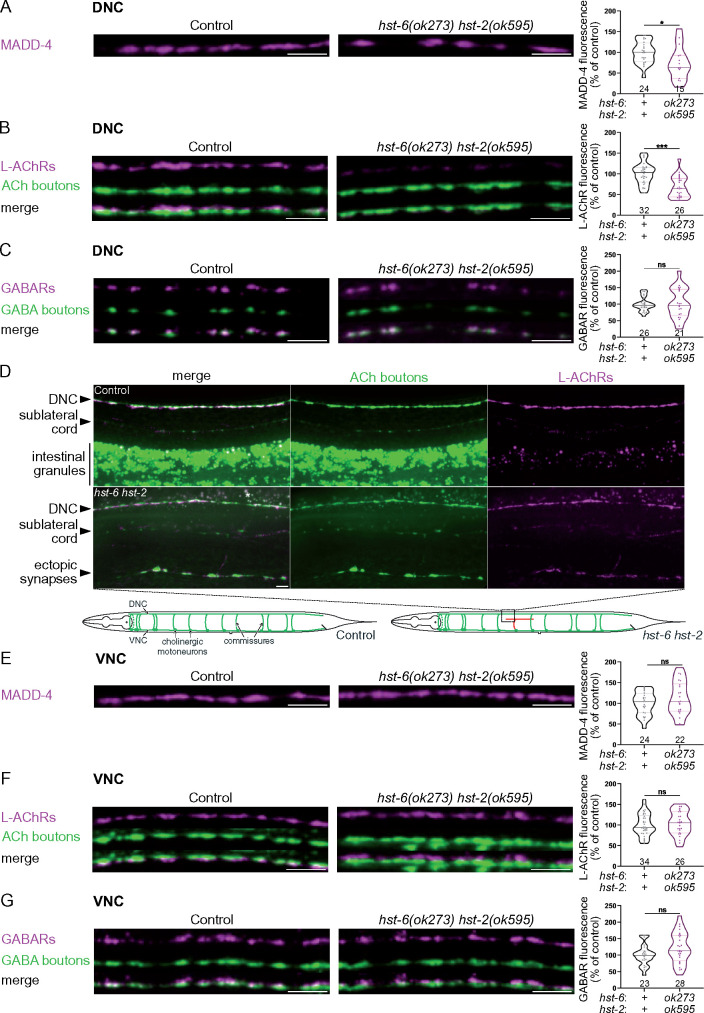
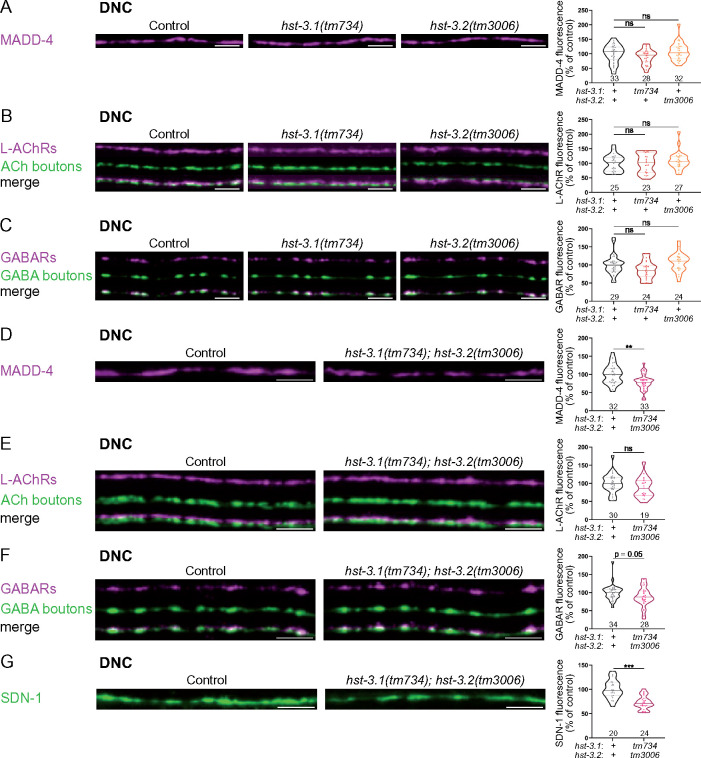
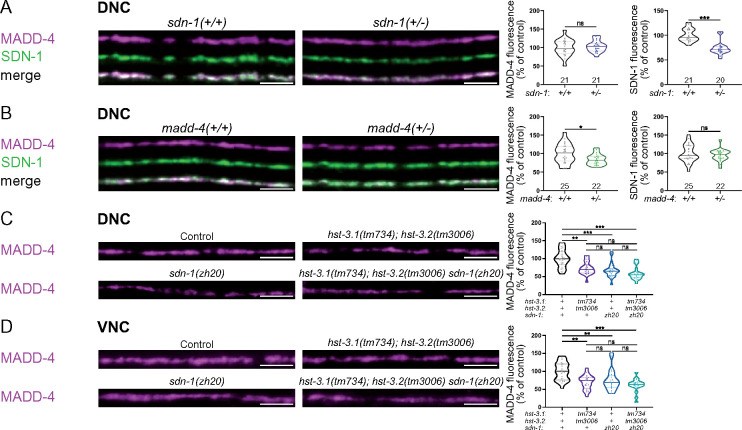
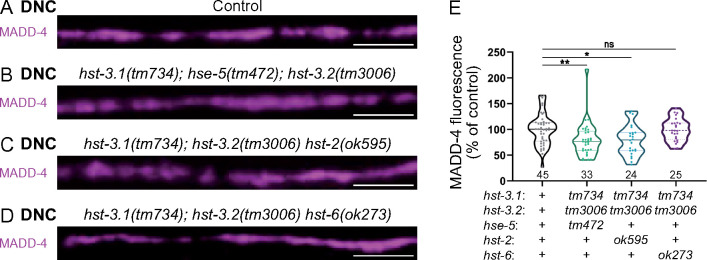
Heparan sulfate (HS) proteoglycans contribute to the structural organization of various neurochemical synapses. Depending on the system, their role involves either the core protein or the glycosaminoglycan chains. These linear sugar chains are extensively modified by HS modification enzymes, resulting in highly diverse molecules. Specific modifications of glycosaminoglycan chains may thus contribute to a sugar code involved in synapse specificity. Caenorhabditis elegans is particularly useful to address this question because of the low level of genomic redundancy of these enzymes, as opposed to mammals. Here, we systematically mutated the genes encoding HS modification enzymes in C. elegans and analyzed their impact on excitatory and inhibitory neuromuscular junctions (NMJs). Using single chain antibodies that recognize different HS modification patterns, we show in vivo that these two HS epitopes are carried by the SDN-1 core protein, the unique C. elegans syndecan ortholog, at NMJs. Intriguingly, these antibodies differentially bind to excitatory and inhibitory synapses, implying unique HS modification patterns at different NMJs. Moreover, while most enzymes are individually dispensable for proper organization of NMJs, we show that 3-O-sulfation of SDN-1 is required to maintain wild-type levels of the extracellular matrix protein MADD-4/Punctin, a central synaptic organizer that defines the identity of excitatory and inhibitory synaptic domains at the plasma membrane of muscle cells.

Keywords: C. elegans; 3-O-sulfotransferase; MADD-4/Punctin; heparan sulfate modification enzymes; heparan sulfate proteoglycan; synapse; synaptomatrix; syndecan.


Figures

Figure 1
Figure 1
Biosynthesis and modification of HS chains. HSPGs are composed of a core protein and linear GAG chain(s) attached at the level of serine residue(s). Prior to chain expansion, a tetrasaccharide linker is added on the core protein by four enzymes: a xylosyltransferase (sqv-6), a ß1,4-Galactosyltransferase (sqv-3), a ß3-Galactosyltransferase (sqv-2) and a ß1,3-Glucuronosyltransferase (sqv-8). Next, two co-polymerases (rib-1 and rib-2) synthetize the HS chain, which is composed of 50–150 repetitions of the disaccharides N-acetylglucosamine and glucuronic acid. Several modification enzymes can alter these chains. hst-1 deacetylates and adds a sulfate group to the nitrogen atom in N-acetylglucosamine. hse-5 catalyzes the C5 epimerization of the glucuronic acid into iduronic acid. hst-2 transfers a sulfate group in position 2 of the hexuronic acid. hst-6 transfers a sulfate group in position 6 of glucosamine residues. hst-3.1 and hst-3.2 transfer a sulfate group in position 3 of glucosamine residues. The 6-O-sulfatase sul-1 can then remove specific sulfate groups in position 6 of glucosamine residues. These modifications occur in a template free, yet nonrandom, manner and result in formation of different domains with specific properties and binding partners: N-acetylated (NA) domains, N-sulfated (NS) domains, and N-sulfated/N-acetylated (NA/NS) domains. This biosynthesis predominantly occurs in the Golgi apparatus, and some steps may occur simultaneously.
Figure 2
Figure 2
HS modifications carried by SDN-1 contribute to NMJ organization. (A, B) Confocal images of scFv antibodies coupled with GFP (green), together with L-AChRs (UNC-29-tagRFPt knock-in, magenta, panel A) or GABARs (UNC-49-tagRFPt knock-in, magenta, panel B) at the DNC of worms expressing none (left panels), HS3A8-GFP (middle panels) or HS4C3-GFP (right panels). Arrowheads indicate HS4C3 signal in-between L-AChR clusters (A). Quantifications show the L-AChR (A) or GABAR (B) fluorescence intensity at DNC in each genotype and results of Dunn’s multiple comparison tests. (C, D) Confocal images of scFv antibodies coupled with GFP (green; C, HS3A8-GFP; D, HS4C3-GFP), together with L-AChRs (UNC-29-tagRFPt knock-in, magenta) at the DNC of control (left), sdn-1(ok449) (middle) and sdn-1(zh20) (right) worms. Quantifications show the scFv fluorescence intensity (C, HS3A8-GFP; D, HS4C3-GFP) at DNC in each genotype and results of Dunn’s multiple comparison test. (E) Schematics of the madd-4 locus modified in the kr373 knock-in allele, resulting in C-terminal tagging of both MADD-4S and MADD-4L isoforms with TagRFP-T. (F) Confocal images of scFv antibodies coupled with GFP (green), together with MADD-4-tagRFPt knock-in (magenta) at the DNC of worms expressing none (left panels), HS3A8-GFP (middle panels) or HS4C3-GFP (right panels). Quantifications show the MADD-4 fluorescence intensity at DNC in each genotype and results of Mann–Whitney tests. (G) Confocal images of scFv antibodies coupled with GFP (green) and SDN-1-BFP knock-in (magenta ) at the DNC of worms expressing none (left panels), HS3A8-GFP (middle panels) or HS4C3-GFP (right panels). Quantifications show the SDN-1-BFP fluorescence intensity at DNC in each genotype and results of Dunn’s multiple comparison test. In all figures, data distribution in each group is represented as violin plots where the median is shown by a solid dark line, quartiles by two lighter lines and individual worms are represented by dots. In all figures, quantifications are represented as a percentage of the control group, N numbers are indicated above or below each genotype and significance of statistical tests is indicated as follows: ns, not significant, *P<0.05, **P<0.01, ***P<0.001. In all figures, scale bars are 5 µm.
Figure 3
Figure 3
sqv-6 is necessary for correct NMJ organization. (A) Confocal images of MADD-4-tagRFPt knock-in (magenta) at the DNC of control (left) and sqv-6(dz165) (right) worms. Quantifications show the MADD-4 fluorescence intensity at DNC in each genotype and results of Mann–Whitney test. (B) Confocal images of L-AChRs (UNC-29-tagRFPt knock-in, magenta) and cholinergic (ACh) boutons (SNB-1-BFP, green) at the DNC of control (left) and sqv-6(dz165) (right) worms. Quantifications show the L-AChR fluorescence intensity at DNC in each genotype and results of Mann–Whitney test. (C) Confocal images of GABARs (UNC-49-tagRFPt knock-in, magenta) and GABA boutons (SNB-1-GFP, green) at the DNC of control (left) and sqv-6(dz165) (right) worms. Quantifications show the GABAR fluorescence intensity at DNC in each genotype and results of Mann–Whitney test. Scale bars, 5 µm.
Figure 4
Figure 4
Postsynaptic NMJ organization is unchanged in hst-2 hst-6 double mutants. (A) Confocal images of MADD-4-tagRFPt knock-in (magenta) at the DNC of control and hst-6(ok273) hst-2(ok595) worms. Quantifications show the MADD-4 fluorescence intensity at DNC in each genotype and results of Mann–Whitney test. (B) Confocal images of L-AChRs (UNC-29-tagRFPt knock-in, magenta) and cholinergic (ACh) boutons (SNB-1-BFP, green) at the DNC of control and hst-6(ok273) hst-2(ok595) worms. Quantifications show the L-AChR fluorescence intensity at DNC in each genotype and results of Mann–Whitney test. (C) Confocal images of GABARs (UNC-49-tagRFPt knock-in, magenta) and GABA boutons (SNB-1-GFP, green) at the DNC of control and hst-6(ok273) hst-2(ok595) worms. Quantifications show the GABAR fluorescence intensity at DNC in each genotype and results of Mann–Whitney test. (D) Confocal images of L-AChRs (UNC-29-tagRFPt knock-in, magenta) and cholinergic (ACh) boutons (SNB-1-BFP, green) in controls (top panels) and hst-6(ok273) hst-2(ok595) worms (bottom panels), showing an example of commissures that did not reach the DNC and formed ectopic synapses outside the main and sublateral cords. * Indicates autofluorescent signal coming from intestinal granules as the intestine is located below the DNC in this image. The schematics show an example of defect of cholinergic motoneurons projections: in the control, cholinergic motoneurons are located ventrally and project axons in the VNC, as well as commissural axons toward the DNC. In hst-6(ok273) hst-2(ok595) mutants, commissural axons sometimes fail to reach the DNC and can form ectopic synapses, as illustrated here in red. The black square indicates the approximate location of the image shown above. (E) Confocal images of MADD-4-tagRFPt knock-in (magenta) at the VNC of control and hst-6(ok273) hst-2(ok595) worms. Quantifications show the MADD-4 fluorescence intensity at VNC in each genotype and results of Mann–Whitney test. (F) Confocal images of L-AChRs (UNC-29-tagRFPt knock-in, magenta) and cholinergic (ACh) boutons (SNB-1-BFP, green) at the VNC of control and hst-6(ok273) hst-2(ok595) worms. Quantifications show the L-AChR fluorescence intensity at VNC in each genotype and results of Mann–Whitney test. (G) Confocal images of GABARs (UNC-49-tagRFPt knock-in, magenta) and GABA boutons (SNB-1-GFP, green) at the VNC of control and hst-6(ok273) hst-2(ok595) worms. Quantifications show the GABAR fluorescence intensity at VNC in each genotype and results of Mann–Whitney test. Scale bars, 5 µm.
Figure 5
Figure 5
3-O-sulfation is required for the stabilization of MADD-4 and SDN-1 at the NMJs. (A) Confocal images of MADD-4-tagRFPt knock-in (magenta) at the DNC of control (left), hst-3.1(tm734) (middle) and hst-3.2(tm3006) (right) worms. Quantifications show the MADD-4 fluorescence intensity at DNC in each genotype and results of Dunn’s multiple comparison test. (B) Confocal images of L-AChRs (UNC-29-tagRFPt knock-in, magenta) and cholinergic (ACh) boutons (SNB-1-BFP, green) at the DNC of control (left), hst-3.1(tm734) (middle) and hst-3.2(tm3006) (right) worms. Quantifications show the L-AChR fluorescence intensity at DNC in each genotype and results of Dunn’s multiple comparison test. (C) Confocal images of GABARs (UNC-49-tagRFPt knock-in, magenta) and GABA boutons (SNB-1-GFP, green) at the DNC of control (left), hst-3.1(tm734) (middle) and hst-3.2(tm3006) (right) worms. Quantifications show the GABAR fluorescence intensity at DNC in each genotype and results of Dunn’s multiple comparison test. (D) Confocal images of MADD-4-tagRFPt knock-in (magenta) at the DNC of control and hst-3.1(tm734); hst-3.2(tm3006) worms. Quantifications show the MADD-4 fluorescence intensity at DNC in each genotype and results of Mann–Whitney test. (E) Confocal images of L-AChRs (UNC-29-tagRFPt knock-in, magenta) and cholinergic (ACh) boutons (SNB-1-BFP, green) at the DNC of control and hst-3.1(tm734); hst-3.2(tm3006) worms. Quantifications show the L-AChR fluorescence intensity at DNC in each genotype and results of Mann–Whitney test. (F) Confocal images of GABARs (UNC-49-tagRFPt knock-in, magenta) and GABA boutons (SNB-1-GFP, green) at the DNC of control and hst-3.1(tm734); hst-3.2(tm3006) worms. Quantifications show the GABAR fluorescence intensity at DNC in each genotype and results of Mann–Whitney test. (G) Confocal images of mNG-SDN-1 knock-in (green) at the DNC of control and hst-3.1(tm734); hst-3.2(tm3006) worms. Quantifications show the SDN-1 fluorescence intensity at DNC in each genotype and results of Mann–Whitney test. Scale bar, 5 µm.
Figure 6
Figure 6
3-O-sulfation of SDN-1 is required for stabilization of MADD-4 at NMJs. (A) Confocal images of MADD-4-tagRFPt knock-in (magenta) and mNG-SDN-1 knock-in (green) at the DNC of sdn-1(+/-) heterozygous worms. Quantifications show the MADD-4 (left) and SDN-1 (right) fluorescence intensity at DNC in each genotype and corresponding results of Mann–Whitney test. (B) Confocal images of MADD-4-tagRFPt knock-in (magenta) and mNG-SDN-1 knock-in (green) at the DNC of madd-4(+/-) heterozygous worms. Quantifications show the MADD-4 (left) and SDN-1 (right) fluorescence intensity at DNC in each genotype and corresponding results of Mann–Whitney test. (C, D) Confocal images of MADD-4-tagRFPt knock-in at the DNC (C) and VNC (D) of control, hst-3.1(tm734); hst-3.2(tm3006), sdn-1(zh20), and hst-3.1(tm734); hst-3.2(tm3006) sdn-1(zh20) worms. Quantifications show the MADD-4 fluorescence intensity at DNC (C) and VNC (D) in each genotype and corresponding results of Dunn’s multiple comparison test. Scale bar, 5 µm.
Figure 7
Figure 7
Removing 6-O-sulfation rescues MADD-4 levels in the absence of 3-O-sulfation. (A–D) Confocal images of MADD-4-tagRFPt knock-in (magenta) at the DNC of control (A) and triple mutants: hst-3.1(tm734); hse-5(tm472); hst-3.2(tm3006) (B), hst-3.1(tm734); hst-3.2(tm3006) hst-2 (ok595) (C), hst-3.1(tm734); hst-3.2(tm3006) hst-6(ok273) (D). (E) Quantifications show the MADD-4 fluorescence intensity at DNC in each genotype and results of Dunn’s multiple comparison test. Scale bar, 5 µm.

Similar articles

Cited by

References

    1. Ai X, Do A-T, Kusche-Gullberg M, Lindahl U, Lu K, et al. 2006. Substrate specificity and domain functions of extracellular heparan sulfate 6-O-endosulfatases, QSulf1 and QSulf2. J Biol Chem. 281:4969–4976. - PubMed
    1. Attreed M, Desbois M, van Kuppevelt TH, Bülow HE.. 2012. Direct visualization of specifically modified extracellular glycans in living animals. Nat Methods. 9:477–479. - PMC - PubMed
    1. Blanchette CR, Thackeray A, Perrat PN, Hekimi S, Bénard CY.. 2017. Functional requirements for heparan sulfate biosynthesis in morphogenesis and nervous system development in C. elegans, (A. D. Chisholm, Ed.). PLoS Genet. 13:e1006525. - PMC - PubMed
    1. Bülow HE, Hobert O.. 2004. Differential sulfations and epimerization define heparan sulfate specificity in nervous system development. Neuron. 41:723–736. - PubMed
    1. Condomitti G, de Wit J.. 2018. Heparan sulfate proteoglycans as emerging players in synaptic specificity. Front Mol Neurosci. 11:14. 10.3389/fnmol.2018.00014 - DOI - PMC - PubMed

Publication types

MeSH terms