. 2021 Aug 7;11(8):jkab168.
doi: 10.1093/g3journal/jkab168.

Natural variation in fecundity is correlated with species-wide levels of divergence in Caenorhabditis elegans

Affiliations

Natural variation in fecundity is correlated with species-wide levels of divergence in Caenorhabditis elegans

Gaotian Zhang et al. G3 (Bethesda). .

Abstract

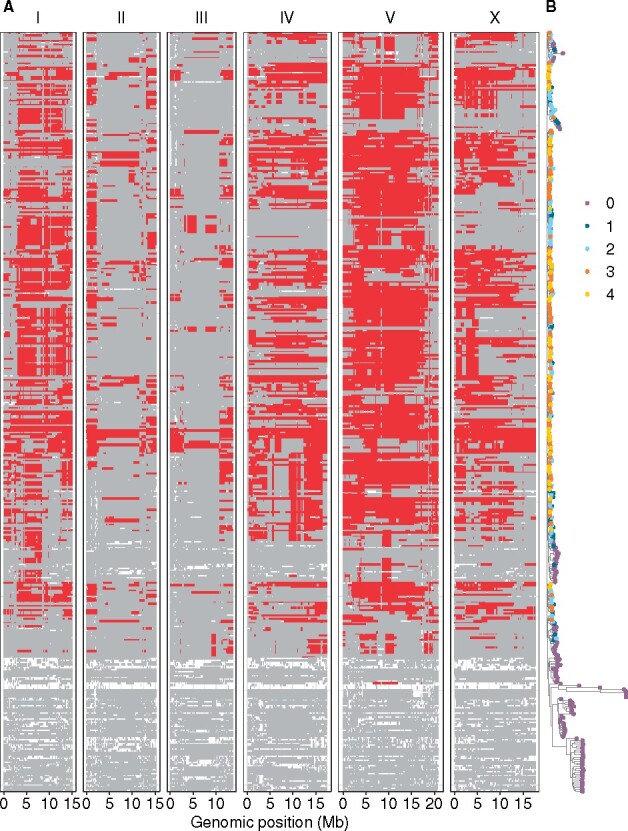
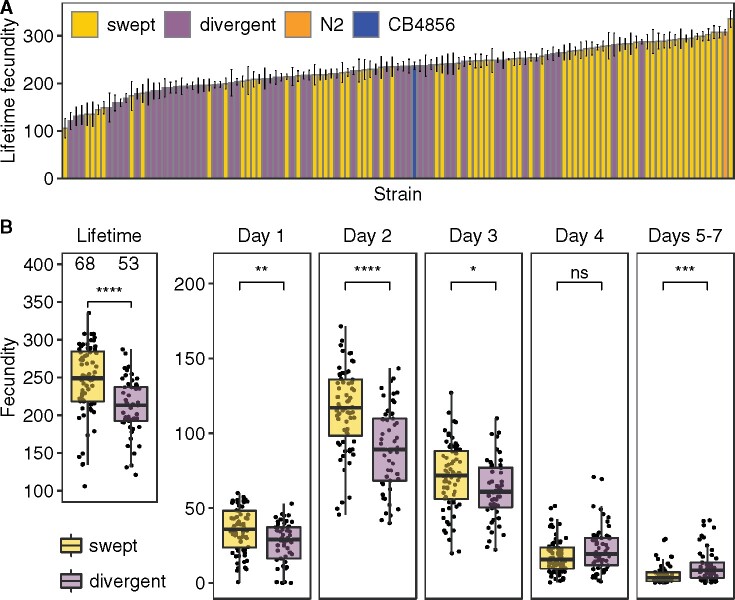
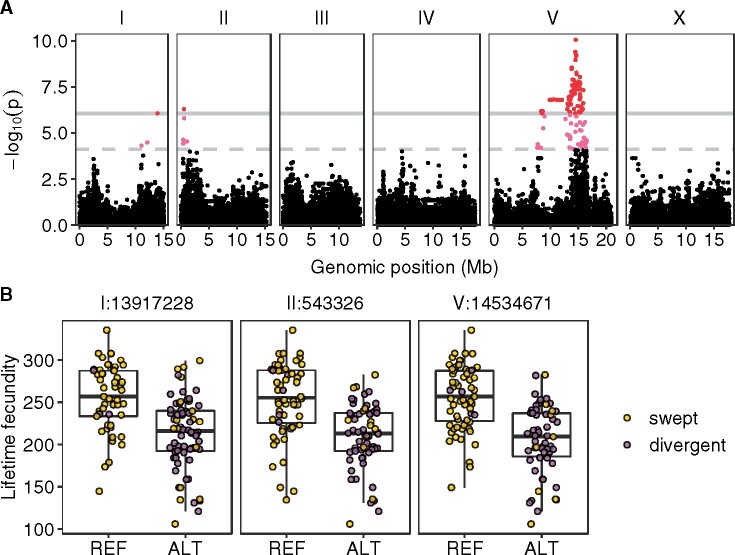
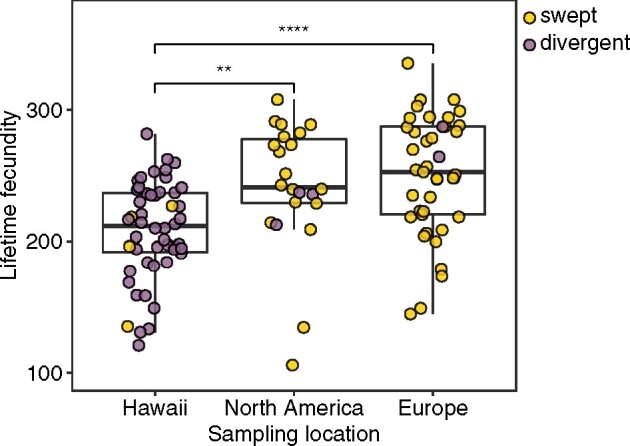
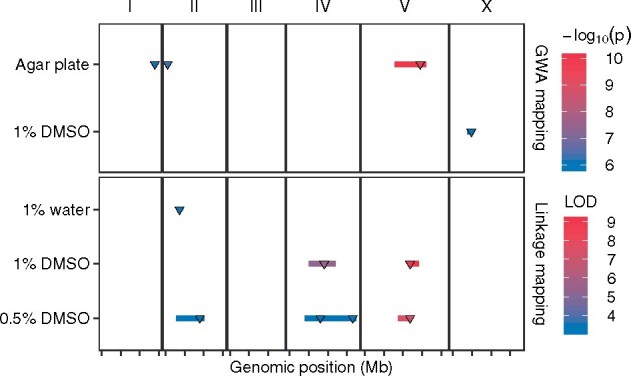
Life history traits underlie the fitness of organisms and are under strong natural selection. A new mutation that positively impacts a life history trait will likely increase in frequency and become fixed in a population (e.g., a selective sweep). The identification of the beneficial alleles that underlie selective sweeps provides insights into the mechanisms that occurred during the evolution of a species. In the global population of Caenorhabditis elegans, we previously identified selective sweeps that have drastically reduced chromosomal-scale genetic diversity in the species. Here, we measured the fecundity of 121 wild C. elegans strains, including many recently isolated divergent strains from the Hawaiian islands and found that strains with larger swept genomic regions have significantly higher fecundity than strains without evidence of the recent selective sweeps. We used genome-wide association (GWA) mapping to identify three quantitative trait loci (QTL) underlying the fecundity variation. In addition, we mapped previous fecundity data from wild C. elegans strains and C. elegans recombinant inbred advanced intercross lines that were grown in various conditions and detected eight QTL using GWA and linkage mappings. These QTL show the genetic complexity of fecundity across this species. Moreover, the haplotype structure in each GWA QTL region revealed correlations with recent selective sweeps in the C. elegans population. North American and European strains had significantly higher fecundity than most strains from Hawaii, a hypothesized origin of the C. elegans species, suggesting that beneficial alleles that caused increased fecundity could underlie the selective sweeps during the worldwide expansion of C. elegans.

Keywords: C. elegans; QTL; lifetime fecundity; natural variation; selective sweeps.


Figures

Figure 1
Figure 1
Swept chromosomes and genetic relatedness of wild C. elegans isotypes. (A) Sharing of the most common haplotypes (red) across the genome of C. elegans for 403 isotypes is shown. Genomic regions of unswept haplotypes (haplotypes other than the most common haplotypes) are colored gray. White segments are undetermined haplotypes in regions where no identical-by-descent groups were found (Crombie et al. 2019). The genomic position is plotted on the x-axis. Each row on the y-axis represents one of the 403 isotypes, ordered as their positions in (B). (B) A tree showing genetic relatedness of the 403 C. elegans isotypes, using 1,074,596 biallelic segregating sites, is shown. The tips of the tree are colored by the number of swept chromosomes (purple for zero, deep blue for one, light blue for two, orange for three, and gold for four) in each C. elegans isotype.
Figure 2
Figure 2
Natural variation in C. elegans fecundity. (A) A bar plot for lifetime fecundity (y-axis) of 121 wild C. elegans strains is shown. Strains on the x-axis are sorted by their MLF of two to five biological replicates. Error bars show standard errors of lifetime fecundity among replicates. The lab reference strain N2 and the Hawaii strain CB4856 are colored orange and blue, respectively; other strains are colored gold for swept strains and purple for divergent strains. (B) Comparisons of lifetime and daily fecundity between 68 swept strains (gold) and 53 divergent strains (purple) are shown as Tukey box plots. Statistical significance was calculated using the Wilcoxon test and was corrected for multiple comparisons (Holm method). Significance of each comparison is shown above each comparison pair (ns: adjusted P-value > 0.05; *: adjusted P-value ≤ 0.05; **: adjusted P-value ≤ 0.01; ***: adjusted P-value ≤ 0.001; ****: adjusted P-value ≤ 0.0001).
Figure 3
Figure 3
Three QTL were identified in GWA mapping of lifetime fecundity variation in 121 C. elegans wild strains. (A) Manhattan plot indicating GWA mapping results. Each point represents an SNV that is plotted with its genomic position (x-axis) against its −log10(p) value (y-axis) in mapping. SNVs that pass the genome-wide EIGEN threshold (the dotted gray horizontal line) and the genome-wide BF threshold (the solid gray horizontal line) are colored pink and red, respectively. (B) Tukey box plots showing lifetime fecundity between strains with different genotypes at the peak marker position in each QTL. Each point corresponds to a C. elegans strain and is colored gold for swept strains and purple for divergent strains. On the x-axis, REF represents strains with the N2 reference allele and ALT represents strains with the alternative allele.
Figure 4
Figure 4
Lifetime fecundity comparisons in wild C. elegans strains among different sampling locations. Comparisons of lifetime fecundity among strains collected from Hawaii (50 strains), North America (22 strains), and Europe (41 strains). Each point corresponds to a strain and is colored gold for swept strains and purple for divergent strains. Statistical significance was calculated using the Wilcoxon test. Significance of each comparison is shown above each comparison pair (**: adjusted P-value ≤ 0.01; ****: adjusted P-value ≤ 0.0001). The difference of lifetime fecundity between North American and European strains is not significant.
Figure 5
Figure 5
Multiple QTL impacting C. elegans lifetime fecundity in different conditions. Four GWA mapping QTL of two conditions (121 strains cultured in agar plate and 236 strains cultured in liquid with 1% DMSO) and seven linkage mapping QTL of three conditions (C. elegans RIAILs cultured in liquid with 1% water, 1% DMSO, and 0.5% DMSO, respectively) are plotted. Each condition is plotted on the y-axis against the genomic position of its QTL on the x-axis separated by chromosomes with tick marks denoting every 5 Mb. Each QTL is plotted as a line with a triangle indicating the peak marker and colored by the −log10(p) value (GWA QTL) or the logarithm of the odds (LOD) score (for linkage mapping QTL), increasing in significance from blue to red.

References

    1. Andersen EC, Bloom JS, Gerke JP, Kruglyak L.. 2014. A variant in the neuropeptide receptor npr-1 is a major determinant of Caenorhabditis elegans growth and physiology. PLoS Genet. 10:e1004156. - PMC - PubMed
    1. Andersen EC, Gerke JP, Shapiro JA, Crissman JR, Ghosh R, et al.2012. Chromosome-scale selective sweeps shape Caenorhabditis elegans genomic diversity. Nat Genet. 44:285–290. - PMC - PubMed
    1. Andersen EC, Shimko TC, Crissman JR, Ghosh R, Bloom JS, et al.2015. A powerful new quantitative genetics platform, combining Caenorhabditis elegans high-throughput fitness assays with a large collection of recombinant strains. G3 (Bethesda). 5:911–920. - PMC - PubMed
    1. Anderson JL, Albergotti L, Ellebracht B, Huey RB, Phillips PC.. 2011. Does thermoregulatory behavior maximize reproductive fitness of natural isolates of Caenorhabditis elegans? BMC Evol Biol. 11:157. - PMC - PubMed
    1. Anderson JL, Albergotti L, Proulx S, Peden C, Huey RB, et al.2007. Thermal preference of Caenorhabditis elegans: a null model and empirical tests. J Exp Biol. 210:3107–3116. - PubMed

Publication types

LinkOut - more resources