. 2021 Jun 10;64(11):7210-7230.
doi: 10.1021/acs.jmedchem.1c00416. Epub 2021 May 13.

Target-Based Evaluation of "Drug-Like" Properties and Ligand Efficiencies

Affiliations

Target-Based Evaluation of "Drug-Like" Properties and Ligand Efficiencies

Paul D Leeson et al. J Med Chem. .

Abstract

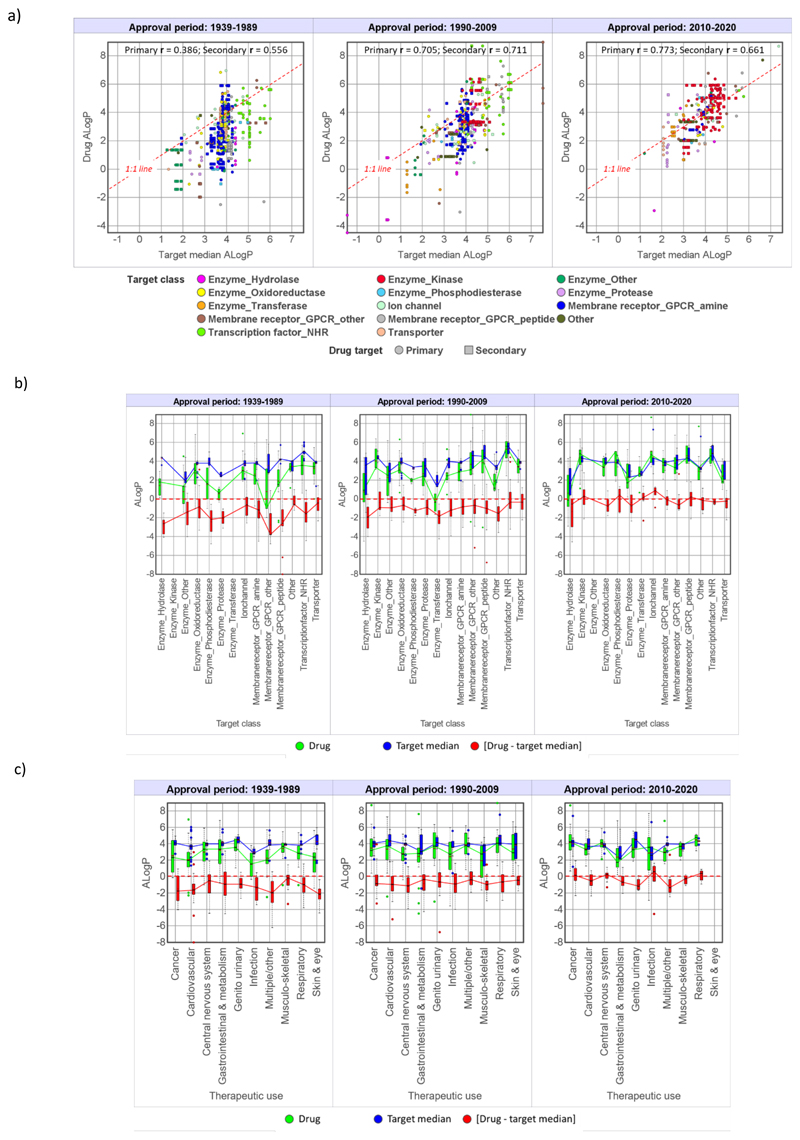
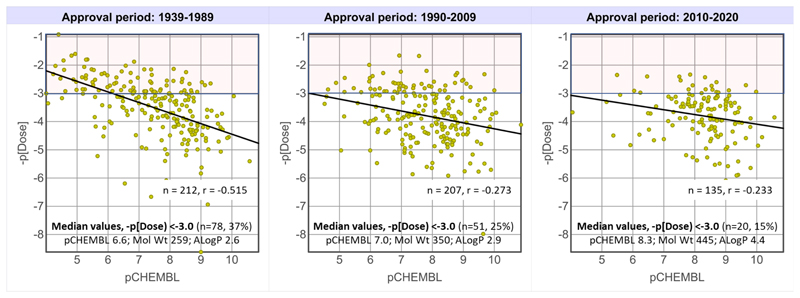
Physicochemical descriptors commonly used to define "drug-likeness" and ligand efficiency measures are assessed for their ability to differentiate marketed drugs from compounds reported to bind to their efficacious target or targets. Using ChEMBL version 26, a data set of 643 drugs acting on 271 targets was assembled, comprising 1104 drug-target pairs having ≥100 published compounds per target. Taking into account changes in their physicochemical properties over time, drugs are analyzed according to their target class, therapy area, and route of administration. Recent drugs, approved in 2010-2020, display no overall differences in molecular weight, lipophilicity, hydrogen bonding, or polar surface area from their target comparator compounds. Drugs are differentiated from target comparators by higher potency, ligand efficiency (LE), lipophilic ligand efficiency (LLE), and lower carboaromaticity. Overall, 96% of drugs have LE or LLE values, or both, greater than the median values of their target comparator compounds.


Conflict of interest statement

Note

The authors declare no competing financial interest.

Figures

Figure 1
Figure 1
Three drug approval time periods used in this paper were selected on basis of the increases in molecular weight and lipophilicity (ALogP) seen in the 643 drugs with ≥ 100 comparator compounds acting at their target(s). The differences in molecular weight and ALogP between the three approval periods are statistically significant (t-test p <0.05). Mean and median values for the three time periods are given in Table 3.
Figure 2
Figure 2. Distribution of drug-target pairs from CHEMBL with ≥ 100 comparator compounds (n=1104) acting at the target(s) linked to the drug’s therapeutic action, in the three selected drug approval time periods.
a) Target class and therapeutic use. b) Number of drugs per target in each time frame, for all targets with a total of ≥ 5 drugs. In all there are 643 drugs acting at 271 targets, of which 426 have a single defined target; 117 have 2 targets; 47 have 3 targets; 29 have 4 targets; and 24 have 5 or more targets. All targets and associated data used for this study are provided in the Supporting Spreadsheet S1.
Figure 3
Figure 3
Routes of administration of drugs with ≥ 100 comparator compounds acting at their target(s). The numbers of drugs that can be given non-orally in the three time periods is 150 (58%) in 1939-1989, 73 (30%) in 1990-2009 and 11 (8%) in 2010-2020.
Figure 4
Figure 4
a) The drug-like ratio, the ratio of numbers of drugs with ‘more drug-like’ (better) to ‘less drug-like’ (worse) properties over the three time periods for selected key parameters. b) Drug versus target median correlation coefficients (r values) for the same data. All values of the datapoints in a) and b) are from Tables 3–6.
Figure 5
Figure 5
Box plots showing selected drug, target median and [drug - target median] properties in the three time periods for drug primary targets. The time periods are connected by median values, except for aromatic ring counts, where means are used. Mean and median values for all properties are in Tables 3–6, statistical values are in Supporting Spreadsheet 2.
Figure 6
Figure 6. Drug and target comparator ALogP values by drug approval time period.
a) Drug versus corresponding target medians. b) The data in a) split by target class. c) Therapeutic use. Statistical values for boxplots b) and c) are in the Supporting Spreadsheet S2.
Figure 7
Figure 7. Drug and target comparator pCHEMBL values by drug approval time period.
a) Drug versus corresponding target medians. b) The data in a) split by target class. c) Therapeutic use. Statistical values for boxplots b) and c) are in the Supporting Spreadsheet S2.
Figure 8
Figure 8. Differentiation of drugs from their primary target compounds using combinations of potency, size and lipophilicity.
a) Percentages of drugs with molecular weight and ALogP greater or lower than their primary target’s median values, split by their potencies (pCHEMBL) being greater or lower than their primary target median values. b) Plot of LE versus LLE [drug - target median] differences. The population of drugs in each quadrant is shown.
Figure 9
Figure 9
Maximum daily oral dose (-p[Dose]) versus pCHEMBL for 562 oral drugs identified in this study (including those with <100 comparator compounds at their targets of action) by time period of drug approval. –p[Dose] = -3.0 is the upper quartile oral dose value for all 562 drugs. Data used are Supplementary Spreadsheet 2.
Figure 10
Figure 10. Evolution of oral CGRP antagonists from a high molecular weight HTS hit.,
a) Initial Merck HTS hit 1, failed clinical candidates 2 and 3, and marketed drugs 4 and 5. Three pharmacophoric elements highlighted are present in hit 1 and retained in the Merck program, shown by the arrows, leading to the marketed drug 4. In 5, discovered by BMS, the azepine ring substituents of 2 are modified. b) Molecular properties and year of 1st patent. c) LE vs LLE plot with CHEMBL comparators showing hit-to-drug trajectory (n=585 Ki values).
Figure 11
Figure 11. Multiparameter lead optimisation using generative predictive tools.
Compounds 6 and 7 act as activators of an undisclosed phenotypic target. Compound 6 was the best of 881 compounds across 6 off-target and 4 ADME assays. The generative model predicted 150 compounds would improve on 6 of which 11 were made, including 7, which met all 10 assay objectives. cLogP values from CHEMDRAW (https://www.perkinelmer.com/category/chemdraw).

References

    1. Gleeson MP, Leeson PD, Waterbeemd Hvd. Physicochemical Properties and Compound Quality. In: Davis A, Ward SE, editors. The Handbook of Medicinal Chemistry: Principles and Practice. The Royal Society of Chemistry; 2015. pp. 1–31.
    1. Meanwell NA. Improving Drug Candidates By Design: A Focus on Physicochemical Properties as a Means of Improving Compound Disposition and Safety. Chem Res Toxicol. 2011;24:1420–1456. - PubMed
    1. Meanwell NA. Improving Drug Design: An Update on Recent Applications of Efficiency Metrics, Strategies for Replacing Problematic Elements, and Compounds In Nontraditional Drug Space. Chem Res Toxicol. 2016;29:564–616. - PubMed
    1. Young RJ. Physical Properties in Drug Design. In: Meanwell NA, editor. Tactics in Contemporary Drug Design. Springer; Berlin: 2014. pp. 1–68.
    1. Gleeson MP, Hersey A, Montanari D, Overington J. Probing the Links between in Vitro Potency, ADMET and Physicochemical Parameters. Nat Rev Drug Discovery. 2011;10:197–208. - PMC - PubMed

Publication types

MeSH terms