. 2021 May 13;17(5):e1008859.
doi: 10.1371/journal.pcbi.1008859. eCollection 2021 May.

Hierarchical semantic composition of biosimulation models using bond graphs

Affiliations

Hierarchical semantic composition of biosimulation models using bond graphs

Niloofar Shahidi et al. PLoS Comput Biol. .

Abstract

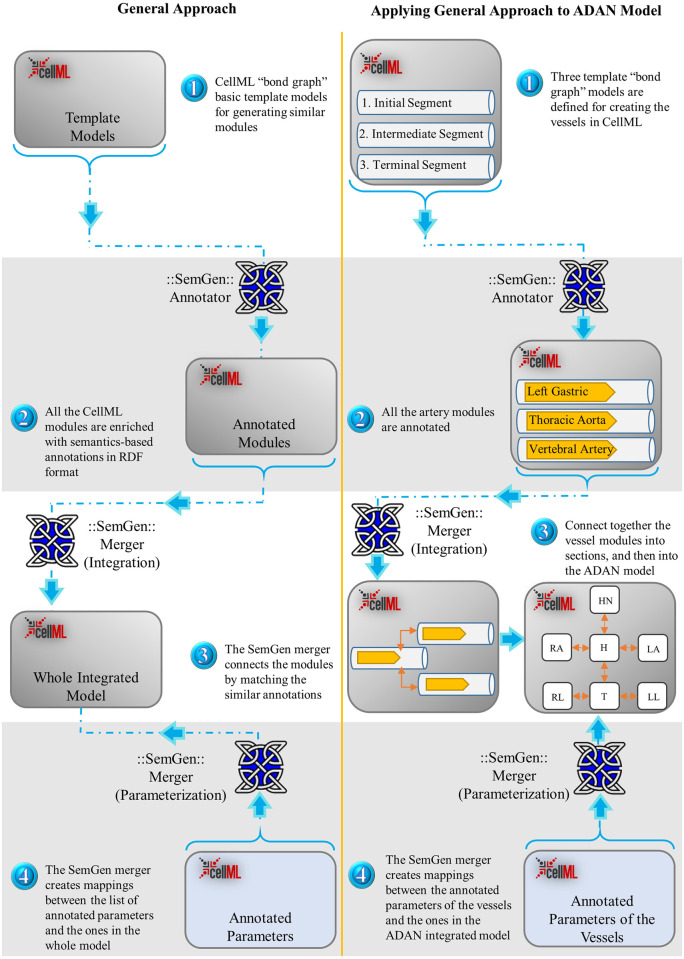
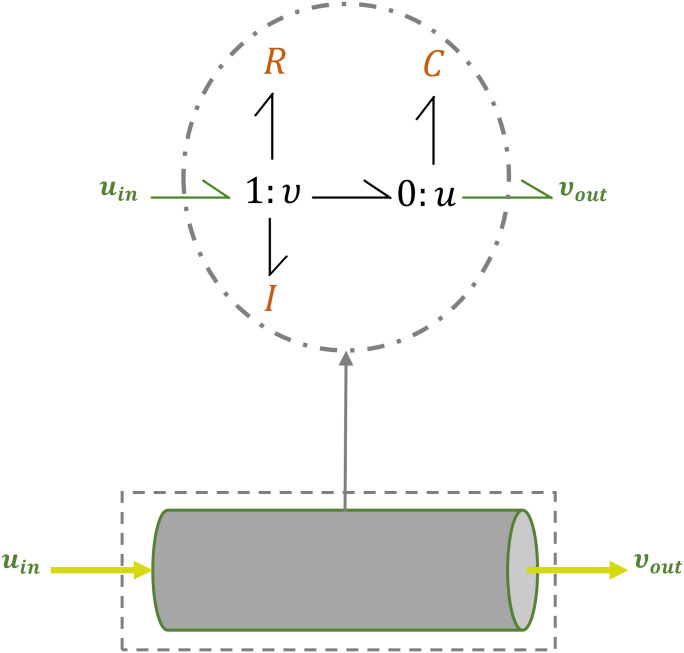
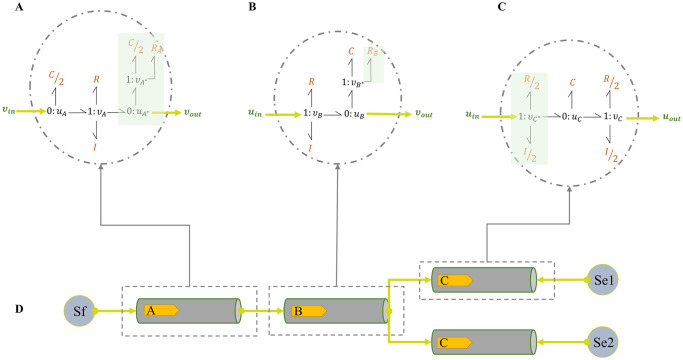
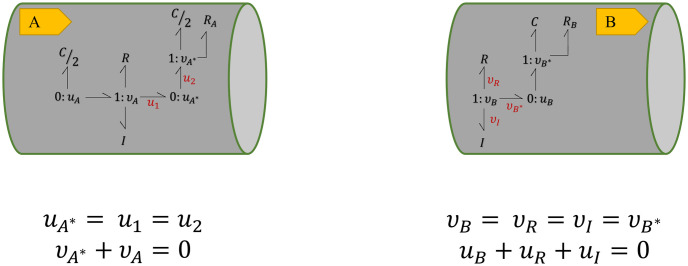
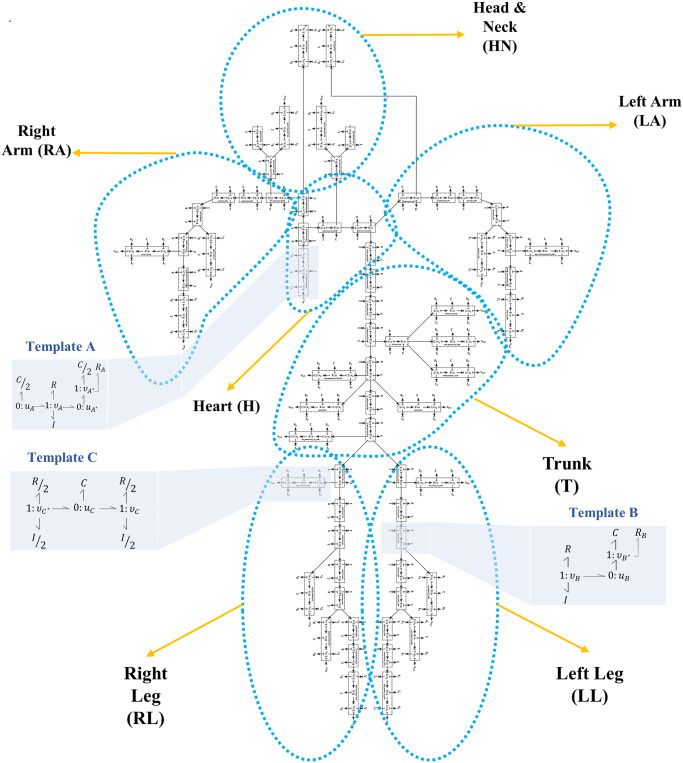
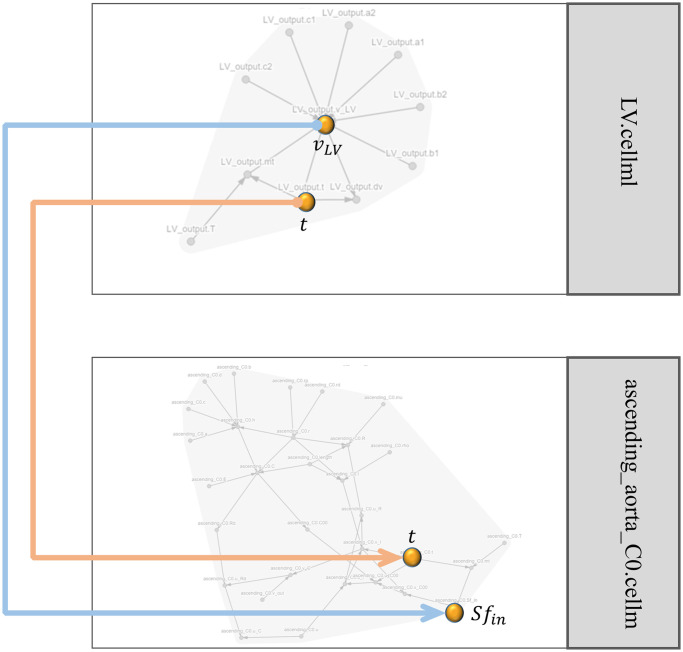
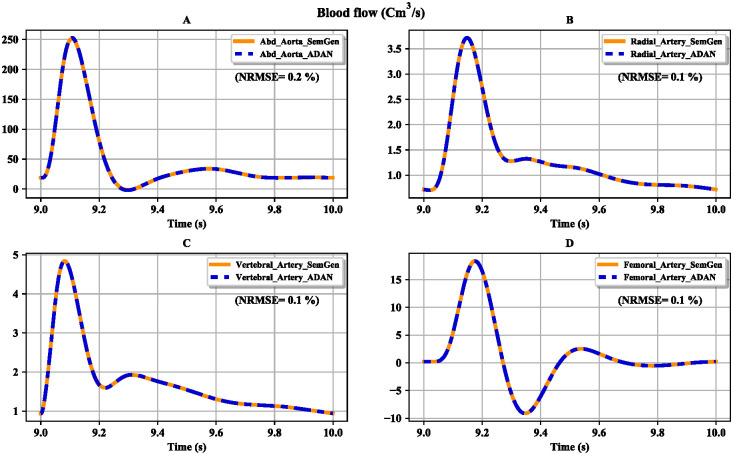
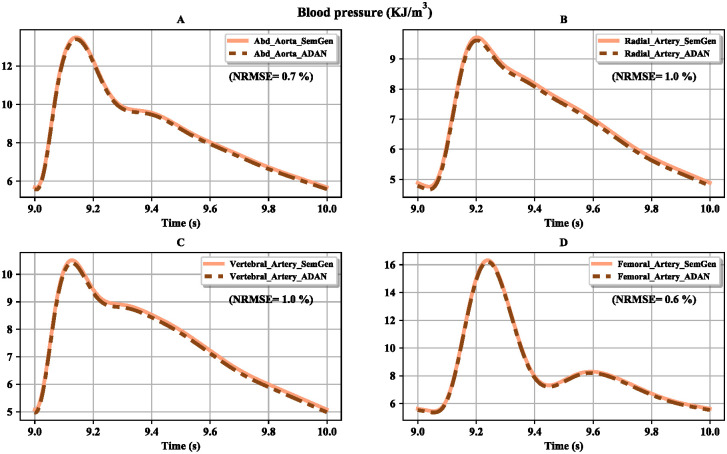
Simulating complex biological and physiological systems and predicting their behaviours under different conditions remains challenging. Breaking systems into smaller and more manageable modules can address this challenge, assisting both model development and simulation. Nevertheless, existing computational models in biology and physiology are often not modular and therefore difficult to assemble into larger models. Even when this is possible, the resulting model may not be useful due to inconsistencies either with the laws of physics or the physiological behaviour of the system. Here, we propose a general methodology for composing models, combining the energy-based bond graph approach with semantics-based annotations. This approach improves model composition and ensures that a composite model is physically plausible. As an example, we demonstrate this approach to automated model composition using a model of human arterial circulation. The major benefit is that modellers can spend more time on understanding the behaviour of complex biological and physiological systems and less time wrangling with model composition.


Conflict of interest statement

The authors have declared that no competing interests exist.

Figures

Fig 1
Fig 1. Flowchart of the semantics-based automated model composition method.
The left column illustrates the general approach in the integration of bond graph models in CellML using SemGen, and the right column shows the same procedure specific to the ADAN circulation model. In both approaches, the bond graph models are created based on template models (1), and annotated using the SemGen Annotator (2). Later, depending on whether the system has similar larger compartments or any symmetry, the SemGen merger tool joins the modules in a number of steps (3). The amounts for the symbolic model parameters are allocated from a CellML file containing the annotated parameters and their values (4). In stage (3): HN: Head and Neck, H: Heart, RA: Right Arm, LA: Left Arm, T: Trunk, RL: Right Leg, LL: Left Leg.
Fig 2
Fig 2. Bond graph representation of a non-branching vessel.
C, R and I components show the mechanical properties of a vessel segment.
Fig 3
Fig 3. Required bond graph template modules for the vessels in the ADAN open-loop model.
Depending on the type and location of a vessel, three template modules can be proposed: (A) initial segment; (B) intermediate segment; (C) terminal segment; (D) the schematic of the segments connections. Sf and {Se1,Se2} are sources of flow and pressure in bond graphs which are cardiac output and venous pressure in the ADAN open-loop model [25]. The components in green boxes are the added sections to the original bond graph configuration of Fig 2.
Fig 4
Fig 4. Conservation equations at the terminal junctions in two bond graph modules.
Equal flows at 1 : v junction and equal potentials at 0 : u junction. The sum of potentials equals to the inward potential in the 1 : v junctions and the sum of flows equals to the outward flow in the 0 : u junctions.
Fig 5
Fig 5. Conservation equations at the terminal junctions in two coupled bond graph modules.
vB in B is added to the conservation equation at 0 : uA* junction in A and uA* in A is added to the conservation equation at 1 : vB junction in B. Each terminal junction’s v or u in each module is added to the other module’s conservation equation, representing the addition of a bond.
Fig 6
Fig 6. Bond graph modular connection of the vessel models.
v in the initial junction of the following module will be mapped to vx at the terminal junction of its preceding module. In the same way, u at the terminal junction of each module will be mapped to ux at the initial junction of its following module. vx and ux are auxiliary variables.
Fig 7
Fig 7. The template bond graph module for intermediate vessels in our version of the ADAN open-loop model.
The number of vx variables depends on the maximum number of branches occurring in any segment. Here, four auxiliary variables corresponding to four branches are demonstrated.
Fig 8
Fig 8. Lumped modules in the ADAN open-loop model.
These lumped modules will be connected in the final step using the SemGen merger tool to produce the whole ADAN open-loop model.
Fig 9
Fig 9. Vessels network in the ADAN open-loop model.
The blue dashed shapes delineate the segments in each lumped module. The three bond graph templates of Fig 3 are shown in blue boxes for three exemplar segments. The segments network is adopted from [25].
Fig 10
Fig 10. The SemGen merger tool visualisation for two modules.
The model of left ventricle output flow (LV.cellml) is merged with the model of the ascending aorta (ascending_aorta_C0.cellml). Time (t) and the amount of the flow (vLV) in the LV.cellml module are mapped to the time (t) and the source of flow (Sfin) variables in the ascending_aorta_C0.cellml module. The grey lines show the internal dependencies between the variables in each module and the orange and blue lines show the links between the modules.
Fig 11
Fig 11. Comparison between the flows obtained from the ADAN open-loop model and our version of the model.
(A) Flow in the abdominal aorta; (B) flow in the radial artery; (C) flow in the vertebral artery; (D) flow in the femoral artery. The normalised root mean square errors (NRMSE) are represented as percentages.
Fig 12
Fig 12. Comparison between the pressures obtained from the ADAN open-loop model and our version of the model.
(A) Pressure in the abdominal aorta; (B) pressure in the radial artery; (C) pressure in the vertebral artery; (D) pressure in the femoral artery. The normalised root mean square errors (NRMSE) are represented as percentages.

Similar articles

Cited by

References

    1. Rekate HL, Brodkey JA, Chizeck HJ, et al.. Ventricular volume regulation: A mathematical model and computer simulation. Pediatr Neurosci. 1988; 14(2): 77–84. 10.1159/000120367 - DOI - PubMed
    1. Voronova V, Sokolov V, Al-Khaifi A, et al.. A physiology-based model of Bile acid distribution and metabolism Under healthy and pathologic conditions in human beings. Cell Mol Gastroenterol Hepatol. 2020; 10(1): 149–170. 10.1016/j.jcmgh.2020.02.005 - DOI - PMC - PubMed
    1. Neal ML, Cooling MT, Smith LP, et al.. A Reappraisal of how to build modular, reusable models of biological systems. PLoS Comput Biol. 2014. October; 10(10): e1003849. 10.1371/journal.pcbi.1003849 - DOI - PMC - PubMed
    1. Gawthrop PJ, Cudmore P, Crampin EJ. Physically-plausible modelling of biomolecular systems: A simplified, energy-based model of the mitochondrial electron transport chain J. Theor. Biol. 2020. May; 493: 110223-. 10.1016/j.jtbi.2020.110223 - DOI - PubMed
    1. Cooling MT, Hunter P, Crampin EJ. Modelling biological modularity with CellML. IET Syst Biol. 2008. March; 2(2): 73–9. 10.1049/iet-syb:20070020 - DOI - PubMed

Publication types