. 2021 May 13;16(5):e0250987.
doi: 10.1371/journal.pone.0250987. eCollection 2021.

Compartmentalization of cerebrospinal fluid inflammation across the spectrum of untreated HIV-1 infection, central nervous system injury and viral suppression

Affiliations

Compartmentalization of cerebrospinal fluid inflammation across the spectrum of untreated HIV-1 infection, central nervous system injury and viral suppression

Magnus Gisslen et al. PLoS One. .

Abstract

Objective: To characterize the evolution of central nervous system (CNS) inflammation in HIV-1 infection applying a panel of cerebrospinal fluid (CSF) inflammatory biomarkers to grouped subjects representing a broad spectrum of systemic HIV-1 immune suppression, CNS injury and viral control.

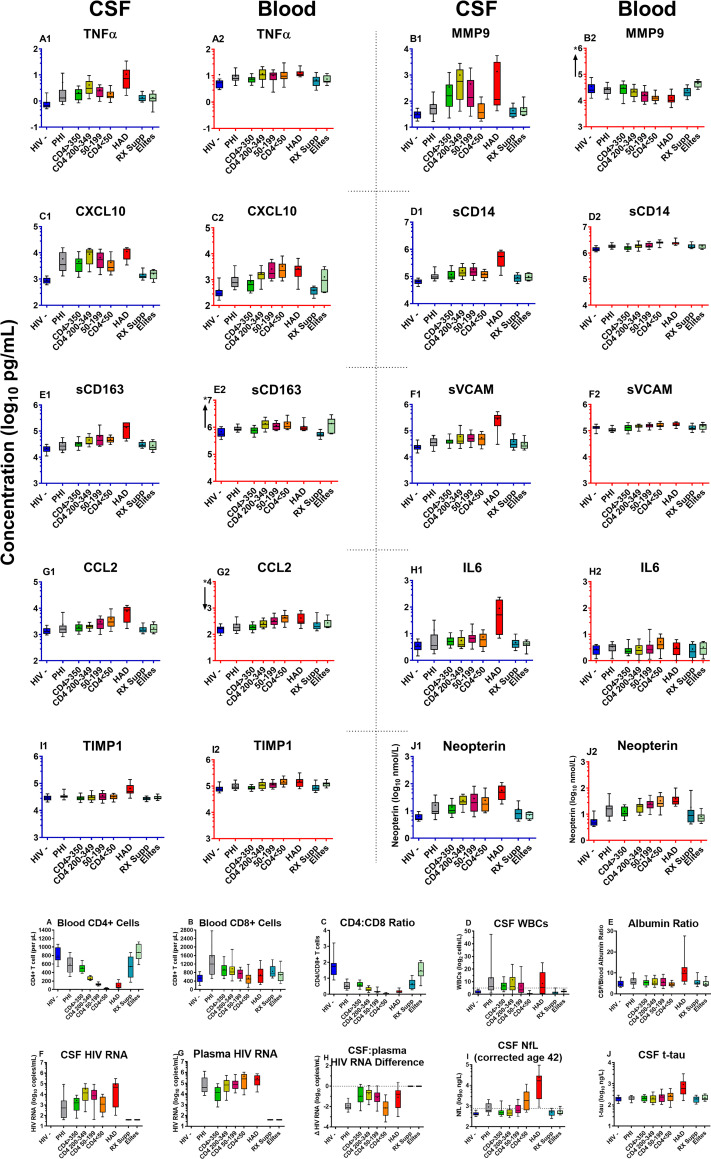
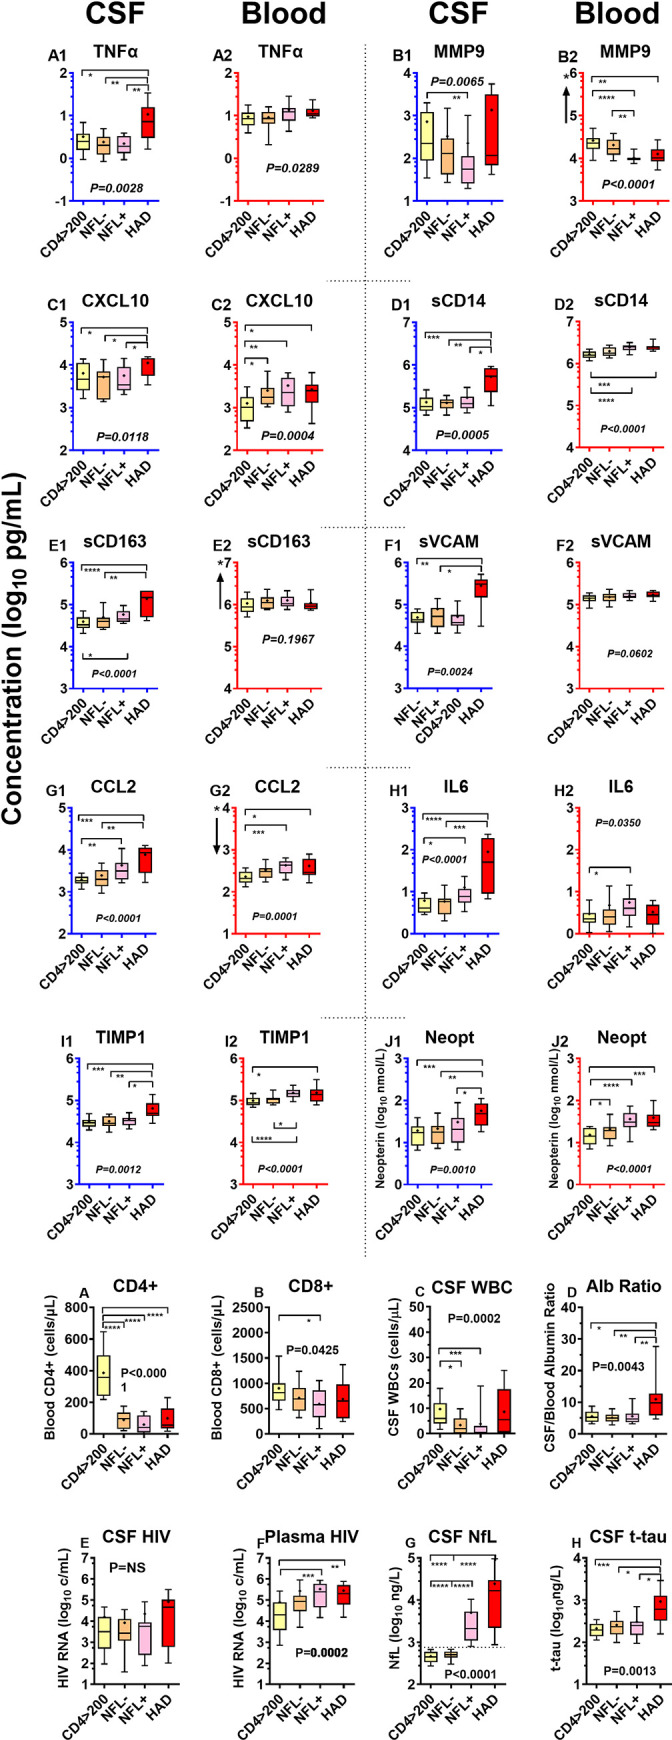
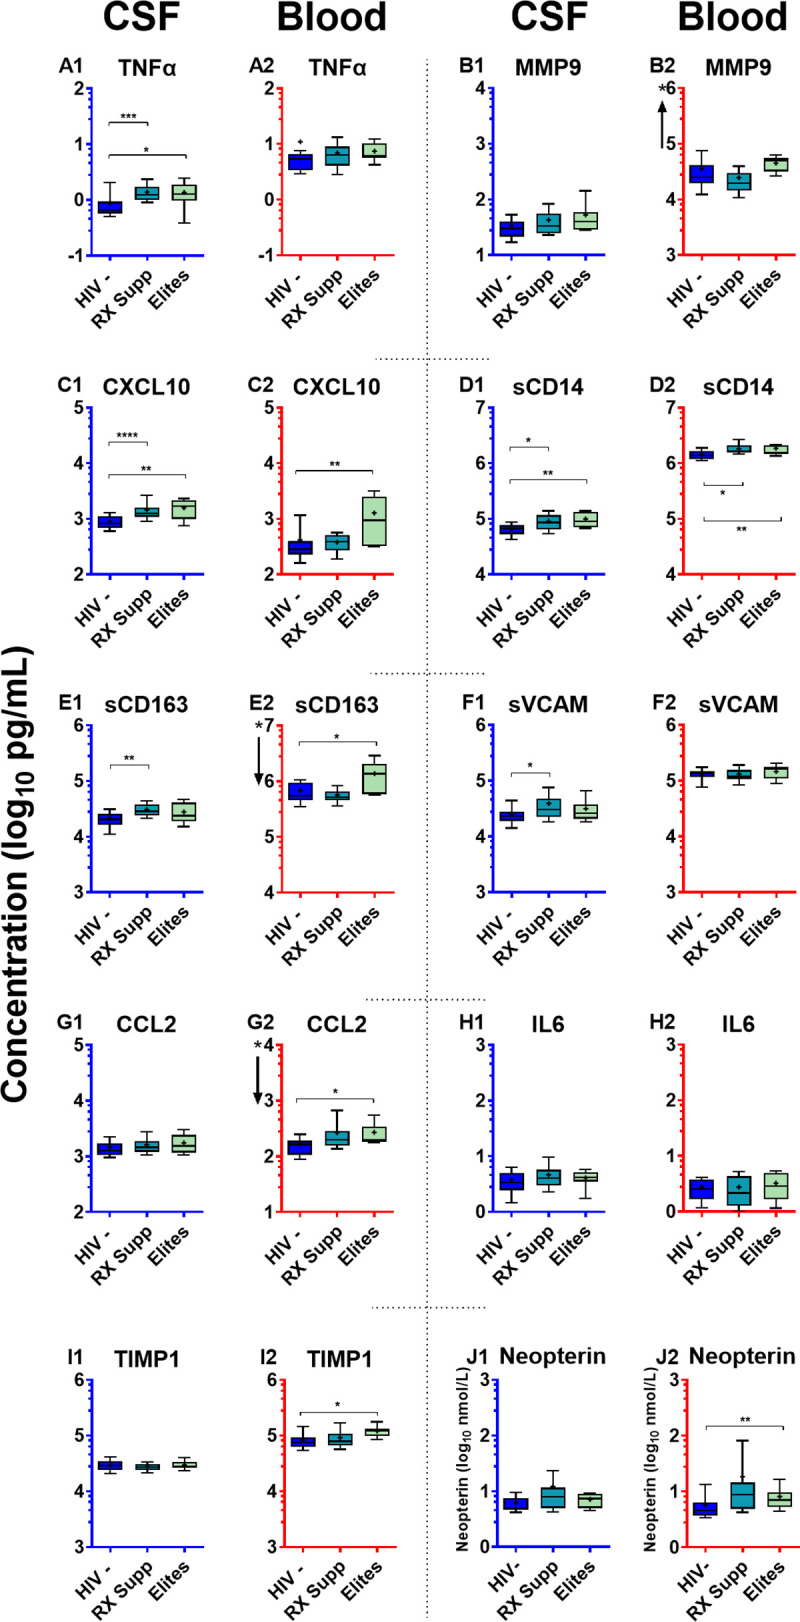
Methods: This is a cross-sectional analysis of archived CSF and blood samples, assessing concentrations of 10 functionally diverse soluble inflammatory biomarkers by immunoassays in 143 HIV-1-infected subjects divided into 8 groups: untreated primary HIV-1 infection (PHI); four untreated groups defined by their blood CD4+ T lymphocyte counts; untreated patients presenting with subacute HIV-associated dementia (HAD); antiretroviral-treated subjects with ≥1 years of plasma viral suppression; and untreated elite controllers. Twenty HIV-1-uninfected controls were included for comparison. Background biomarkers included blood CD4+ and CD8+ T lymphocytes, CSF and blood HIV-1 RNA, CSF white blood cell (WBC) count, CSF/blood albumin ratio, CSF neurofilament light chain (NfL), and CSF t-tau.

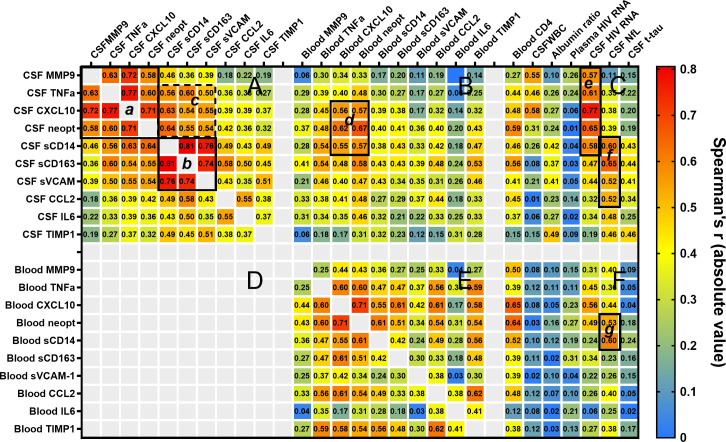
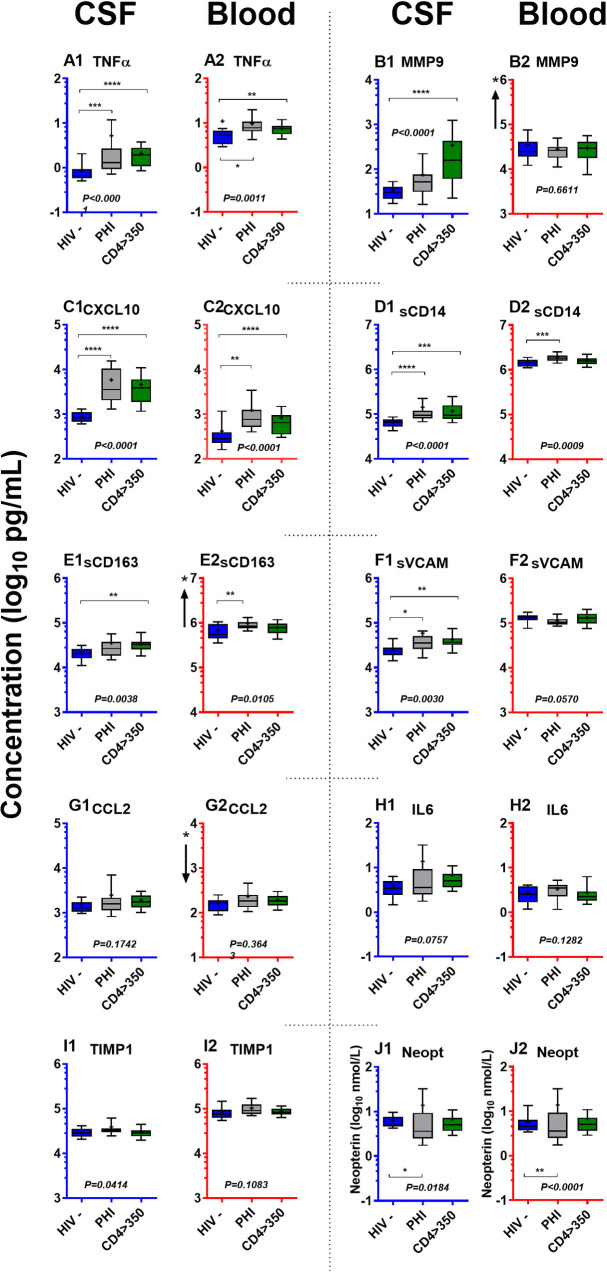
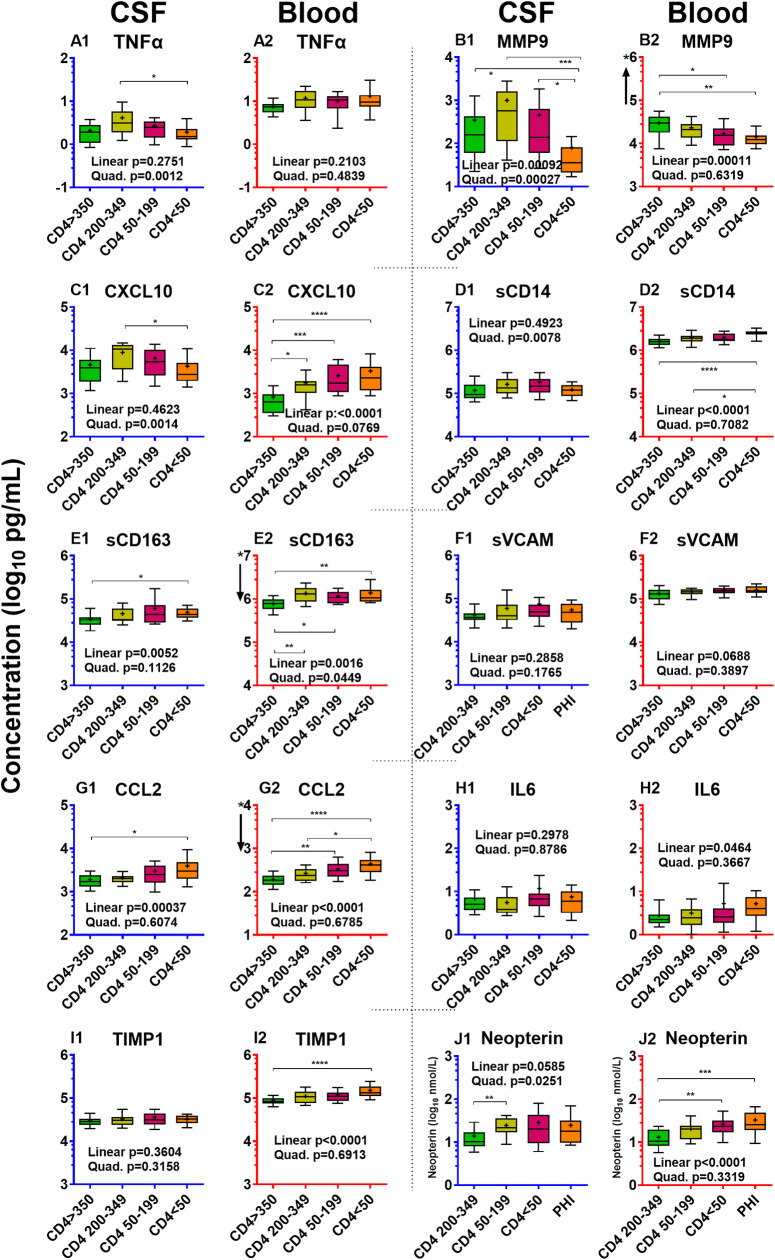
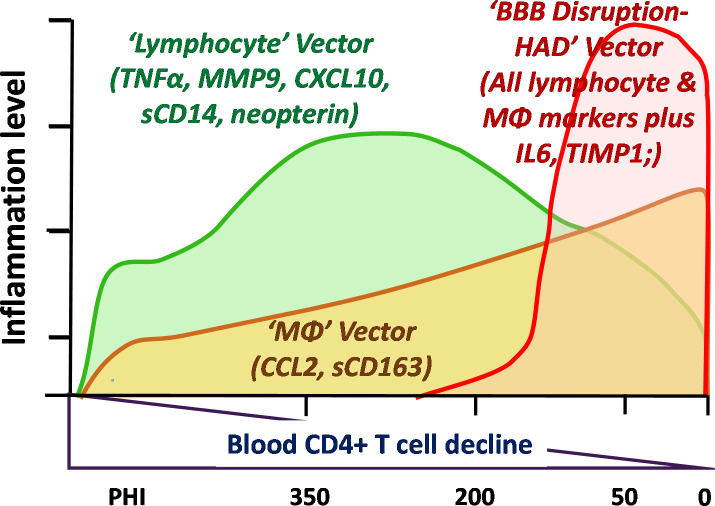
Findings: HIV-1 infection was associated with a broad compartmentalized CSF inflammatory response that developed early in its course and changed with systemic disease progression, development of neurological injury, and viral suppression. CSF inflammation in untreated individuals without overt HAD exhibited at least two overall patterns of inflammation as blood CD4+ T lymphocytes decreased: one that peaked at 200-350 blood CD4+ T cells/μL and associated with lymphocytic CSF inflammation and HIV-1 RNA concentrations; and a second that steadily increased through the full range of CD4+ T cell decline and associated with macrophage responses and increasing CNS injury. Subacute HAD was distinguished by a third inflammatory profile with increased blood-brain barrier permeability and robust combined lymphocytic and macrophage CSF inflammation. Suppression of CSF and blood HIV-1 infections by antiretroviral treatment and elite viral control were associated with reduced CSF inflammation, though not fully to levels found in HIV-1 seronegative controls.


Conflict of interest statement

The authors have no competing interests that influenced the contents of this paper. However, the authors list the following general potential conflicts of interest: RWP had been a consultant to Merck and Co and had received an honorarium and travel support from AbbVie and Gilead Sciences for meeting presentations during part of the time of sample collections. MG has received research grants from Abbott, Baxter, Bristol-Myers Squibb, Gilead Sciences, GlaxoSmithKline, Merck, Pfizer, Roche and Tibotec, and he has received honoraria as a speaker and/or scientific advisor from Abbott/Abbvie, Amgen, Biogen, Bioinvent, Boehringer-Ingelheim, Bristol-Myers Squibb, Gilead Sciences, GlaxoSmithKline, Janssen-Cilag, MSD, Novocure, Novo Nordic, Pfizer, Roche and Tibotec. HZ has served at scientific advisory boards for Denali, Roche Diagnostics, Wave, Samumed, Siemens Healthineers, Pinteon Therapeutics and CogRx, has given lectures in symposia sponsored by Fujirebio, Alzecure and Biogen, and is a co-founder of Brain Biomarker Solutions in Gothenburg AB (BBS), which is a part of the GU Ventures Incubator Program. KB has served as a consultant, at advisory boards, or at data monitoring committees for Abcam, Axon, Biogen, JOMDD/Shimadzu. Julius Clinical, Lilly, MagQu, Novartis, Roche Diagnostics, and Siemens Healthineers, and is a co-founder of Brain Biomarker Solutions in Gothenburg AB (BBS), which is a part of the GU Ventures Incubator Program. Dr. Spudich has received an honorarium and travel support from AbbVie, Inc. for a meeting presentation. BLS has received research grants from Gilead Sciences, and an honorarium and travel support from Merck. SMK, SSS, VA, SS, CDG, DF, LH, JP, PJN, BLS and CTY report no conflicts. In no case were the above-listed activities related directly to the submitted work—neither to the conceptualization, study design, data collection, analysis, or manuscript preparation. This does not alter our adherence to PLOS ONE policies on sharing data and materials.

Figures

Fig 1
Fig 1. CSF and blood inflammatory biomarkers across the 9 subject groups.
a. CSF and blood inflammatory biomarkers. The panels plot CSF and blood biomarker results in adjacent pairs (e.g., A1 and A2 showing TNFα concentrations in CSF and plasma). For each pair, the CSF concentrations are shown to the left with blue axes and the blood concentrations to their right with red axes. Each biomarker is presented as log10 concentrations over a 3 log10 range, with the absolute ranges depending on the concentrations in the assessed fluid. Where the plotted ranges differed between CSF and blood for a given biomarker, an “*” and arrow near the blood biomarker’s Y axis shows the shift in axis up or down. Boxes show median and interquartile range with “+” denoting means; whiskers designate 10 and 90th percentiles. Results are discussed in the text. Inflammatory biomarker concentrations in this and subsequent figures are in log10 pg/mL except neopterin in log10 nmol/L. The total number of subjects in each group are listed in Table 1 but the number assayed for CSF and blood inflammatory markers were not fully concordant because of sample exhaustion in some cases. The assayed group numbers for CSF and for blood (in parentheses) analyzed for inflammatory markers were: HIV- 20 (20); PHI 24 (24); CD4 >350 20 (20), CD4 200–349 20 (20), CD4 50–199 20 (20); CD4 <50 19 (20); HAD N = 10 (12); Rx Suppressed 19 (18); Elite controllers 8 (7). b. Background biomarkers. To facilitate visual comparison with the soluble biomarkers assessed for this study, these 10 graphs present the salient background findings in the same color-coded format. These data were previously published for this cohort [41]. The actual assayed group numbers are the same as the total group numbers in Table 1 with a few exceptions (actual numbers in parentheses): blood CD4+ T cells for HAD (11); blood CD8+ cells and CD$/CD8 ratio for PHI (23) and HAD (11); Albumin ratio for HAD (11); CSF tau for Rx Supp (18).
Fig 2
Fig 2. Correlations among the CSF and blood biomarkers and with selected background biomarkers.
This blue-yellow-red heat map diagrams the Spearman’s correlation coefficient r across the entire data set expressed as absolute values and provides an overview of variable correlations. The absolute values are used to simplify comparison of positive and negative correlations, the latter involving blood CD4+ T cell counts and blood MMP9 concentrations which generally varied inversely with the other markers. The color scale provides a visual index while the r values are provided in each cell, mapping the relationships among the CSF and blood biomarker concentration across the entire sample. The large panels plot the Spearman’s r: among the CSF (A) and blood (E) inflammatory biomarkers; between the CSF and blood inflammatory biomarkers (B); and between the CSF and blood inflammatory biomarkers and seven salient background biomarkers (C and F). Panel D is blank for visual simplicity since it would show the same matrix as B, flipped along a diagonal axis. The smaller outlined boxes (a-g) highlight some of the interesting biomarker relationships of interest as discussed in the text.
Fig 3
Fig 3. CSF and blood inflammatory biomarkers in PHI compared to HIV-uninfected and early chronic infection.
These graphs use the same format, axes and unit scales as Fig 1A. but isolate three subject groups: HIV negatives, PHI and the NA group with >350 CD4+ blood T cells in order to examine the ‘transition’ during PHI from seronegative to early chronic infection. P values in italics give the overall Kruskal-Wallis ANOVA significance, while the horizontal bars show P values of individual post hoc testing using Dunn’s multiple comparison test for the three-group comparison: * P <0.05; ** P <0.01; *** P <0.001; and **** P <0.0001. This analysis is also outlined in Table 3. Since this figure is extracted from Fig 1A, the subject numbers are listed in the legend of that figure.
Fig 4
Fig 4. Inflammatory biomarkers in four CD4+-defined groups of untreated without HAD.
These graphs use the same format, axes and unit scales as Fig 1 but isolate the results comparing the four NA groups with progressive blood CD4 T cell loss. P values for linear and quadratic trends analysis (also given in Table 4) are shown in the text at the bottom of each graph, while the horizontal bars show significant comparisons between groups using Kruskal-Wallis with Dunn’s multiple comparison tests: * P <0.05; ** P <0.01; *** P <0.001; and **** P <0.0001. These figures are extracted from Fig 1 (which can be referenced for group subject numbers) for visualization of changes and their isolated statistical comparison.
Fig 5
Fig 5. Re-sorted subject groups based on blood CD4 and CSF NfL concentrations.
a. CSF and blood inflammatory biomarkers. The panels graph group values for each of the Inflammatory biomarkers in CSF and blood after the subjects were regrouped on the basis of blood CD4+ T cell counts, CSF NfL and HAD diagnosis as described in the text. These graphs use the same format, axes and unit scales as Fig 1A, but since the group compositions for the three non-HAD groups are different from the original groups, their colors have been changed. The overall significance of the differences among groups by Kruskal-Wallis are shown by P values in text, while significant differences between groups by Dunn’s multiple comparison test are shown by the horizontal bars: * P <0.05; ** P <0.01; *** P <0.001; and **** P <0.0001. In this analysis the number assayed for CSF and blood inflammatory markers were not fully concordant because of sample shortfalls in some cases. The following list provides the group numbers for CSF and for blood (in parentheses) analyzed for inflammatory markers: CD4 > 200 33 (36); NFL- 17 (17); NFL+ 22 (21); HAD 10 (12). b. Background biomarkers. The 8 panels include the same four re-sorted groups with respect to salient background biomarkers. The CD4 counts (A) of the two middle groups, <200 cells/μL were notably also not different from the HAD group, while the CD8 counts (B) also did not differ across these same three groups. The CSF WBC counts were lower in the two NFL groups than the CD4> 200 (C), while the albumin ratio (D) was elevated in the HAD group but similar (and normal) in the other 3 groups. CSF HIV RNA concentration did not statistically differ across the 4 groups (E) but plasma HIV was higher in the HAD and NFL+ groups. By definition, CSF NfL (G) was higher in the NFL+ group and even higher in the HAD group, while t-tau was only elevated in the HAD group (H).
Fig 6
Fig 6. Model of evolving CNS inflammation with systemic and CNS disease progression.
This simplified diagram outlines a model of the changes in three components, here referred to as ‘vectors’, of CSF inflammation identified in this study. Because of the variability and relatively small sample, these are not precisely mapped but only roughly outlined to provide a general conceptual framework. The lymphocyte vector develops during primary infection, increases as blood CD4+ T cells decline to reach a peak in the middle range of blood CD4+ T-cell counts (centered at 200–350 cells/μL), and then falls as these counts decline further, eventually to levels near normal when the blood CD4+ levels are below 50 cells/μL. This pattern is defined by the quadratic pattern in trends analysis and prominently includes the CSF markers listed in the figure. Importantly, it is also the pattern of CSF WBCs and HIV-1 RNA. The second pattern, the ‘macrophage’ (MΦ) vector, involves a gradual increase in CSF biomarker concentrations with falling blood CD4+ T-cell count. It includes the CSF markers with linear pattern listed in the figure along with a component of CSF MMP-9 and perhaps CSF neopterin. This is also the pattern of CSF NfL concentrations, and thus at a certain threshold this vector appears to associate with the ‘noninflammatory’ type of CNS injury. The third vector includes the disruption of the blood-brain barrier and increased concentrations of all the inflammatory markers in HAD. The cause of this disruptive increase in the barrier is not certain but it associates not only with an increase in all CSF biomarkers, but with more severe CNS injury, higher CSF NfL and elevated levels of CSF t-tau.
Fig 7
Fig 7. CSF and blood inflammatory biomarkers in ART-suppressed and elite controllers.
Inflammatory biomarkers in the two virally suppressed groups are compared to HIV-uninfected controls. These graphs use the same format, axes and unit scales as Fig 1 but show the isolated data of the HIV negatives, treated-suppressed and elites, with each of the latter two groups compared independently to the HIV negative group with significant differences noted by the horizontal bars: * P <0.05; ** P <0.01; and *** P <0.001. These figures are extracted from Fig 1 for visualization and isolated statistical comparison. The number of subjects in each group is provided in the legend to Fig 1.

Similar articles

Cited by

References

    1. McArthur JC, Nance-Sproson TE, Griffin DE, Hoover D, Selnes OA, Miller EN, et al.. The diagnostic utility of elevation in cerebrospinal fluid beta 2-microglobulin in HIV-1 dementia. Multicenter AIDS Cohort Study. Neurology. 1992;42(9):1707–12. 10.1212/wnl.42.9.1707 . - DOI - PubMed
    1. Kelder W, McArthur JC, Nance-Sproson T, McClernon D, Griffin DE. Beta-chemokines MCP-1 and RANTES are selectively increased in cerebrospinal fluid of patients with human immunodeficiency virus-associated dementia. Ann Neurol. 1998;44(5):831–5. 10.1002/ana.410440521 . - DOI - PubMed
    1. Cinque P, Vago L, Mengozzi M, Torri V, Ceresa D, Vicenzi E, et al.. Elevated cerebrospinal fluid levels of monocyte chemotactic protein-1 correlate with HIV-1 encephalitis and local viral replication. Aids. 1998;12(11):1327–32. Epub 1998/08/26. 10.1097/00002030-199811000-00014 . - DOI - PubMed
    1. Conant K, McArthur JC, Griffin DE, Sjulson L, Wahl LM, Irani DN. Cerebrospinal fluid levels of MMP-2, 7, and 9 are elevated in association with human immunodeficiency virus dementia. Ann Neurol. 1999;46(3):391–8. 10.1002/1531-8249(199909)46:3&lt;391::aid-ana15&gt;3.0.co;2-0 . - DOI - PubMed
    1. Sabri F, De Milito A, Pirskanen R, Elovaara I, Hagberg L, Cinque P, et al.. Elevated levels of soluble Fas and Fas ligand in cerebrospinal fluid of patients with AIDS dementia complex. J Neuroimmunol. 2001;114(1–2):197–206. Epub 2001/03/10. 10.1016/s0165-5728(00)00424-0 . - DOI - PubMed

Publication types

MeSH terms