. 2021 May 13;17(5):e1009546.
doi: 10.1371/journal.ppat.1009546. eCollection 2021 May.

The peptidoglycan-associated protein NapA plays an important role in the envelope integrity and in the pathogenesis of the lyme disease spirochete

Affiliations

The peptidoglycan-associated protein NapA plays an important role in the envelope integrity and in the pathogenesis of the lyme disease spirochete

Marisela M Davis et al. PLoS Pathog. .

Abstract

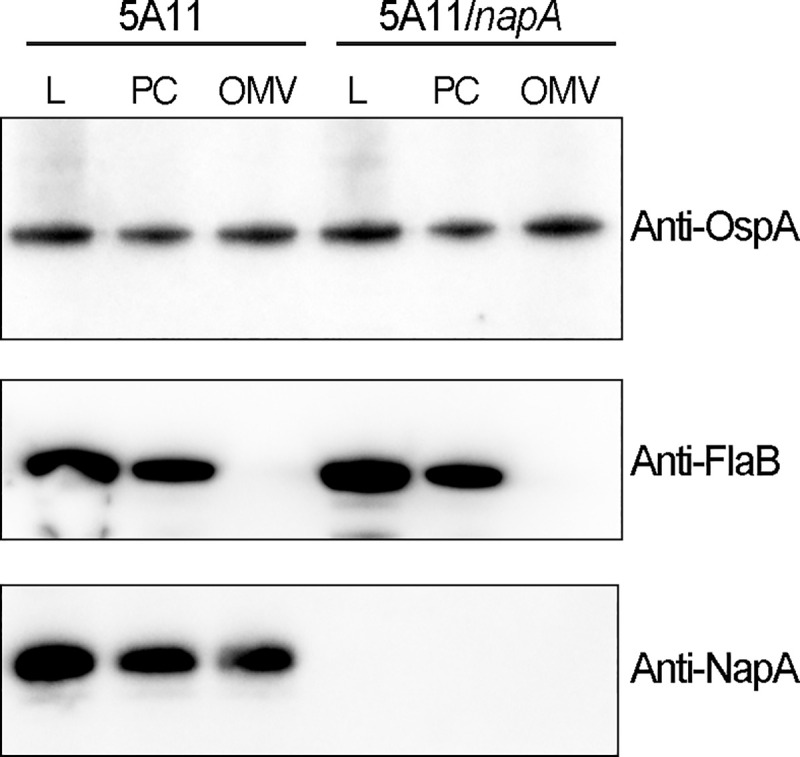
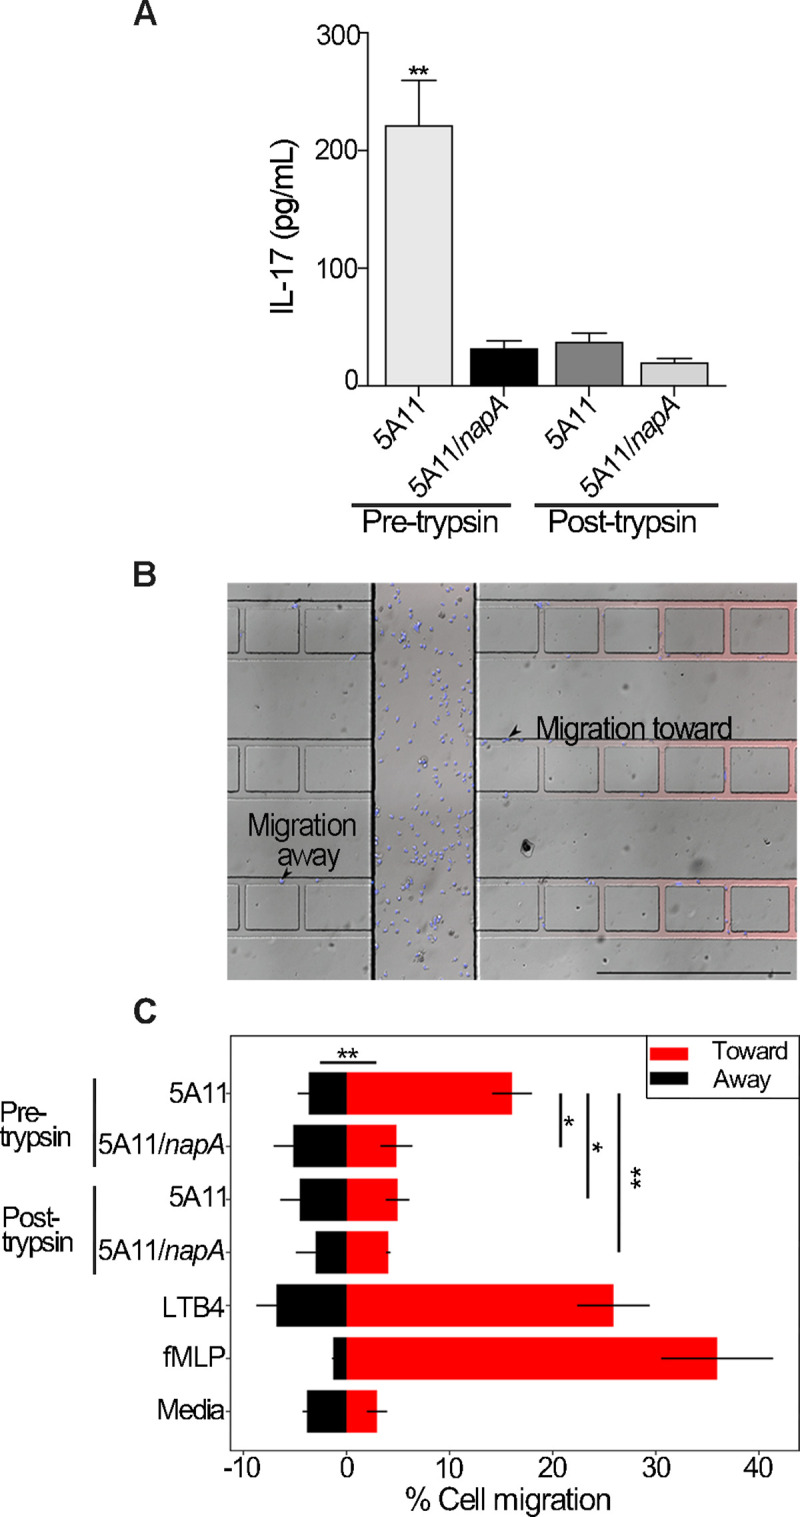
The bacterial pathogen responsible for causing Lyme disease, Borrelia burgdorferi, is an atypical Gram-negative spirochete that is transmitted to humans via the bite of an infected Ixodes tick. In diderms, peptidoglycan (PG) is sandwiched between the inner and outer membrane of the cell envelope. In many other Gram-negative bacteria, PG is bound by protein(s), which provide both structural integrity and continuity between envelope layers. Here, we present evidence of a peptidoglycan-associated protein (PAP) in B. burgdorferi. Using an unbiased proteomics approach, we identified Neutrophil Attracting Protein A (NapA) as a PAP. Interestingly, NapA is a Dps homologue, which typically functions to bind and protect cellular DNA from damage during times of stress. While B. burgdorferi NapA is known to be involved in the oxidative stress response, it lacks the critical residues necessary for DNA binding. Biochemical and cellular studies demonstrate that NapA is localized to the B. burgdorferi periplasm and is indeed a PAP. Cryo-electron microscopy indicates that mutant bacteria, unable to produce NapA, have structural abnormalities. Defects in cell-wall integrity impact growth rate and cause the napA mutant to be more susceptible to osmotic and PG-specific stresses. NapA-linked PG is secreted in outer membrane vesicles and augments IL-17 production, relative to PG alone. Using microfluidics, we demonstrate that NapA acts as a molecular beacon-exacerbating the pathogenic properties of B. burgdorferi PG. These studies further our understanding of the B. burgdorferi cell envelope, provide critical information that underlies its pathogenesis, and highlight how a highly conserved bacterial protein can evolve mechanistically, while maintaining biological function.


Conflict of interest statement

All authors declare no competing interests.

Figures

Fig 1
Fig 1. Identification of peptidoglycan-associated proteins (PAPs) in B. burgdorferi.
(A) Peptidoglycan was isolated from live B. burgdorferi (phase-contrast micrograph, scale bar 5μm) and treated with trypsin (+T). Peptides from each preparation were identified by LC-MS. (B) Western blot analysis of whole cell lysates prepared from the parental, wild-type strain (5A11) and napA mutant (5A11/napA). Each preparation was assayed by western blot for NapA (left) and the constitutive protein FlaB (right). The latter served as a loading control. Numbers and dashes correspond to the migration of molecular weight standards. (C-E) Localization of putative PAP NapA by sub-cellular fractionation coupled with immunofluorescence. Both 5A11 and 5A11/napA were transformed with a B. burgdorferi shuttle vector constitutively expressing GFP (GFP, purple panel). Each strain was fixed and treated with sodium phosphate buffer (no permeabilization, C); 50% methanol (outer membrane permeabilization, D); or methanol, followed by SDS and lysozyme (outer/inner membrane permeabilization, E). Both strains, treated with each permeabilization method, were probed for three targets, independently: Anti-FlaB (periplasmic control, green), anti-GFP (cytoplasmic control, green), and anti-NapA (green). Secondary antibodies anti-Rat IgG:Alexa 588 (anti-FlaB) and anti-Rabbit IgG:Alexa 647 (anti-GFP/anti-NapA) were used to detect primary antibodies. In all cases, images were acquired by phase-contrast microscopy (Ph), epifluorescence microscopy (middle two panels), and epifluorescence channels were merged (M). All scale bars = 5 μm. (F) Population level analysis of signal intensities from each treatment in C-E. Phase-contrast micrographs were used for automated cell detection, and total signal intensities, for each cell, were calculated and used to generate violin plots. No permeabilization (upper panel); outer membrane permeabilization (middle panel); outer/inner membrane permeabilization (lower panel) are shown and grouped by strain, and target. Each data set contained > 300 cells. All average signal intensities were statistically significant (unpaired t-test, p < 0.001) between upper panel and lower two panels, except for anti-NapA in 5A11/napA strain. (G) Demographs of NapA signal attained from outer membrane permeabilization (periplasmic signal, upper panel) and outer/inner membrane permeabilization (cytoplasmic signal, lower panel). Cells were organized by cell length, fluorescent intensity profiles were generated for each cell, and plotted as a heatmap (0–1).
Fig 2
Fig 2. NapA is a PAP.
(A) Dot blot analysis of PG. Wild-type (5A11) and napA mutant (5A11/napA) bacteria were cultured to mid-log exponential growth, cells were harvested, and PG was purified. Prior to trypsin treatment, one half of each sample was removed. Serial dilutions of each pre- and post-trypsin preparation were spotted on nitrocellulose and probed for PG (anti-PG, left) or NapA (anti-NapA, right). (B) The same sample preparation described in A were used for immunofluorescence studies. Whole PG sacculi were visualized by epifluorescence microscopy using wheat germ agglutinin (WGA, red) conjugated to Alexa Fluor 350. NapA (green) was detected using anti-NapA antibody and anti-rabbit IgG conjugated to Alexa Fluor 488. Scale bars = 5 μm. (C) Population-level analysis of integrated fluorescent signal intensities of NapA from sacculi isolated from 5A11 (n = 310) and 5A11/napA (n = 345). (D) Scatter-plot analysis of NapA signal in methanol treated, fixed cells (gray, n = 532 see Fig 1D) relative to NapA signal from purified PG (red, n = 310), pre-trypsin treatment. Scatter-plot shading corresponds to +/- 1 standard deviation (STD) while dark lines represent moving averages. (E) Proteinase K assay to determine protein surface exposure. Both 5A11 and 5A11/napA were cultured to identical densities, each split in half, gently harvested by centrifugation, and treated with (+) 5ug/mL of Proteinase K (ProK) or PBS diluent control (-). After 1 hour protease was inactivated and surface exposure of FlaB (left), OspA (middle), or NapA (right) was determined by western blot.
Fig 3
Fig 3. Cell envelope stress and defects of NapA deficient bacteria.
(A) Osmotic and lysozyme susceptibility in wild-type (5A11) and napA mutant (5A11/napA) bacteria. Following exposure to 0.100 M NaCl (total osmolality 544 mOsm, left) or 0.375 mg/mL Lysozyme (right) for 18 hours, each strain was diluted in fresh media and plated. Three (wild-type) or six (mutant) weeks later, CFUs were determined. Bars shown are the mean +/- standard deviation from 4 experimental BSK II plates with either strain. P-value determined using unpaired t-test, * = p < 0.05. (B) Cryo-electron micrographs of the inner membrane (IM), peptidoglycan (PG) and outer membrane (OM) of the 5A11 (top) and 5A11/napA (bottom) strains. Scale bar 100 nm. (C) Population-level analysis of average PG width (right) and average PG pixel intensity (left) normalized by sampling area. Note that measurements excluded PG from 10% of each cell pole since these areas are thicker and more variable. (D) Liquid chromatography spectra attained from muropeptides, isolated from strain 5A11 (black) and 5A11/napA (red). Each strain was cultured, enumerated, and PG was purified for an equal number of bacteria. Following mutanolysin digestion, an equal amount of each sample was injected, and muropeptide abundance (UV absorbance) was plotted as a function of retention time.
Fig 4
Fig 4. NapA is released in outer-membrane vesicles.
(A) Wild-type (5A11) and napA mutant (5A11/napA) were cultured to mid-log (2.5 X 10⁷ cell/mL), cells were collected, washed, and processed into crude lysate (L), Outer membrane vesicles (OMVs), or protoplasmic cylinders (PC) as described in the methods. Each fraction was standardized by total amount of protein (Bradford assay) and assayed by immunoblot for OspA (anti-OspA, upper panel), FlaB (anti-FlaB, middle panel), or NapA (anti-NapA, lower panel).
Fig 5
Fig 5. NapA-PG is released in outer-membrane vesicles.
(A) The same OMV and PC fractions analyzed in Fig 4 were serially diluted and assayed for NapA and PG by dot blot. (B) Reporter assay to query PC and OMV fractions for PG containing Muramyl dipeptide (MDP). Human NOD2 reporter cell line (hNOD2, Invivogen) was used to estimate the relative amount of MDP in sample with and without 20ug/mL of gefitinib—an inhibitor of the effector downstream of hNOD2, RIP2. MDP (50 pg/mL) served as the positive control (C) reactions. Bars shown are the mean of samples tested in triplicate, +/- standard deviation. ** = p < 0.001, unpaired t-test, with and without inhibitor.
Fig 6
Fig 6. NapA stimulates IL-17 and induces neutrophil migration.
(A) IL-17 production by human peripheral blood mononuclear cells (PBMCs). Three pools of eight mixed donor PBMCs samples were stimulated with 10 ug/mL of PG, before and after trypsin treatment, from wild-type and napA mutant bacteria. Culture supernatants, from each stimulation, were assayed for IL-17 by ELISA (Abcam). Values are the mean, +/- standard deviation, after normalizing for untreated, PBS diluent control are shown. Statistical analysis unpaired t-test, * = p < 0.005. (B) Merged Phase-contract/epifluorescence micrograph of microfluidic competitive chemotaxis-chip (μC3) (55) used to measure dHL-60 cell (blue) migration both toward (red) and away (black) from gradients of each stimulus. Scale bar = 500 μm. (C) dHL-60 cells show a higher percentage of cells migrating toward PG-linked NapA. Reservoirs that flank each maze were loaded with 125 μg/mL of each PG sample, diluted in dHL-60 cell culture media, and compared to opposite reservoir, which contained culture media alone. Controls included media, 10nM of Formylmethionine-leucyl-phenylalanine (fMLP), and 100nM of Leukotriene B4 (LTB4). Data were collected over 5 hours, images captured every 2 minutes, while cells were maintained at 37°C under 5% CO2. Results shown are mean +/- SD of three biological replicate experiments. To evaluate differences between responses ANOVA were performed with Turkey’s correction for multiple comparisons (* = p < 0.05, ** = p < 0.005).

References

    1. Prevention CfDCa. Recent Lyme disease surveillance data November 7, 2019. [Available from: https://www.cdc.gov/lyme/datasurveillance/recent-surveillance-data.html.
    1. Kugeler KJ, Schwartz AM, Delorey MJ, Mead PS, Hinckley AF. Estimating the Frequency of Lyme Disease Diagnoses, United States, 2010–2018. Emerg Infect Dis. 2021;27(2):616–9. 10.3201/eid2702.202731 - DOI - PMC - PubMed
    1. Mead PS. Epidemiology of Lyme disease. Infectious Disease Clinics. 2015;29(2):187–210. 10.1016/j.idc.2015.02.010 - DOI - PubMed
    1. Eisen RJ, Eisen L, Beard CB. County-scale distribution of Ixodes scapularis and Ixodes pacificus (Acari: Ixodidae) in the continental United States. J Med Entomol. 2016;53(2):349–86. 10.1093/jme/tjv237 - DOI - PMC - PubMed
    1. Bisanzio D, Fernández MP, Martello E, Reithinger R, Diuk-Wasser MA. Current and future spatiotemporal patterns of Lyme disease reporting in the northeastern United States. JAMA Netw Open. 2020;3(3):e200319. 10.1001/jamanetworkopen.2020.0319 - DOI - PMC - PubMed

Publication types