. 2021 Jul 1;28(7):1248-1261.e8.
doi: 10.1016/j.stem.2021.04.003. Epub 2021 May 12.

Discrete limbal epithelial stem cell populations mediate corneal homeostasis and wound healing

Affiliations

Discrete limbal epithelial stem cell populations mediate corneal homeostasis and wound healing

Anna Altshuler et al. Cell Stem Cell. .

Abstract

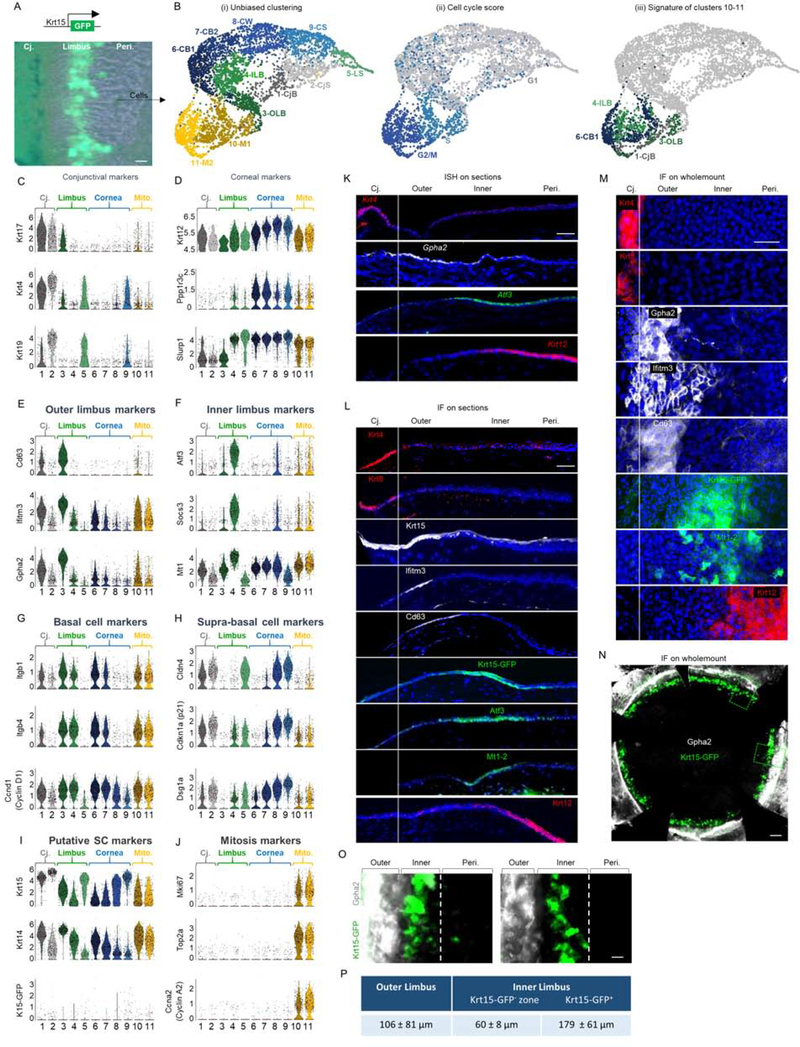
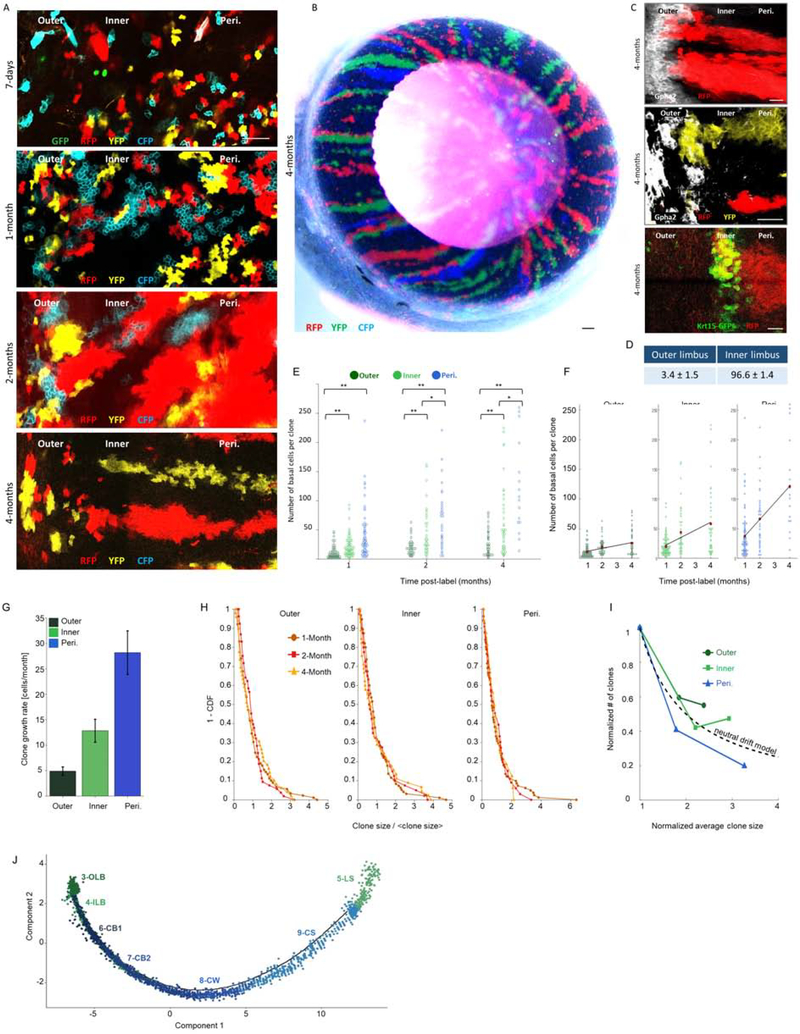
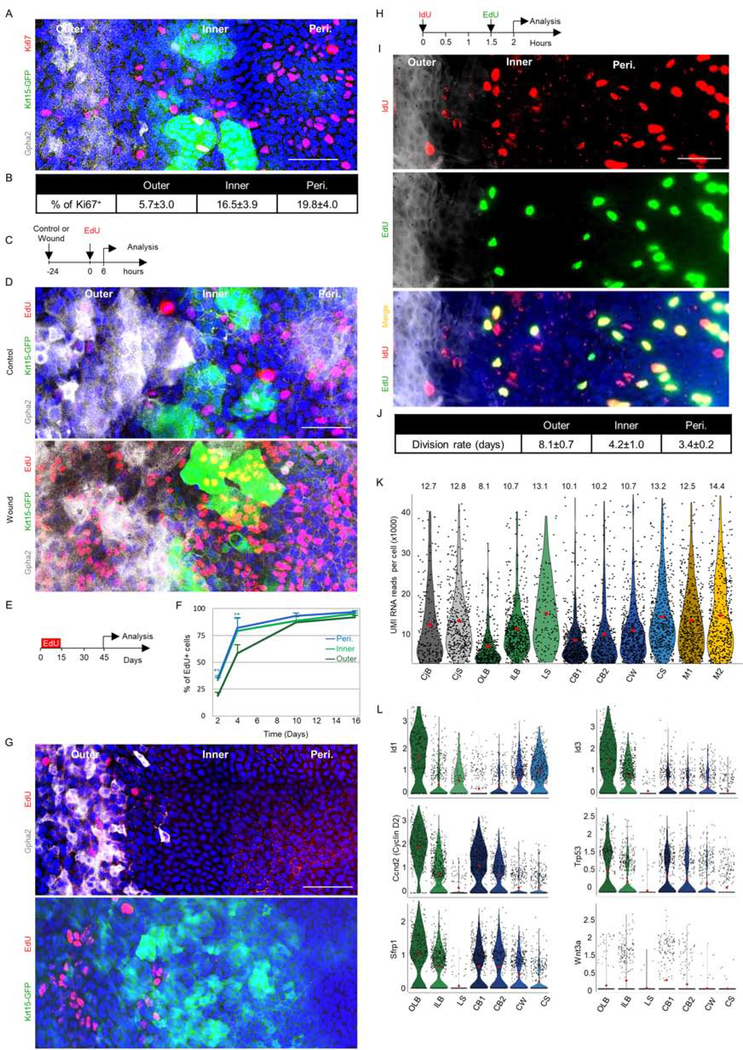
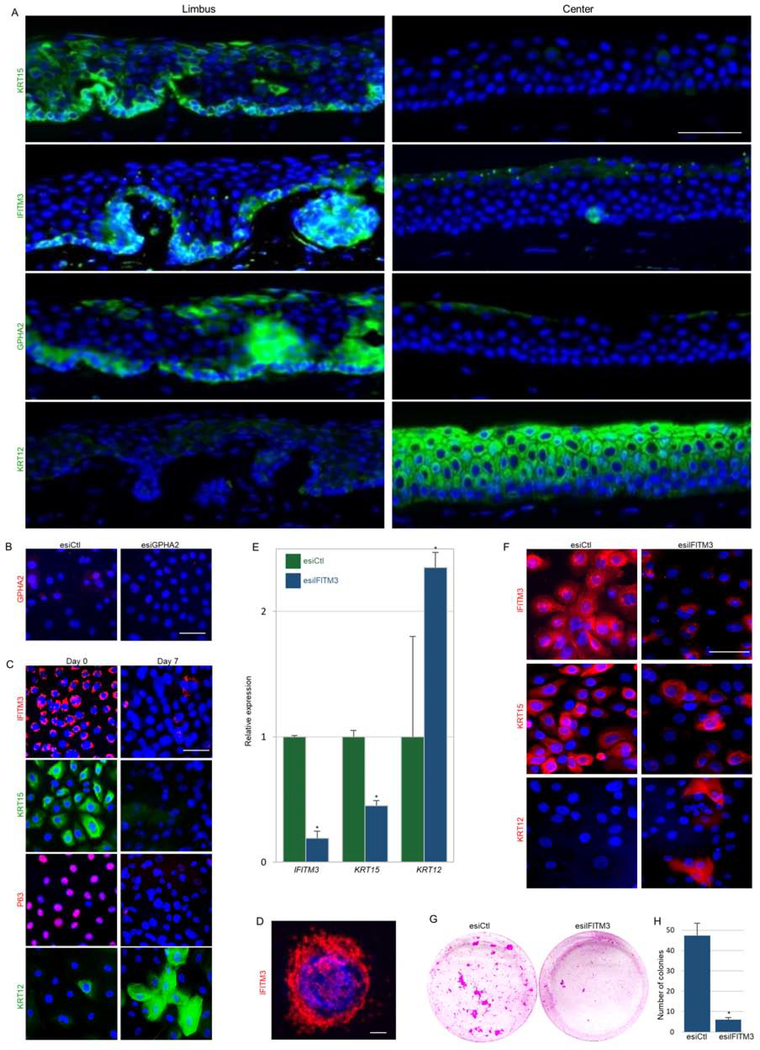
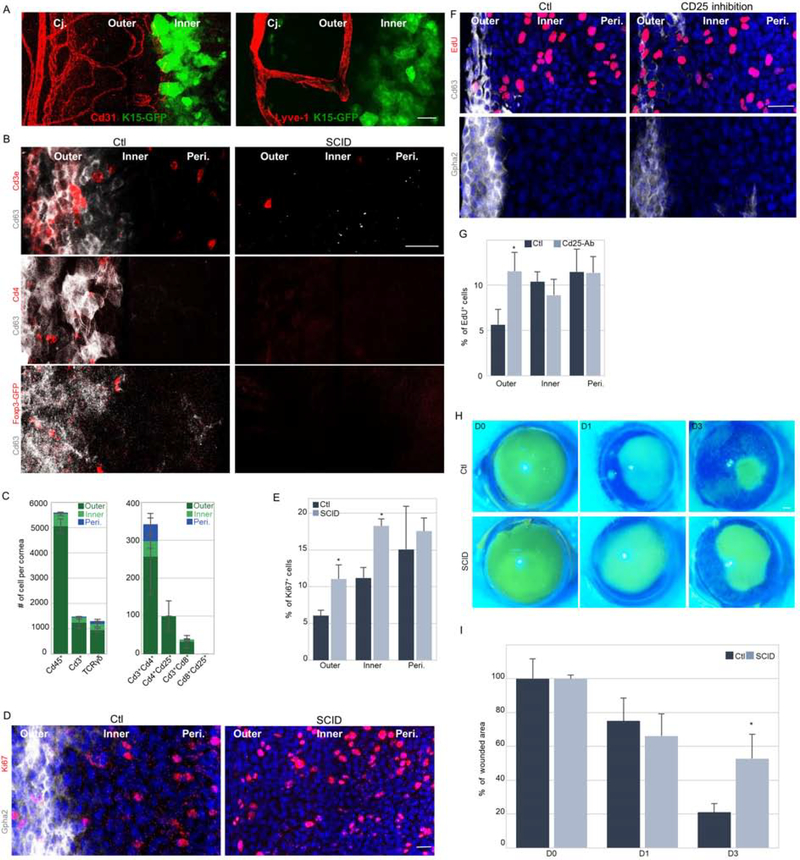
The accessibility and transparency of the cornea permit robust stem cell labeling and in vivo cell fate mapping. Limbal epithelial stem cells (LSCs) that renew the cornea are traditionally viewed as rare, slow-cycling cells that follow deterministic rules dictating their self-renewal or differentiation. Here, we combined single-cell RNA sequencing and advanced quantitative lineage tracing for in-depth analysis of the murine limbal epithelium. These analysis revealed the co-existence of two LSC populations localized in separate and well-defined sub-compartments, termed the "outer" and "inner" limbus. The primitive population of quiescent outer LSCs participates in wound healing and boundary formation, and these cells are regulated by T cells, which serve as a niche. In contrast, the inner peri-corneal limbus hosts active LSCs that maintain corneal epithelial homeostasis. Quantitative analyses suggest that LSC populations are abundant, following stochastic rules and neutral drift dynamics. Together these results demonstrate that discrete LSC populations mediate corneal homeostasis and regeneration.

Keywords: cornea; immune cells; limbal stem cells; limbus; lineage tracing; mathematical modeling; niche; single cell RNA sequencing; stem cell dynamics.


Conflict of interest statement

Declaration of interests The authors declare no competing interests.

Figures

Figure 1:
Figure 1:. scRNA-seq reveals corneal epithelial cell states including 2 distinct basal limbal epithelial cell populations.
(A-B) The limbus (with marginal conjunctiva and cornea) of 10 corneas of 2.5-month old Krt15-GFP transgenic mice was dissected, pooled and epithelial cells were subjected to scRNA-seq analysis. (B) UMAP plots presentations of (i) Unbiased clustering revealed 11 distinct groups of cells. (ii) Cell cycle score analysis revealed that most cells in clusters 10–11 display the signature of cells captured in specific stages of mitosis. (iii) Cell type classification for clusters 10–11 shows they consist of a mixture of cells with a hallmark of different ocular basal cells. (C-J) Violin plots of differentially expressed markers in each cluster. Y-axis in C-J represents expression level. (K-O) In situ hybridization (ISH) (K) or immunofluorescent staining (IF) on tissue sections (L) or wholemount (M-O) of 2-month-old mice for the indicated markers. (P) Analysis of the width (mean ± standard deviation) of limbal sub-compartments. n=3 corneas. Scale bars were 50 μm (A-M, O-P) or 300 μm (N). Nuclei were counter stained by DAPI. Abbreviations: Cj., conjunctiva; Mito., mitosis; Peri., periphery; CjB, conjunctival basal; CjS, conjunctival suprabasal; OLB, outer limbal basal; ILB, inner limbal basal; LS, limbal superficial; CB1, corneal basal 1; CB2, corneal basal 2; CW, corneal wing; CS, corneal superficial, M1/M2, cells in mitosis. See also Figures S1, S2, and S3.
Fig 2:
Fig 2:. Quantitative “Confetti” lineage tracing unravels the dynamics of outer and inner LSCs.
Lineage tracing was induced by tamoxifen injection in 2-month-old UBC-CreERT2; Brainbow2.1“Confetti” mice (see Fig. S4B–C). Confetti-positive clones were analyzed at the indicated time points post-induction. Typical tile sean confocal images of the limbal zones are shown in (A, C) and the entire eye (cornea view) is shown in (B). The same pictures shown here in A, are also shown in Fig. S4D together with Gpha2 co-staining. (D) The percentage of stripes that emerged from the outer or inner limbus. (E-F) A Scatter plot of clone size distributions shows the indicated regions over time (E) or across the different time points for the different colonial regions (F). Red dots denote the average clone size and the black line indicates the linear model that fits the data. (G) The clonal effective growth rate, as estimated from the linear fit. Error bars are 95% confidence interval (CI). Note that the 95% CI do not overlap. (H) One minus the cumulative distribution function of the clone size divided by the mean clone size. The scaled distributions collapse onto the same curve (compare to Fig. S4G, which shows the non-scaled distributions). (I) The normalized number of clones as a function of normalized clone size. The dotted line denotes the inverse relation between clone size and clone number as expected from the neutral drift model. (J) Pseudotime plot predicts the differentiation process across clusters. Scale bars are 100 μm (A, C) and 50 μm for (B). n=15 areas from 3–5 corneas of 3 individuals. Statistical significance was calculated using the Kolmogorov-Smirnov test. (*, p-value < 0.05; ** p-value <0.005). Abbreviations: Peri., Periphery; OLB, outer limbal basal; ILB, inner limbal basal; LS, limbal superficial; CB1, corneal basal 1; CB2, corneal basal 2; CW, corneal wing; CS, corneal superficial. See also Figure S4.
Fig 3:
Fig 3:. Proliferation analysis of slow-cycling and frequently dividing LSCs.
Adult 2–3- month- old Krt15-GFP mice were used for all experiments. The limbal region markers in wholemount corneas were defined by Gpha2/K15-GFP, nuclei were detected by DAPI counter staining (A, D, G, I) while Ki67+ cells were stained (A) and quantified (B). (C-D). Corneal epithelial debridement was followed by EdU injection and 6 hours later, cells in S-phase (EdU+) were identified in wounded or uninjured controls. A schematic illustration is shown in (C) and a typical tile scan confocal image of wholemount immunostaining is shown in (D). (E-G) Water-based EdU administration for 15-days (pulse) was followed by a 30-day chase. Schematic illustration (E), quantification of EdU accumulation in basal cells over time (F), and typical tile scan confocal image of wholemount staining with regional markers (G) is shown. (H-J) Double nucleotide (IdU/EdU) injection with an interval of 1.5 hours was followed (0.5 an hour later) by tissue harvesting and quantitative analysis (see methods) on wholemount staining. Schematic illustration (H), representative image (I), and an estimated cell cycle for each zone (J) is shown (n=15 areas from 3 corneas of 3 individuals). (K) Violin plot diagram of unique molecular identifiers (UMI) RNA reads per cell in each cluster. (L) Violin plot showing the expression of the indicated genes involved in SC quiescence or activation. Y-axis in L represents expression level. Statistical significance was calculated using the One-way ANOVA test followed by the Bonferroni test (*, p-value<0.05). Data represented as mean ± standard deviation, Abbreviations: Peri., periphery; CjB, conjunctival basal; CjS, conjunctival suprabasal; OLB, outer limbal basal; ILB, inner limbal basal; LS, limbal superficial; CB1, corneal basal 1; CB2, corneal basal 2; CW, corneal wing; CS, corneal superficial; M1/M2, mitosis. Scale bars, 50 μm.
Figure 4:
Figure 4:. GPHA2 and IFITM3 marked qLSCs while IFITM3 supported the undifferentiated state in vitro.
(A) Human cornea frozen sections were subjected to immunofluorescence staining of indicated markers. (B) Human limbal epithelial cells were transfected with endoribonuclease prepared small interfering RNA against GPHA2 (esiGPHA2) or control (esiCtl) and cells were immunostained for GPHA2. (C) Human limbal epithelial cells were cultured and maintained undifferentiated at low calcium (Day 0) or induced to differentiate (Day 7) and stained for the indicated markers. (D) High magnification of IFITM3 staining (day 0). (E-H) Undifferentiated cells were transfected with esiIFITM3 or esiCtl. (E-F) The expression of the indicated markers was examined 4–5 days post-transfection by quantitative real-time polymerase chain reaction (E) and immunofluorescent staining (F). (G-H) Transfectants were seeded at clonal density and allowed to grow for 2–3 weeks. Rhodamine-stained colonies are shown in (G) and quantification in (H). Nuclei were detected by DAPI counter staining (A-D, F). Scale bars are 50 μm or 10 μm (D). Statistical significance was calculated using t-test (*, p-value<0.05). Data are represented as mean ± SD.
Figure 5:
Figure 5:. T cells regúlate qLSC proliferation and response to wound Stimulus.
(A) Wholemount immunostaining of corneas was performed to label blood (Cd31) and lymph (Lyve-1) vessels of 2–3 months old Krt15-GFP mice. (B,D) Wholemount immunostaining of corneas of immunodeficient mice (SCID) or controls (Ctl) to identify qLSCs (Cd63+ or Gpha2+) or T cell populations (Cde3+ and Cd4+, or FoxP3-GFP+ transgene) or dividing cells (Ki67+). (C) Quantification of the different immune cell populations in a cornea (n=3). (E) Quantification of Ki67 expression in different limbal zones. (F) Six-days post subconjunctival injection of anti-Cd25 antibody (inhibits regulatory T cells) or vehicle (Ctl) to Krt15-GFP mice, EdU was injected and 6-hours later wholemount immunostaining of the indicated qLSC markers and EdU (mitotic cells) was performed. (G) Quantification of EdU labeling in different limbal zones. (H-I) Corneal epithelial debridement was performed in 2-month old mice of the indicated genotype. Fluorescein dye stain was performed to follow wound closure. Typical images (H) and quantification (I) are shown. Nuclei were detected by DAPI counter staining (D,F). Scale bars are 50 μm. Data represented as mean ± standard error. Statistical significance was calculated using t-test (*, p-value<0.05). Abbreviations: Cj., conjunctiva; Peri., periphery. See also Figures S5.

Comment in

References

    1. Amitai-Lange A, Altshuler A, Bubley J, Dbayat N, Tiosano B, and Shalom-Feuerstein R (2015a). Lineage tracing of stem and progenitor cells of the murine corneal epithelium. Stem Cells 33,230–239. - PubMed
    1. Amitai-Lange A, Berkowitz E, Altshuler A, Dbayat N, Nasser W, Suss-Toby E, Tiosano B, and Shalom-Feuerstein R (2015b). A Method for Lineage Tracing of Corneal Cells Using Multi-color Fluorescent Reporter Mice. J. Vis. Exp. e53370. - PMC - PubMed
    1. Barrandon Y, and Green H (1987). Three clonal types of keratinocyte with different capacities for multiplication. Proc. Natl. Acad. Sci. U. S. A. 84,2302–2306. - PMC - PubMed
    1. Brack AS, and Rando TA (2012). Tissue-specific stem cells: lessons from the skeletal muscle satellite cell. Cell Stem Cell 10,504–514. - PMC - PubMed
    1. Brandner JM, Kief S, Grund C, Rendl M, Houdek P, Kuhn C, Tschachler E, Franke WW, and Moll I (2002). Organization and formation of the tight junction system in human epidermis and cultured keratinocytes. Eur. J. Cell Biol. 81,253–263. - PubMed

Publication types