. 2021 Jul 1;28(7):1233-1247.e4.
doi: 10.1016/j.stem.2021.02.022. Epub 2021 May 12.

Two-photon live imaging of single corneal stem cells reveals compartmentalized organization of the limbal niche

Affiliations

Two-photon live imaging of single corneal stem cells reveals compartmentalized organization of the limbal niche

Olivia Farrelly et al. Cell Stem Cell. .

Abstract

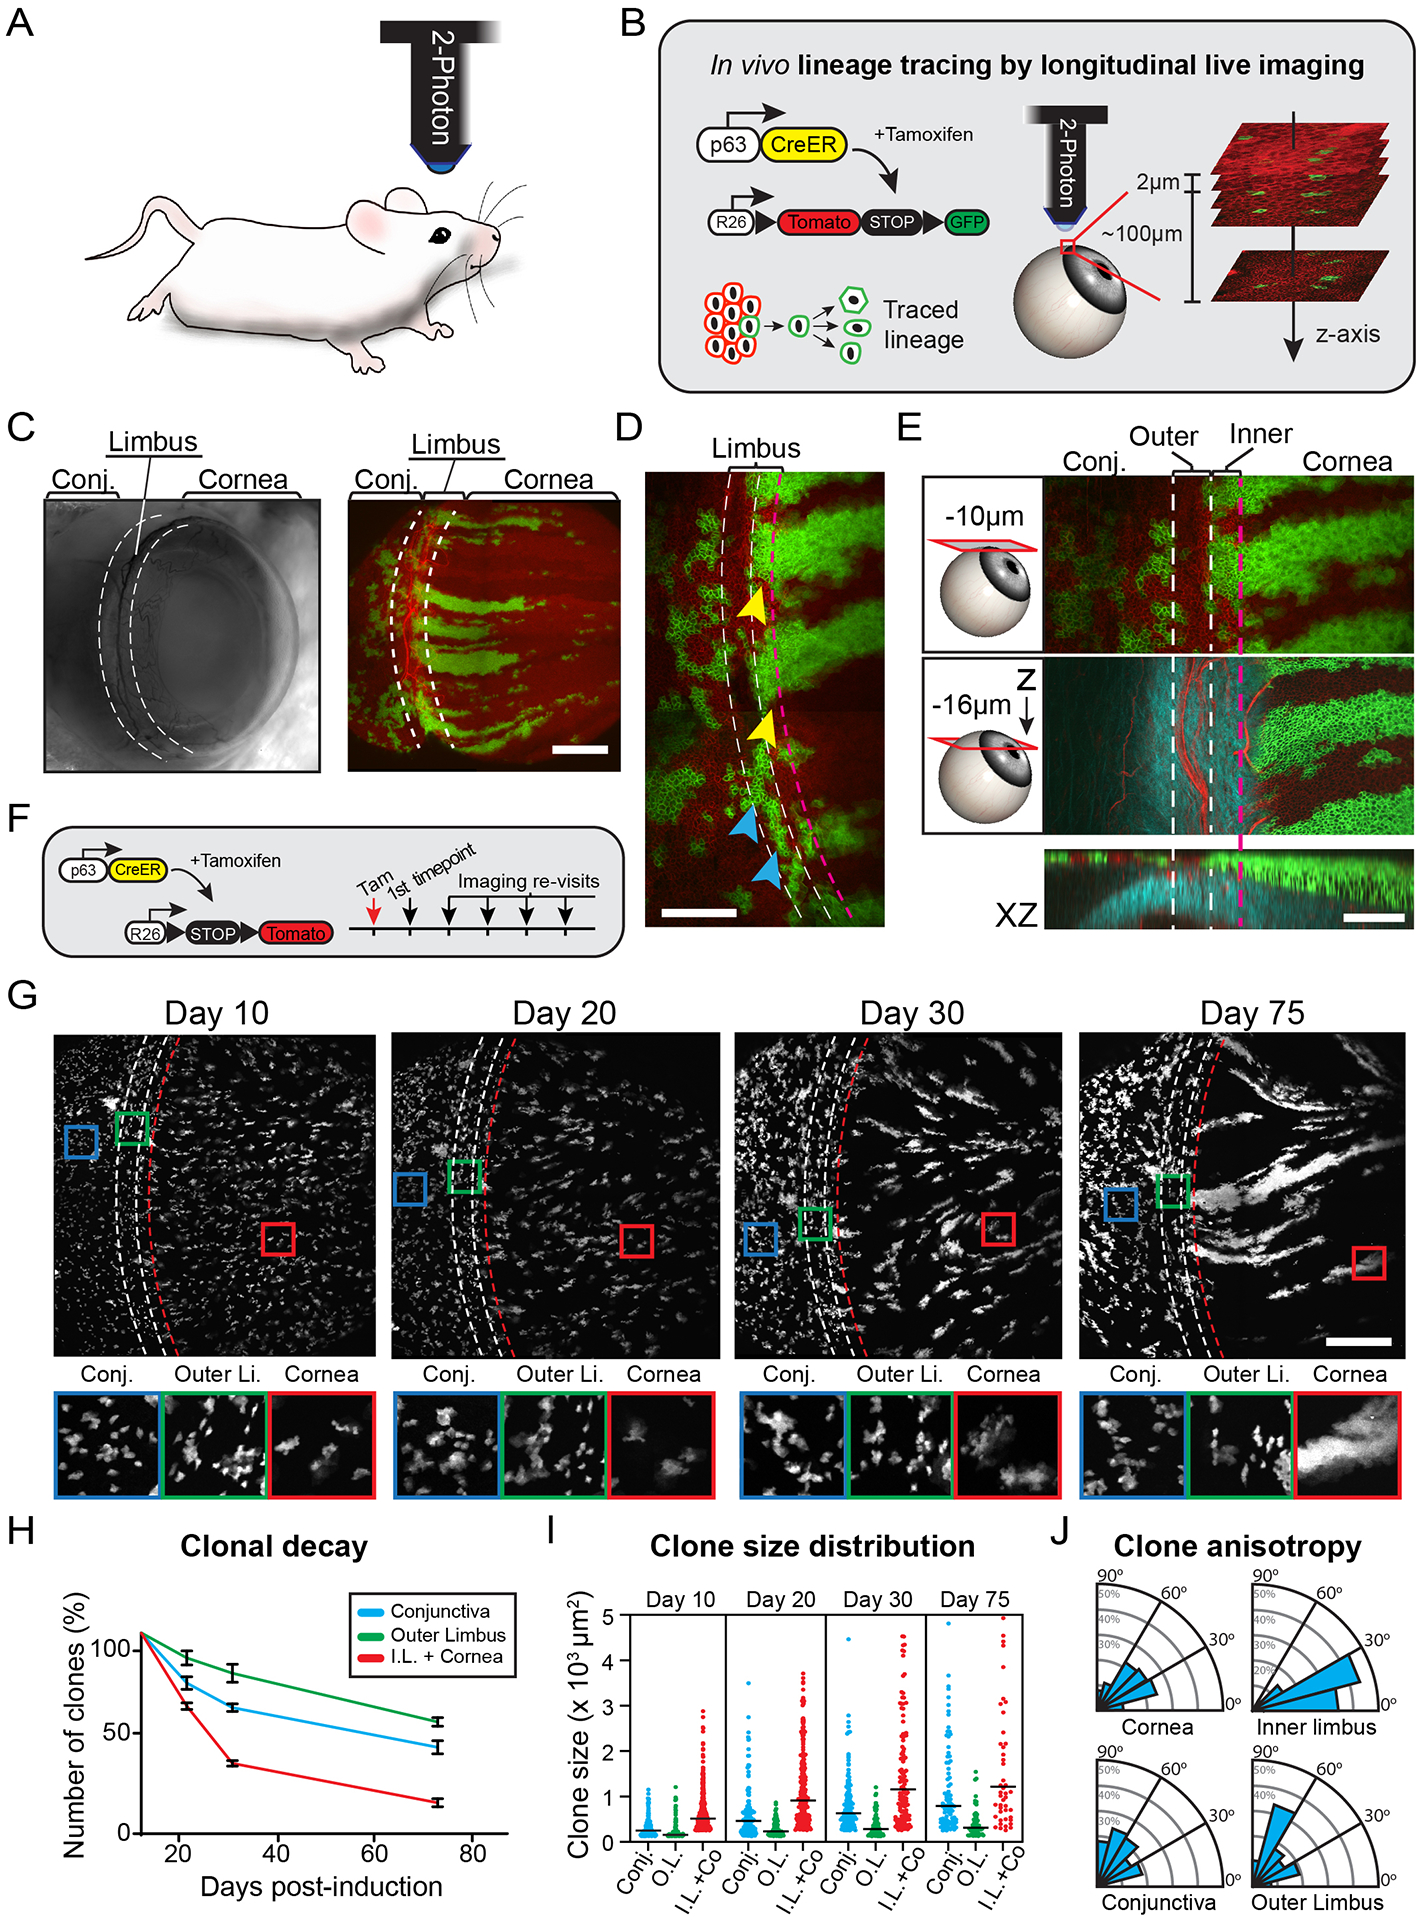
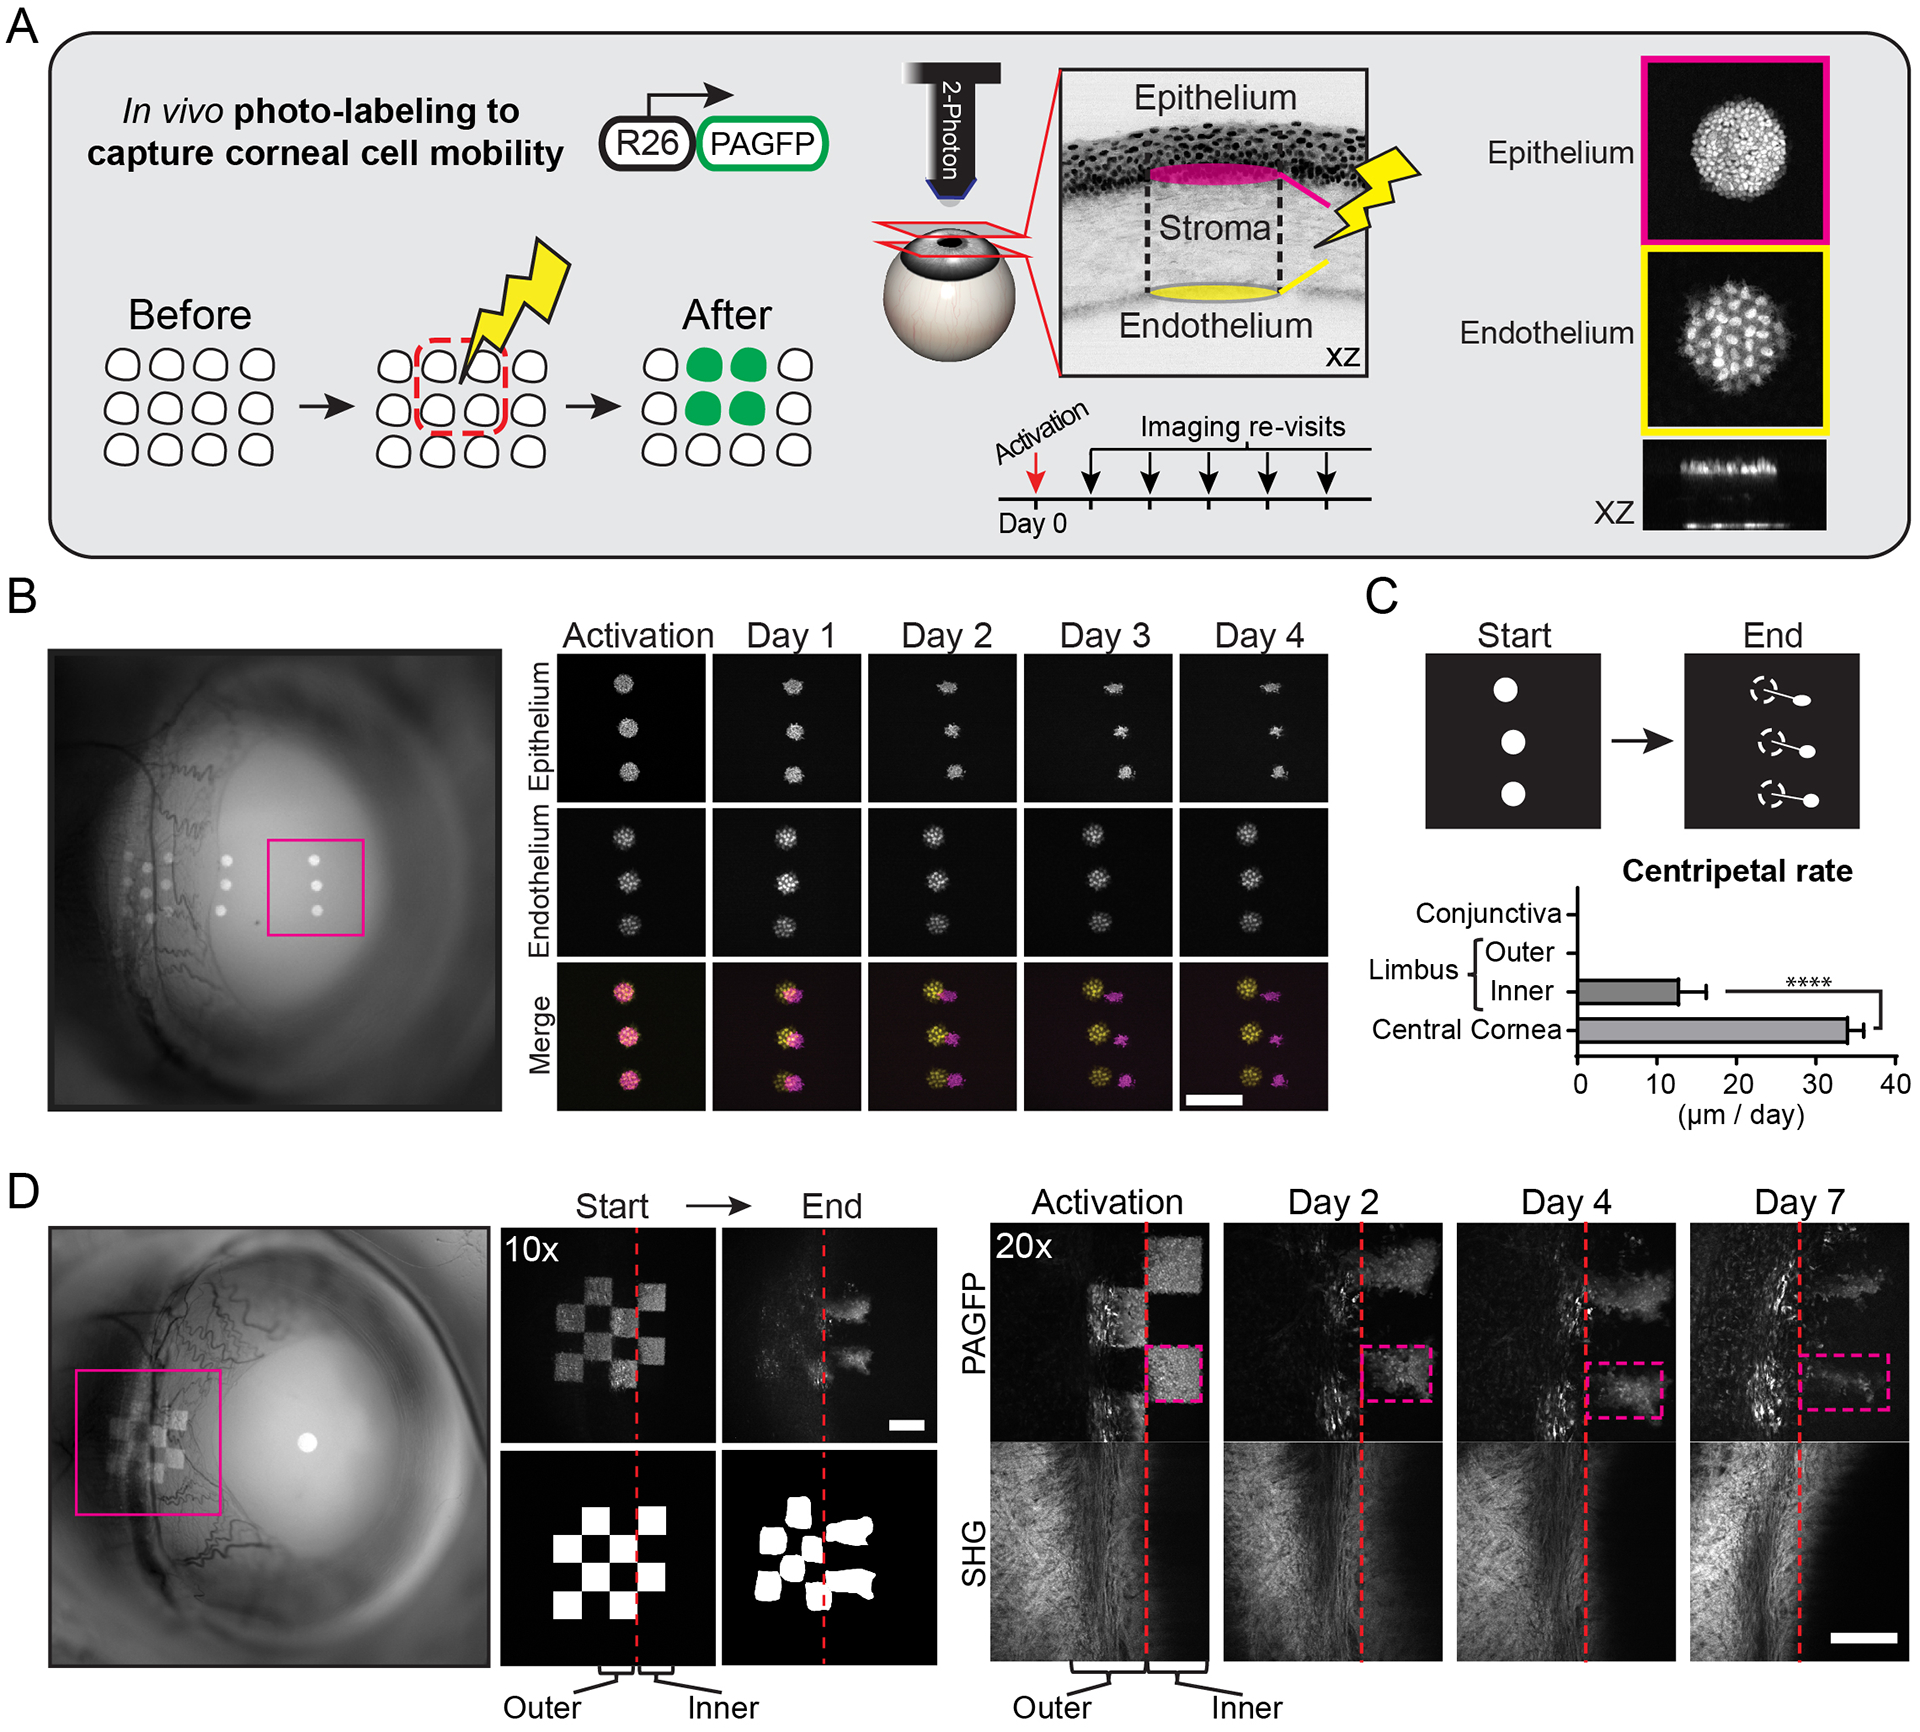
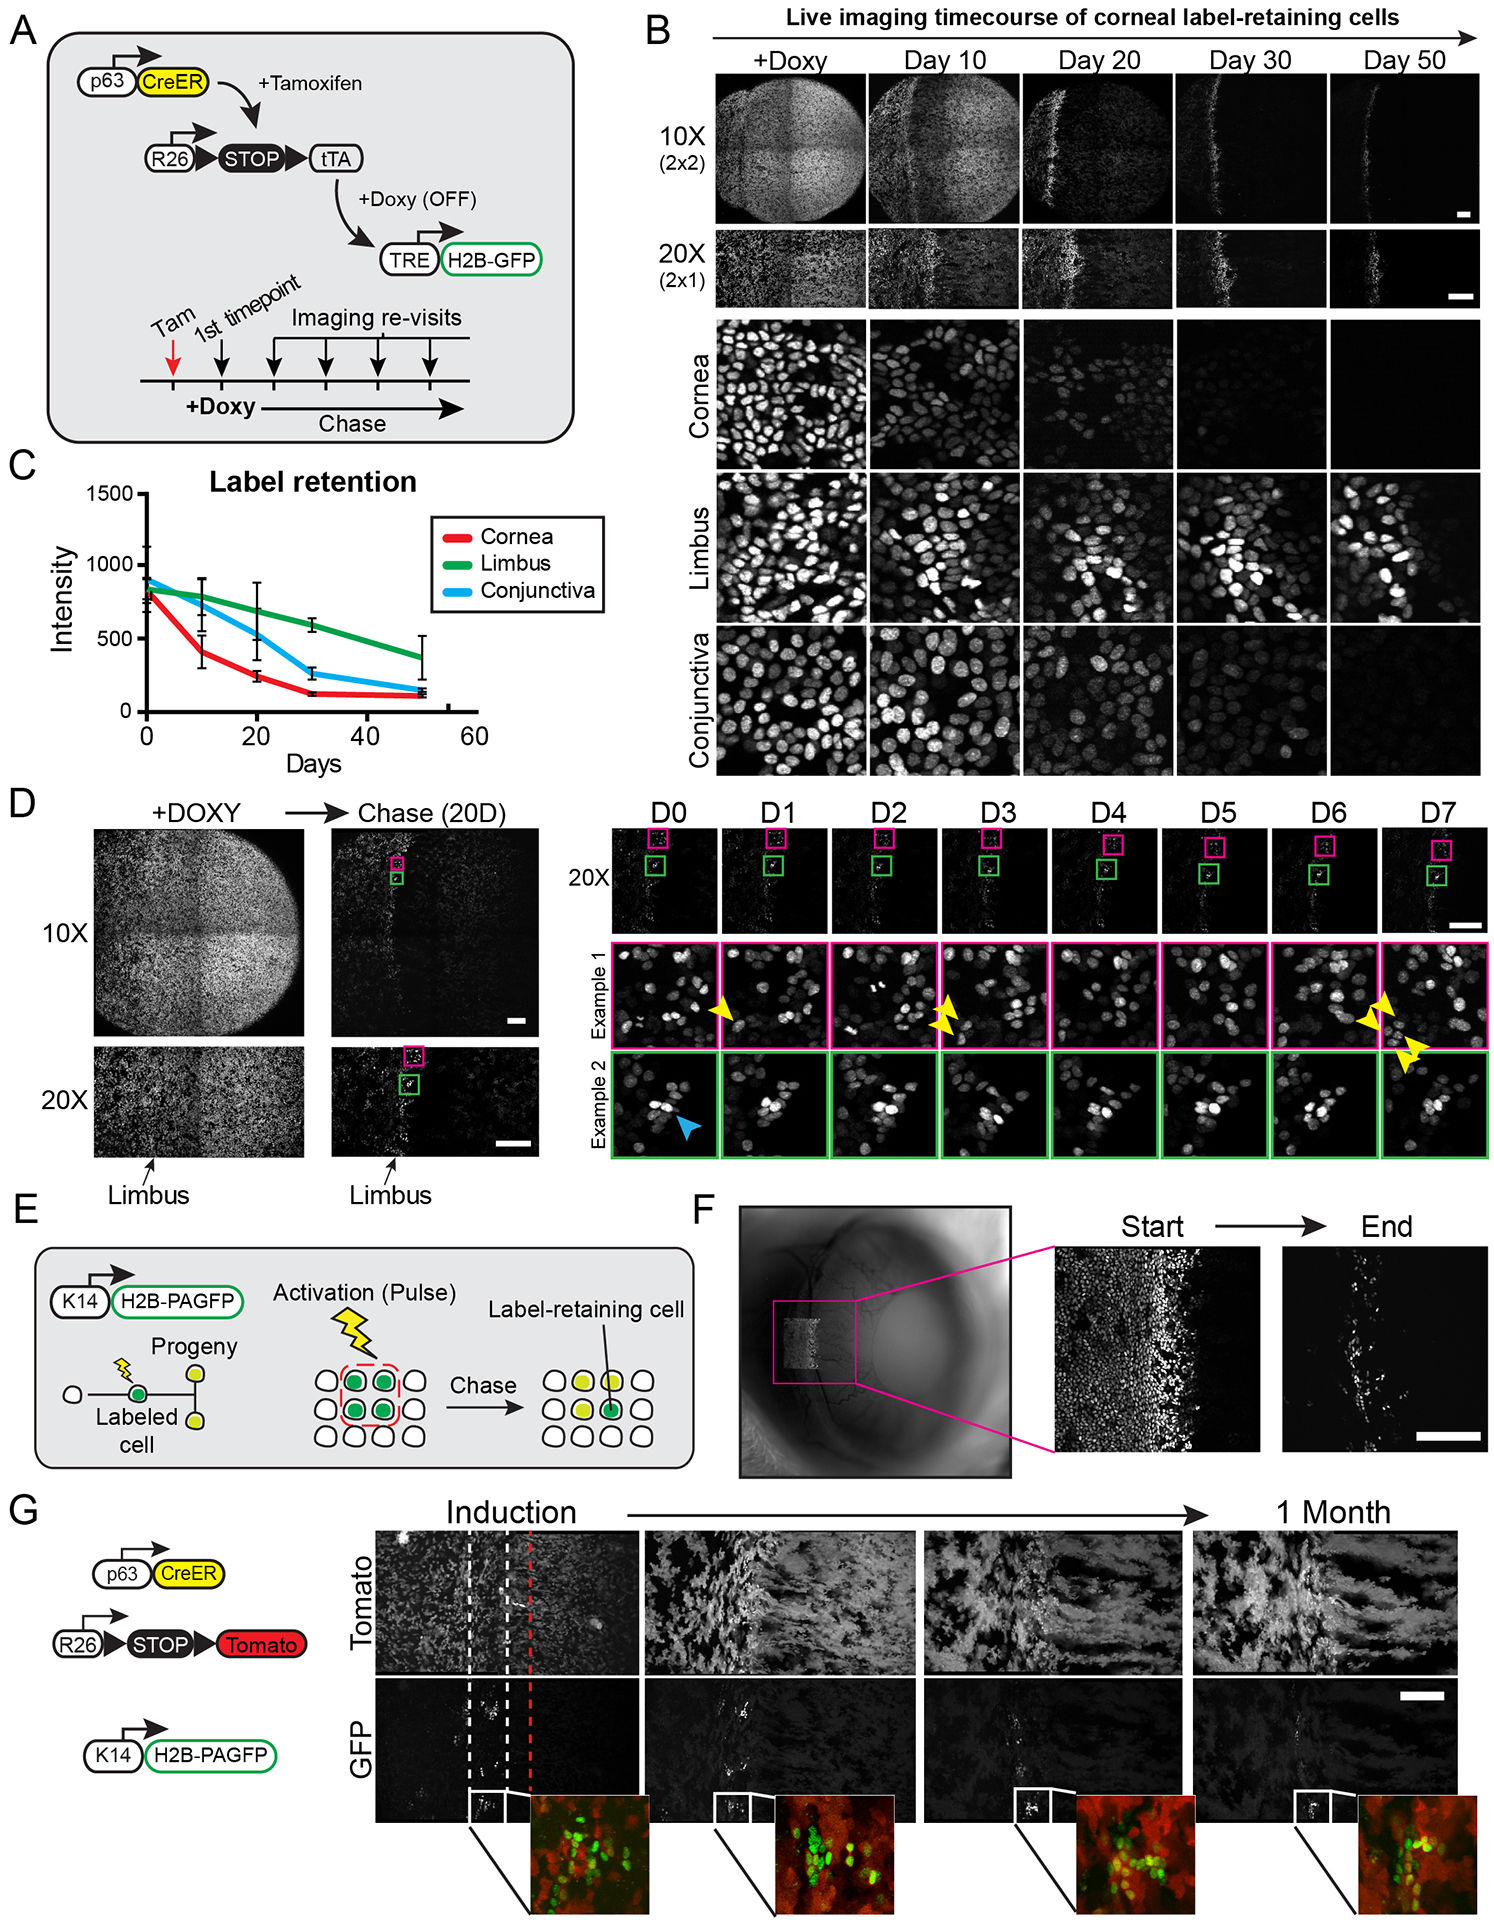
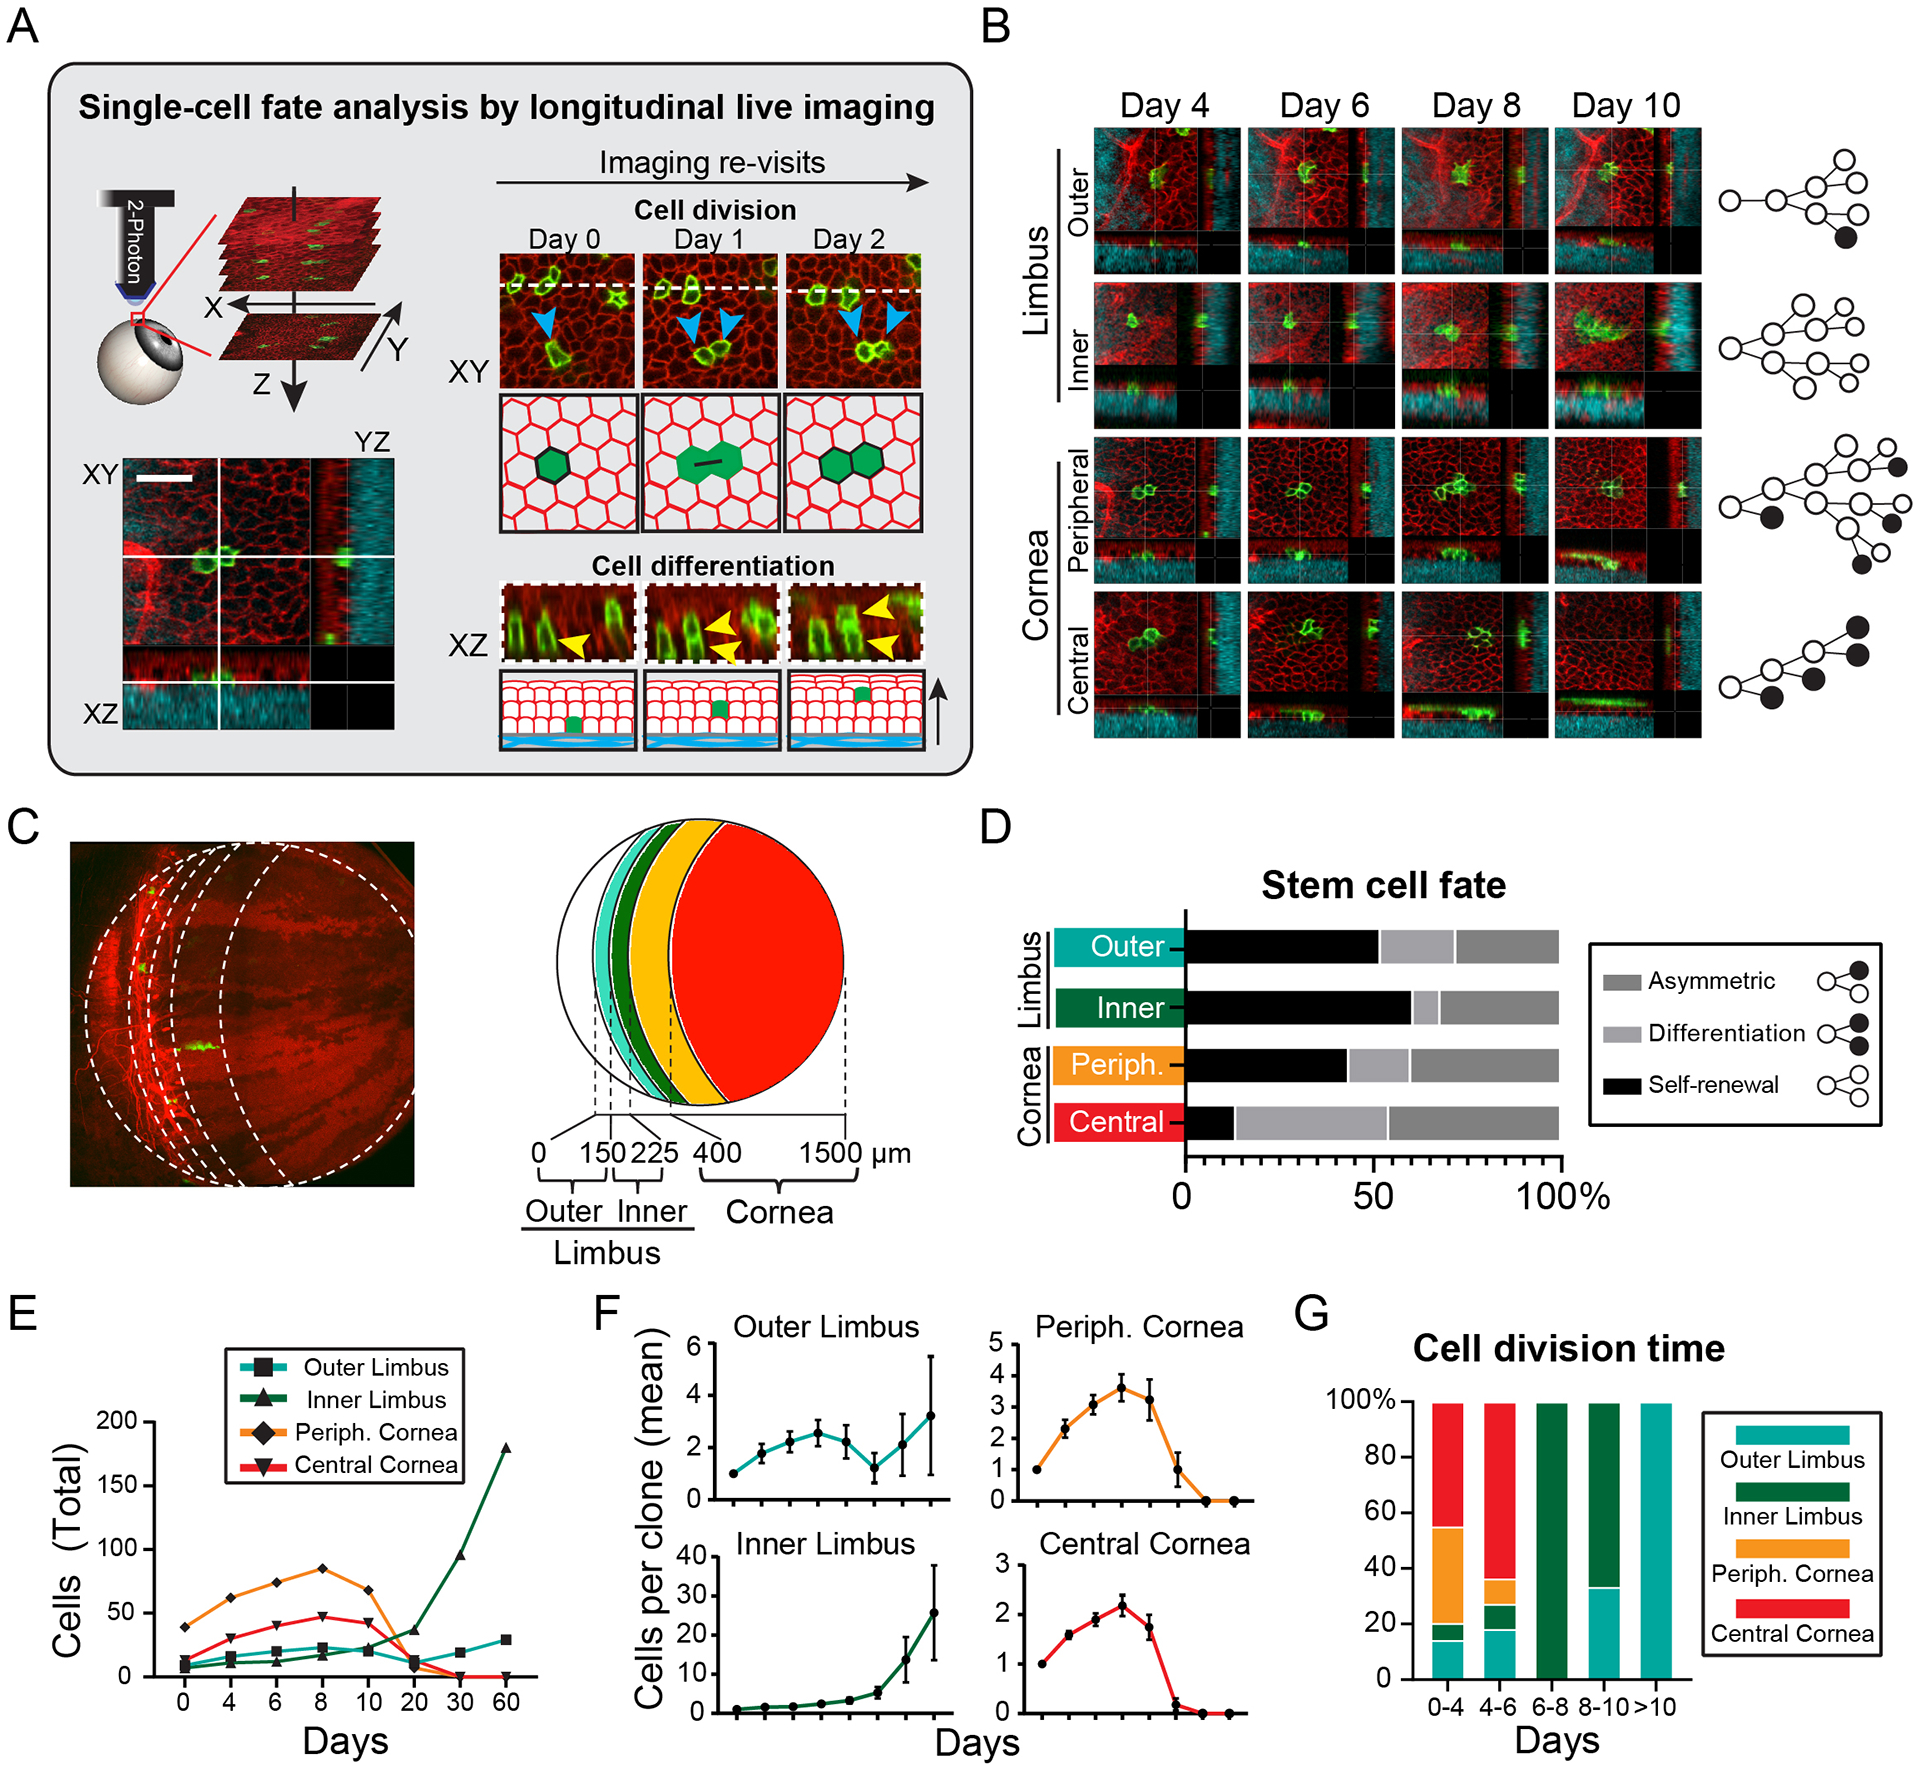
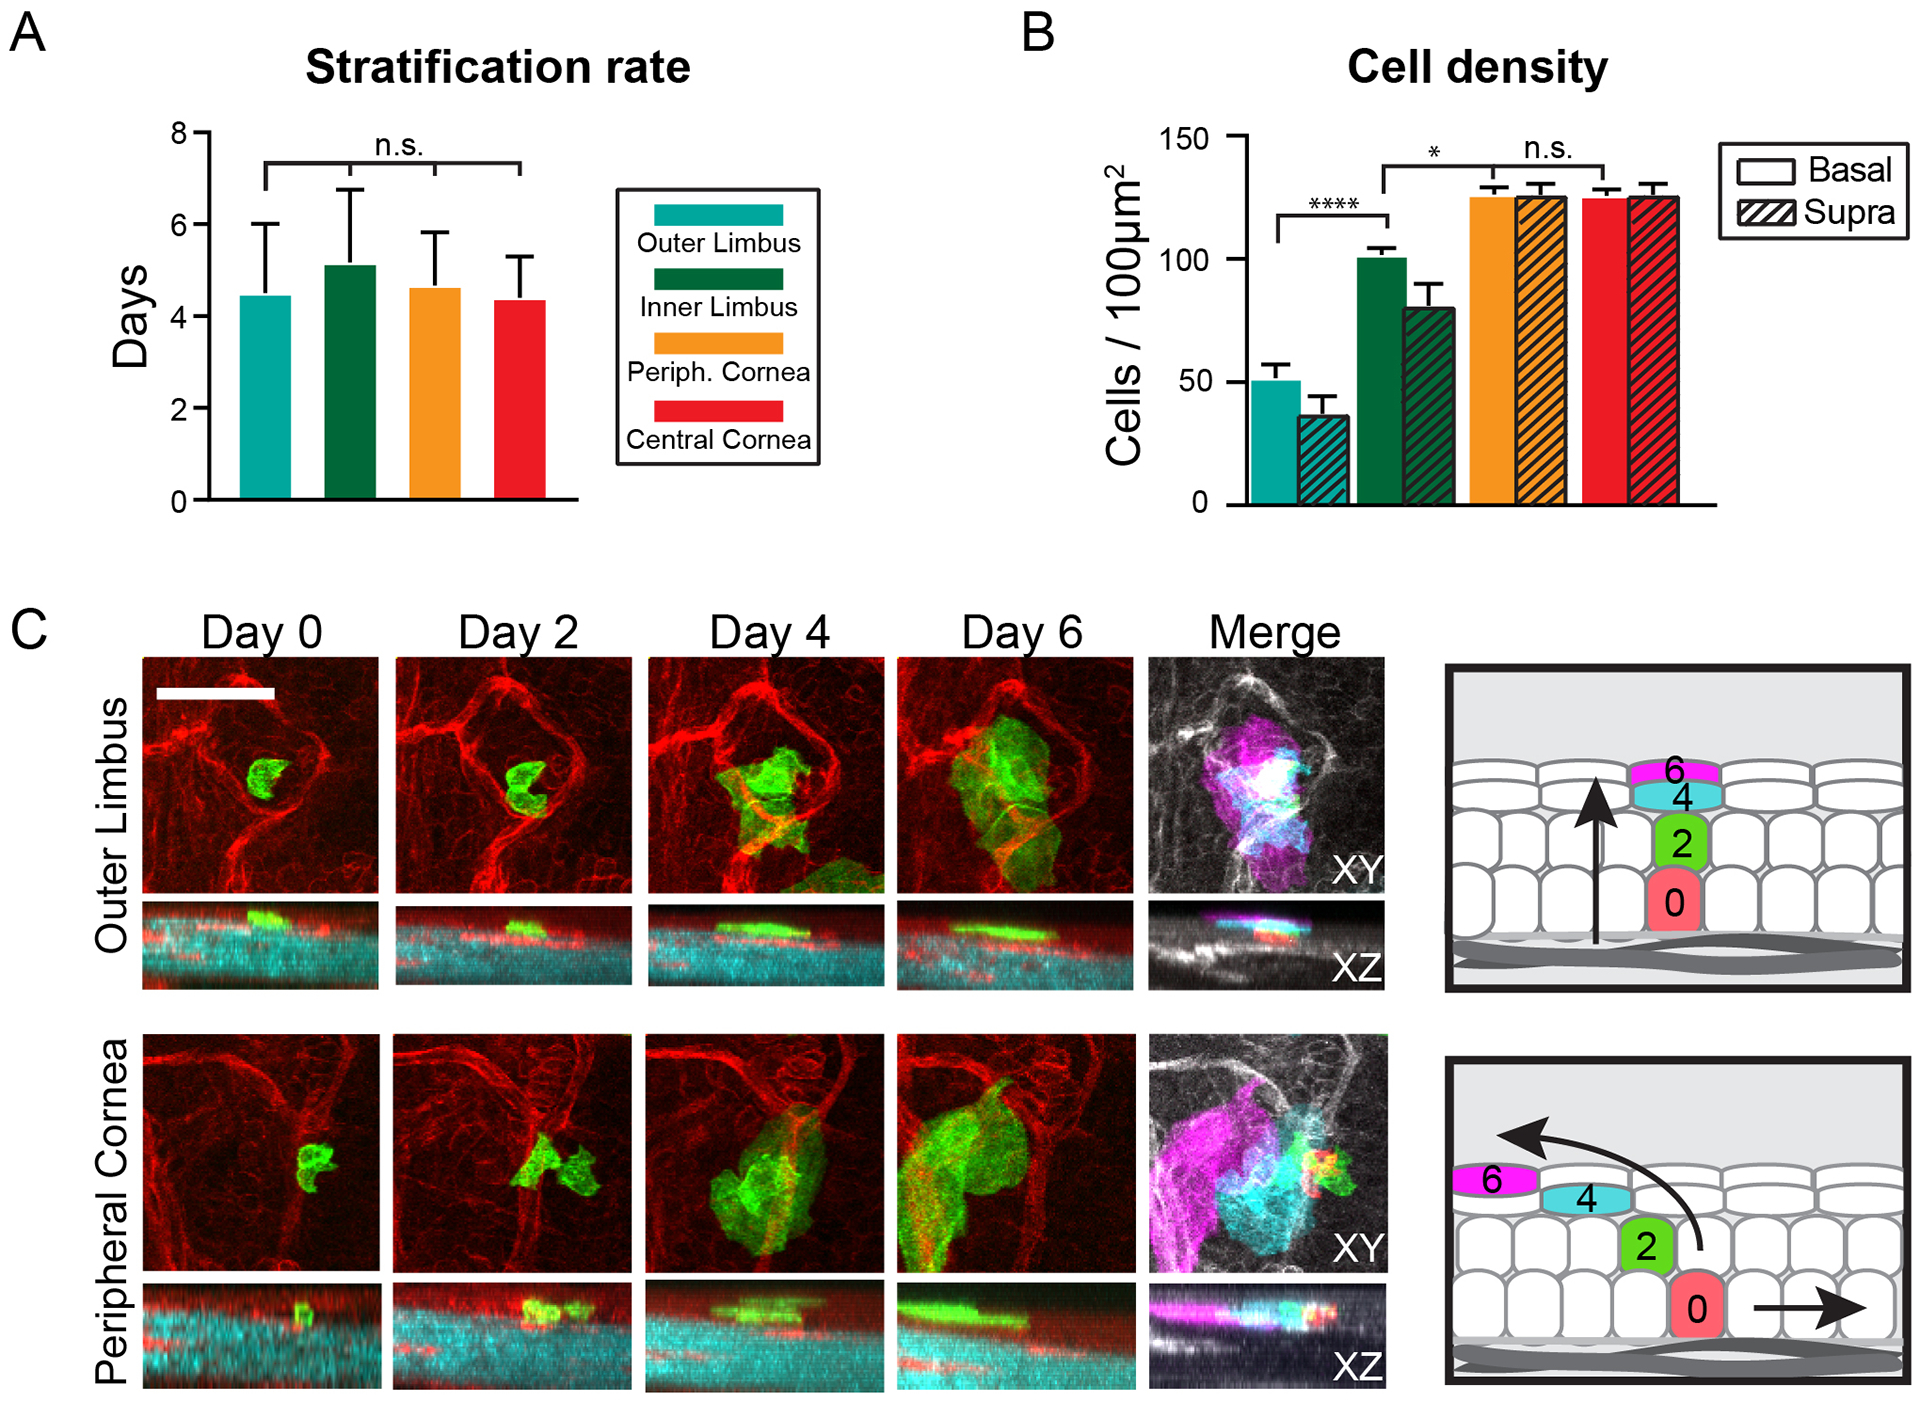
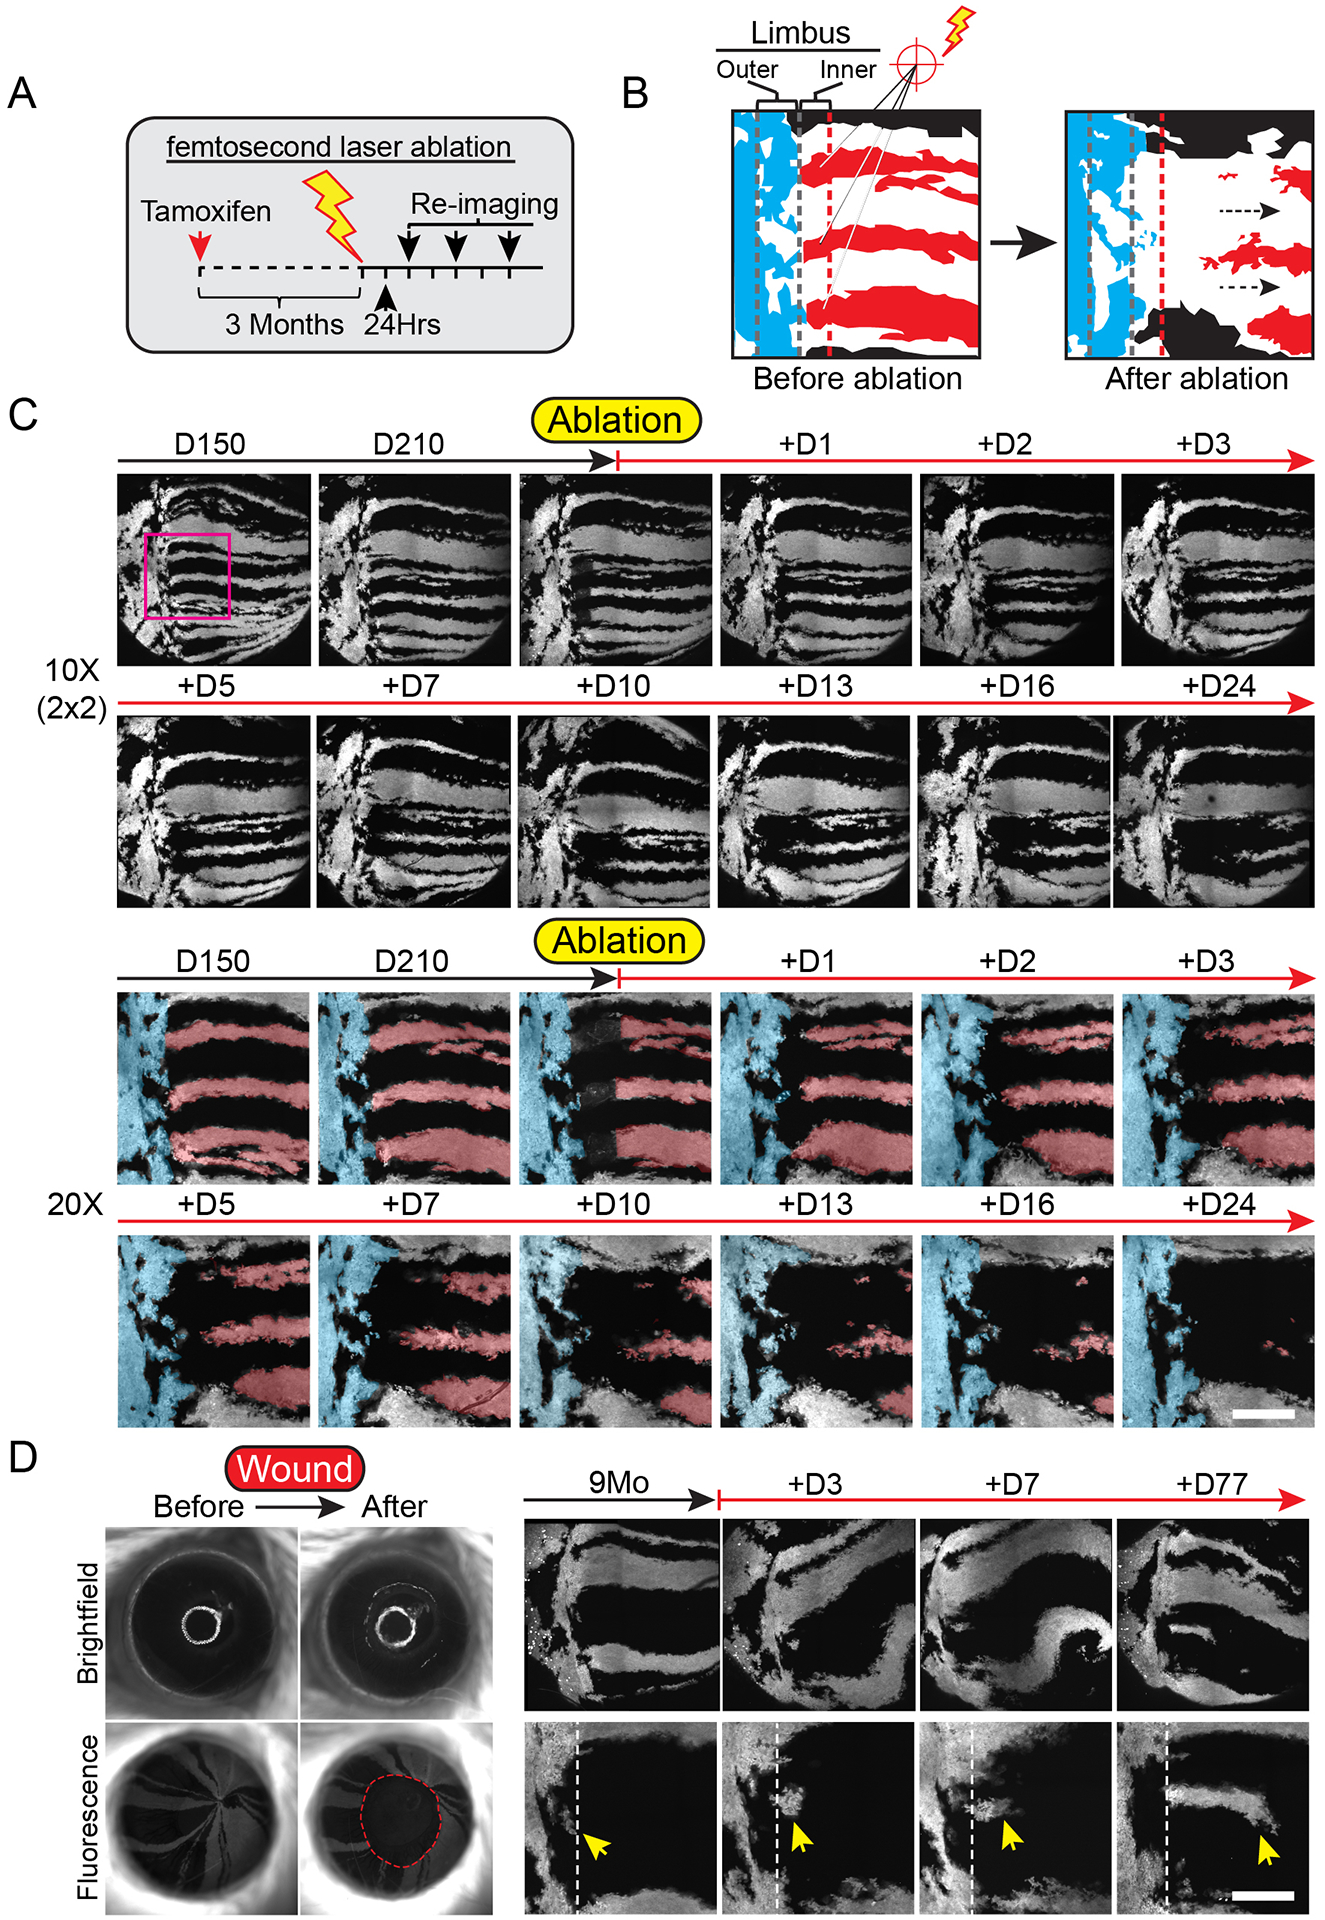
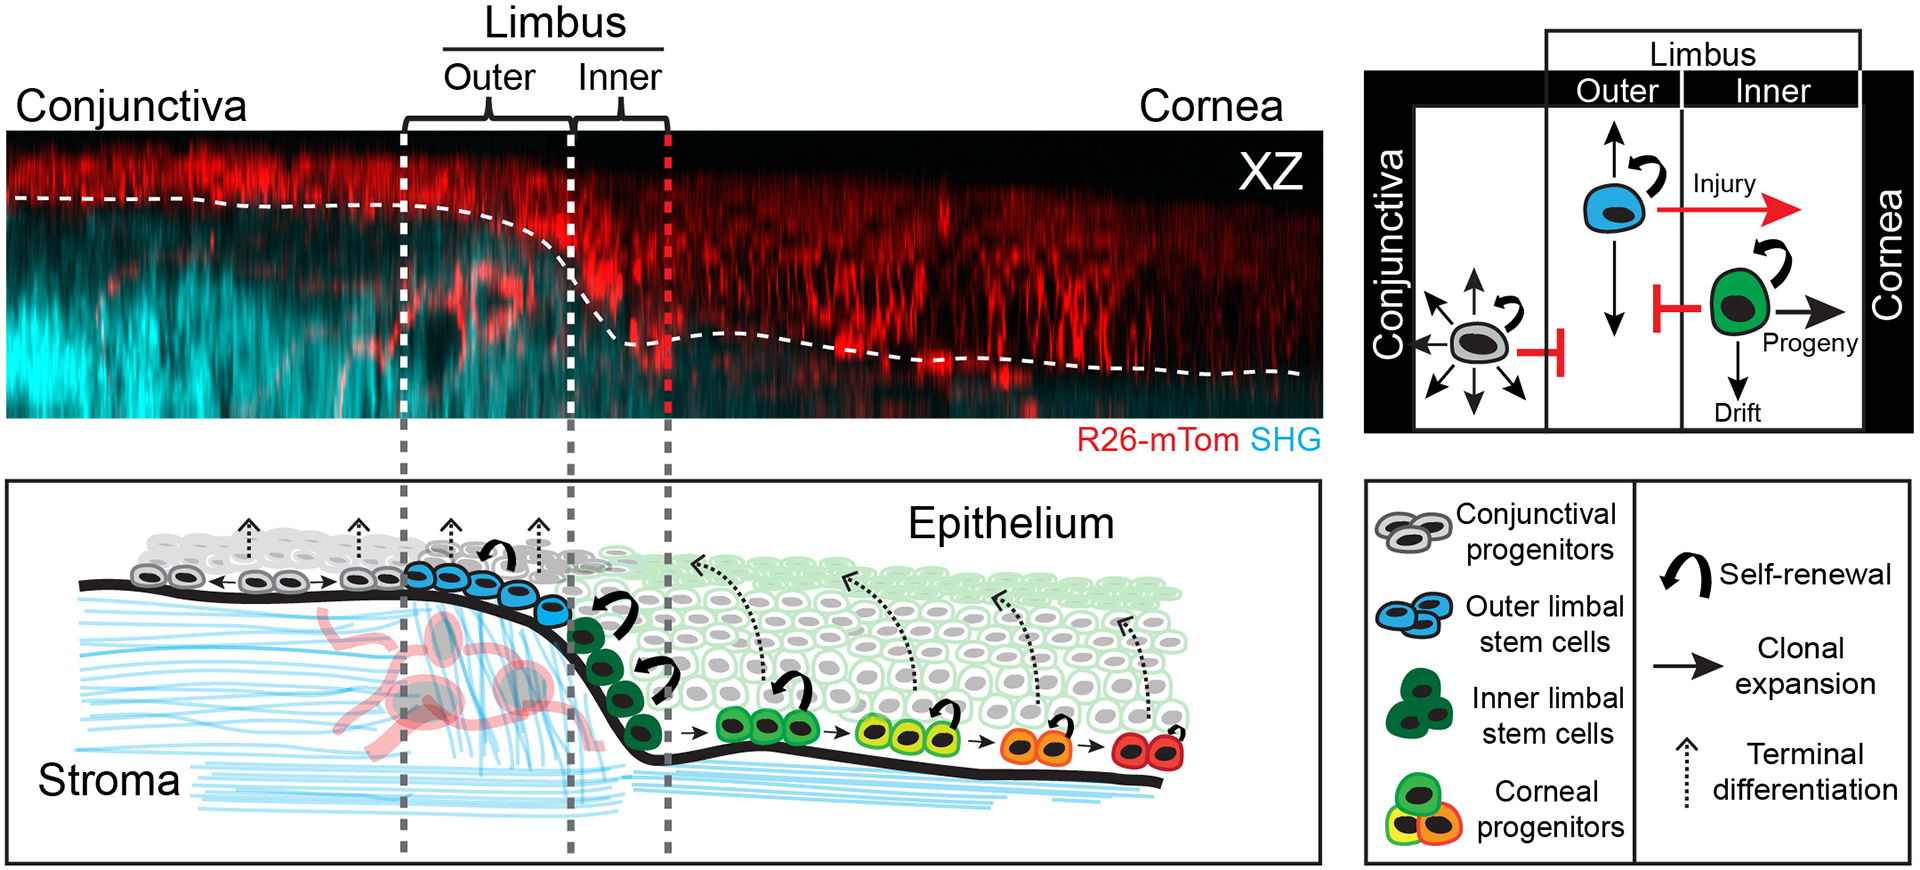
The functional heterogeneity of resident stem cells that support adult organs is incompletely understood. Here, we directly visualize the corneal limbus in the eyes of live mice and identify discrete stem cell niche compartments. By recording the life cycle of individual stem cells and their progeny, we directly analyze their fates and show that their location within the tissue can predict their differentiation status. Stem cells in the inner limbus undergo mostly symmetric divisions and are required to sustain the population of transient progenitors that support corneal homeostasis. Using in situ photolabeling, we captured their progeny exiting the niche before moving centripetally in unison. The long-implicated slow-cycling stem cells are functionally distinct and display local clonal dynamics during homeostasis but can contribute to corneal regeneration after injury. This study demonstrates how the compartmentalized organization of functionally diverse stem cell populations supports the maintenance and regeneration of an adult organ.

Keywords: cornea; epithelia; intravital imaging; limbus; niche; stem cells; two-photon microscopy.


Conflict of interest statement

Declaration of interests The authors declare no competing interests.

Figures

Figure 1.
Figure 1.. Live imaging of the limbal niche reveals distinct clonal growth patterns.
(A) Intravital imaging of the mouse eye is performed at single-cell resolution with 2-photon microscopy. (B) Experimental strategy to resolve stem cell dynamics in the ocular surface epithelium by in vivo longitudinal lineage tracing. Also see Movies S1, S2 and S3. (C) Examples of live mouse eyes imaged by brightfield (left) and 2-photon (right) microscopy. (D) Expanded view of the limbus after three months of lineage tracing illustrating the distinct organization and relative position of clones in the outer limbus (cyan arrows) and inner limbus (yellow arrows). (E) Two representative optical planes of the limbus, at the indicated depth from the surface, and a reconstructed side view (XZ). (F) Experimental strategy and genetic alleles for in vivo lineage tracing by longitudinal live imaging. (G) Lineage tracing time series from re-imaging the same eye at the indicated time points after induction. Representative magnified views of indicated areas in the conjunctiva, outer limbus and cornea (lower panels). (H) Quantification of clonal decay measured as a fraction of clones that persist within the indicated compartments at each re-imaging time point. For these quantifications, the inner limbus is considered part of the cornea due to the uniform origin of centripetally expanding corneal clones from this compartment (n = 725 traced clones in 6 re-sampled areas from 2 mice, p = 0.0024; 2-way ANOVA). (I) Quantification of size distribution of clones in each epithelial compartment across the different time points (n = 1775 clones in 12 randomly sampled areas from 2 mice p < 0.0001; Nested 1-way ANOVA). (J) Radial graphs show quantification of clonal growth anisotropy five days after induction, measured as the angle between each clone’s Feret’s diameter and the radial line that connects the limbus with the center of the cornea (n = 306 clones in 4 randomly sampled areas per compartment, from 2 mice; ****p < 0.0001). Panels C, D, E and G show tiled images of the cornea and limbus constructed from multiple fields-of-view. Dotted lines indicate the margins of the outer (white) and inner (red) limbus. Scale bars: 500 μm (C, G), 200 μm (D, E).
Figure 2.
Figure 2.. Photo-labeling and tracking of stem cell dynamics in the live eye.
(A) Experimental strategy to directly capture the mobility and fate of stem/progenitor cells in the ocular surface epithelium. All basal cells within the selected area are marked in situ by laser scanning a globally-expressed, photo-activatable reporter (PAGFP). Post-mitotic corneal endothelial cells are used as a reference. The movement and fate of marked cells are tracked over time by re-imaging the same areas of the eye. (B) Low magnification, widefield fluorescent image of the eye showing the location of photo-labeled cells (left panel). Full-thickness projections of serial optical sections acquired by 2-photon microscopy (right panels). Basal corneal progenitors (magenta) co-localize with endothelial cells (yellow) immediately after photo-activation, but show uniform centripetal translocation over time. Also see Movie S4. (C) Quantification of cellular translocation rates across the ocular surface epithelium (n = 12 tracked groups of labeled cells from 3 mice, ****p < 0.0001). (D) Basal cells in the limbal area are marked in a checkered pattern to capture local cellular dynamics. Pattern deformation shows centripetal expansion from the inner limbus, but not the outer limbus or conjunctiva. The collagen fiber organization (SHG) in the underlying limbal stroma is shown for positional reference. Scale bars: 200 μm.
Figure 3.
Figure 3.. Capturing the activity of slow-cycling cells in the live limbal niche.
(A) Experimental strategy and genetic alleles used to visualize slow-cycling, label-retaining cells in the anterior ocular epithelium. Tamoxifen induces the uniform expression of the H2B-GFP fusion reporter in all basal cells. Addition of Doxycycline to the diet suppresses the expression of the reporter that is subsequently diluted among daughter cells after each cell division. (B) Global and high-magnification views of the eye imaged at the indicated time points following the addition of Doxycycline. (C) Quantification of label retention in cells within the indicated epithelial compartments (n = 15 sampled images per time point from 2 mice, p < 0.001; 2-way ANOVA). (D) Examples capturing the activity of slow-cycling limbal cells in real time by live imaging. Label-retaining cells in the limbus are imaged at single-cell resolution after a 20-day chase period, and the same cells are re-imaged at daily intervals. Yellow arrows show a label-retaining cell undergoing two symmetric cell divisions. The cyan arrow indicates a cell that remains quiescent during the entire time course. Also see Movie S5. (E) Experimental strategy and genetic alleles to visualize label-retaining cells in the limbus using an in vivo photo-activatable reporter. H2B-PAGFP expressing cells in the limbal area are marked by photo-activation and the same cells are re-imaged after a chase period. (F) Low magnification, widefield fluorescent image of the eye immediately after photo-labeling cells in the limbal area (left panel). High magnification views of the same photo-labeled cells at the beginning and end of the chase period acquired by 2-photon live imaging (right panels). (G) Representative images of the limbal area taken at weekly intervals after Tamoxifen induction. Prior to induction, cells in the limbus were photo-labeled and chased to reveal label-retaining cells. Dotted lines indicate the margins of the outer (white) and inner (red) limbus. Panels B, D, F and G show tiled images of the cornea and limbus constructed from multiple fields-of-view. Scale bars: 200 μm.
Figure 4.
Figure 4.. Direct quantitative fate analysis of single limbal stem cells.
(A) Experimental strategy to capture and quantify fates at the single-cell level by live imaging. The area where individually marked stem cells are located is imaged with a series of optical sections capturing all the layers of the epithelium. The exact same areas are then re-imaged at regular time intervals and the fate decisions of each stem cell is directly captured and analyzed. (B) Representative examples of tracking the fates of single cells in the limbus and cornea. Lineage trees are constructed from analyzing the cell division and differentiation events between each time point. (C) Diagram showing the compartmentalization of the limbus and cornea based on the stratification of the clonal analysis data. (D) Quantification of the relative distribution of captured cell fates within the indicated compartments of the limbus and cornea (n = 167 fate events analyzed in 68 lineage trees from 2 mice, p < 0.002; 2-way ANOVA). (E) Quantification of aggregate cell number in followed lineages over the entire tracking period (n = 544 cells in 68 clones, p < 0.001; 2-way ANOVA). (F) Quantification of average cell number per tracked clone. (n = 9,7, 13, 39 clones analyzed per cell compartment). (G) Quantification of the relative distribution of cell division time within the indicated compartments of the limbus and cornea (n = 66 cell divisions, p < 0.001, 2-way ANOVA). Panel C shows a tiled image of the cornea and limbus constructed from multiple fields-of-view. Scale bar: 20 μm.
Figure 5.
Figure 5.. Differentiation dynamics of limbal stem cells and corneal progenitors.
(A) Quantification of stratification rates of terminally differentiated cells in the ocular surface epithelium. The time between the departure from the basal layer and desquamation of a terminally differentiating cell is measured and averaged for each epithelial compartment (n = 32 tracked cells from 2 mice, p = 0.75; 1-way ANOVA). (B) Quantification of the total number of basal and suprabasal cells per area, measured for each epithelial compartment (n = 24 images analyzed from 3 mice, p < 0.001; 2-way ANOVA). (C) Representative examples of directly tracking terminally differentiating cells as they transit across the suprabasal layers before desquamation. The pseudo-colored images are projections of all time points and are used to emphasize the relative lateral and vertical positions of the tracked cells during all stages of terminal differentiation. Also see Movie S6. Scale bars: 50 μm.
Figure 6.
Figure 6.. Testing the requirement of limbal stem cells for corneal homeostasis and wound healing.
(A) Experimental strategy to test the requirement of stem cells in the inner limbus in sustaining the homeostatic maintenance of their corneal-fated progeny. (B) Diagram depicting a high magnification view of the limbus before and after ablating inner limbal clones (red). Outer limbal clones are shown in blue, intact inner limbal clones are shown in black. (C) Regression of corneal lineages after ablation of their respective stem cells in the inner limbus. Example shows global and high-magnification live views of the eye and limbus, imaged at the indicated time points, before and after the ablation of stem cells in the inner limbus. A pseudo-colored overlay is used to demarcate labeled clones in the outer limbus (blue), as well as the ablated (red) and intact (black) clones in the cornea. Also see Movie S7. (D) Imaging time course after corneal epithelial debridement wound. Yellow arrow indicates cells in the outer limbus entering the cornea. Panels C and D show tiled images of the cornea and limbus constructed from multiple fields-of-view. Scale bars: 20 μm.
Figure 7.
Figure 7.. Model for the spatiotemporal organization of stem cell activity during corneal homeostasis.
Proposed model of the bi-compartmentalized stem cell organization of the limbal niche based on direct visualization of their long-term clonal dynamics, the quantification of individual fate choices and their respective contributions to corneal homeostasis. Stem cells in the outer limbus are slow-cycling and display local clonal dynamics. Stem cells in the inner limbus undergo primarily symmetric cell divisions and are required to sustain the progenitors that support the homeostatic maintenance of the corneal epithelium. Progenitors that exit the niche transit centripetally within the basal layer, in unison, switching to mostly asymmetric cell divisions as they move closer to central cornea. Terminally differentiating cells in the cornea leave the basal layer and transit upwards in a centrifugal trajectory before they are shed from the tissue.

Comment in

References

    1. Amitai-Lange A, Altshuler A, et al., 2015. Lineage tracing of stem and progenitor cells of the murine corneal epithelium. Stem cells (Dayton, Ohio), 33(1), pp. 230–239. - PubMed
    1. Amitai-Lange A, Berkowitz E, et al., 2015. A Method for Lineage Tracing of Corneal Cells Using Multi-color Fluorescent Reporter Mice. Journal of visualized experiments : JoVE, (106), p. e53370. - PMC - PubMed
    1. Belokhvostova D et al., 2018. Homeostasis, regeneration and tumour formation in the mammalian epidermis. The International journal of developmental biology, 62(6-7-8), pp. 571–582. - PMC - PubMed
    1. Burton MJ, 2009. Prevention, treatment and rehabilitation. Community eye health, 22(71), pp. 33–35. - PMC - PubMed
    1. Busch K et al., 2015. Fundamental properties of unperturbed haematopoiesis from stem cells in vivo. Nature, 518(7540), pp. 542–546. - PubMed

Publication types